Firstcall recommends an ethnic Indian foods scrip
•
1 like•304 views

Firstcall recommends ADF Foods for a target of Rs82 for the mid- to long-term

Recommended
Recommended
More Related Content
What's hot
What's hot (19)
Viewers also liked
Viewers also liked (12)
Similar to Firstcall recommends an ethnic Indian foods scrip
Similar to Firstcall recommends an ethnic Indian foods scrip (19)
More from IndiaNotes.com
More from IndiaNotes.com (20)
Recently uploaded
Recently uploaded (20)
Firstcall recommends an ethnic Indian foods scrip
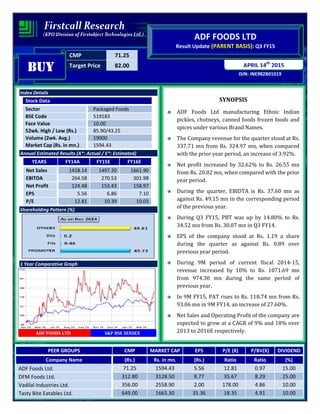
- 1. CMP 71.25 Target Price 82.00 ISIN: INE982B01019 APRIL 14th 2015 ADF FOODS LTD Result Update (PARENT BASIS): Q3 FY15 BUYBUYBUYBUY Index Details Stock Data Sector Packaged Foods BSE Code 519183 Face Value 10.00 52wk. High / Low (Rs.) 85.90/43.25 Volume (2wk. Avg.) 19000 Market Cap (Rs. in mn.) 1594.43 Annual Estimated Results (A*: Actual / E*: Estimated) YEARS FY14A FY15E FY16E Net Sales 1418.14 1497.20 1661.90 EBITDA 264.58 270.53 301.98 Net Profit 124.48 153.43 158.97 EPS 5.56 6.86 7.10 P/E 12.81 10.39 10.03 Shareholding Pattern (%) 1 Year Comparative Graph ADF FOODS LTD S&P BSE SENSEX SYNOPSIS ADF Foods Ltd manufacturing Ethnic Indian pickles, chutneys, canned foods frozen foods and spices under various Brand Names. The Company revenue for the quarter stood at Rs. 337.71 mn from Rs. 324.97 mn, when compared with the prior year period, an increase of 3.92%. Net profit increased by 32.62% to Rs. 26.55 mn from Rs. 20.02 mn, when compared with the prior year period. During the quarter, EBIDTA is Rs. 37.60 mn as against Rs. 49.15 mn in the corresponding period of the previous year. During Q3 FY15, PBT was up by 14.80% to Rs. 34.52 mn from Rs. 30.07 mn in Q3 FY14. EPS of the company stood at Rs. 1.19 a share during the quarter as against Rs. 0.89 over previous year period. During 9M period of current fiscal 2014-15, revenue increased by 10% to Rs. 1071.69 mn from 974.30 mn during the same period of previous year. In 9M FY15, PAT rises to Rs. 118.74 mn from Rs. 93.06 mn in 9M FY14, an increase of 27.60%. Net Sales and Operating Profit of the company are expected to grow at a CAGR of 9% and 18% over 2013 to 2016E respectively. PEER GROUPS CMP MARKET CAP EPS P/E (X) P/BV(X) DIVIDEND Company Name (Rs.) Rs. in mn. (Rs.) Ratio Ratio (%) ADF Foods Ltd. 71.25 1594.43 5.56 12.81 0.97 15.00 DFM Foods Ltd. 312.80 3128.50 8.77 35.67 8.29 25.00 Vadilal Industries Ltd. 356.00 2558.90 2.00 178.00 4.86 10.00 Tasty Bite Eatables Ltd. 649.00 1665.30 35.36 18.35 4.91 10.00
- 2. QUARTERLY HIGHLIGHTS (PARENT BASIS) Results updates- Q3 FY15, Months Dec-14 Dec-13 % Change Net Sales 337.71 324.97 3.92 PAT 26.55 20.02 32.62 EPS 1.19 0.89 32.62 EBITDA 37.60 49.15 (23.50) The Company revenue for the quarter stood at Rs. 337.71 million from Rs. 324.97 million, when compared with the prior year period, an increase of 3.92%. Net profit increased by 32.62% to Rs. 26.55 million from Rs. 20.02 million, when compared with the prior year period. Reported earnings per share of the company stood at Rs. 1.19 a share during the quarter as against Rs. 0.89 over previous year period. Profit before interest, depreciation and tax is Rs. 37.60 million as against Rs. 49.15 million in the corresponding period of the previous year. Break up of Expenditure Particulars Rs. Million Q3 FY15 Q3 FY14 % Change Cost of Material Consumed 136.19 116.88 17% Employee Benefit Expenses 31.93 30.23 6% Depreciation & Amortization 18.12 17.16 6% Other Expenditure 104.62 107.56 -3% Purchase of stock in trade 19.53 14.04 39%
- 3. COMPANY PROFILE ADF Foods Limited manufactures, markets, and distributes ethnic Indian food products. Its products include ready to eat curries, Indian pickles, chutneys, instant mixes, canned food, mango pulp, condiment pastes, vegetables in brine, frozen parathas and naans, frozen vegetables, snacks, frozen paste cubes and paneer, frozen rolls and entrees, curry powder, poppadums, cooking sauces and pastes, flavored water, and frozen breads. The company offers its products under the Ashoka, Camel, Aeroplane, Truly Indian, Khansaama, and ADF Soul brands through distribution networks in Europe, the United States, the Middle East, Australia, Canada, and Asia. It also offers contract manufacturing services. ADF Foods Limited was founded in 1932 and is based in Mumbai, India. Products Ashoka Truly Indian Camel Aeroplane Khansaama ADF Soul
- 4. FINANCIAL HIGHLIGHT (PARENT BASIS) (A*- Actual, E* -Estimations & Rs. In Millions) Balance sheet as at March 31, 2013A-2016E FY13A FY14A FY15E FY16E EQUITY AND LIABILITIES: Shareholders’ Funds: Share Capital 223.78 223.78 223.78 223.78 Reserves and Surplus 1332.58 1421.13 1574.56 1733.54 1) Sub Total - Net worth 1556.36 1644.91 1798.34 1957.32 Non-Current Liabilities: Long-term borrowings 1.52 0.30 0.21 0.19 Deferred Tax Liabilities [Net] 62.20 70.84 63.76 66.94 Other Long Term Liabilities 2.50 2.50 2.65 2.78 Long Term Provisions 9.92 10.50 14.49 16.23 2) Sub Total - Non-Current Liabilities 76.14 84.14 81.11 86.14 Current Liabilities: Short-term borrowings 252.90 150.70 167.28 180.66 Trade Payables 49.75 87.90 70.32 75.24 Other Current Liabilities 27.44 34.85 40.77 45.67 Short Term Provisions 53.25 46.03 49.71 52.70 3) Sub Total - Current Liabilities 383.34 319.48 328.08 354.26 Total Liabilities (1+2+3) 2015.84 2048.53 2207.53 2397.72 ASSETS: Non-Current Assets: Fixed Assets Tangible Assets 390.78 383.11 398.43 418.36 Intangible Assets 326.10 285.30 299.57 311.55 Capital work-in-progress 0.99 85.05 99.69 112.65 a) Sub Total - Fixed Assets 717.87 753.46 797.69 842.55 b) Non Current Investments 67.89 169.61 189.96 208.96 c) Long Term Loans and Advances 31.22 21.10 27.64 32.62 d) Other non-current assets 45.00 0.62 0.91 1.00 4. Sub Total - Non-Current Assets 861.98 944.79 1016.20 1085.13 Current Assets: Current Investments 295.00 210.00 140.70 158.99 Inventories 203.48 222.94 267.53 307.66 Trade Receivables 333.44 281.75 259.21 274.76 Cash and Bank Balances 78.34 120.60 150.75 174.87 Short Term Loans and Advances 243.60 268.45 373.15 396.31 5. Sub Total - Current Assets 1153.86 1103.74 1191.33 1312.59 Total Assets (4+5) 2015.84 2048.53 2207.53 2397.72
- 5. Annual Profit & Loss Statement for the period of 2013 to 2016E Value(Rs. mn) FY13A FY14A FY15E FY16E Description 12m 12m 12m 12m Net Sales 1296.92 1418.14 1497.20 1661.90 Other Income 34.04 39.92 60.41 67.66 Total Income 1330.96 1458.06 1557.61 1729.55 Expenditure -1147.85 -1193.48 -1287.08 -1427.57 Operating Profit 183.11 264.58 270.53 301.98 Interest -16.26 -11.37 -9.94 -10.34 Gross profit 166.85 253.21 260.59 291.64 Depreciation -41.46 -73.27 -75.35 -79.12 Exceptional Items 71.98 0.00 17.46 0.00 Profit Before Tax 197.36 179.94 202.70 212.53 Tax -41.50 -55.46 -49.27 -53.56 Net Profit 155.86 124.48 153.43 158.97 Equity capital 223.78 223.78 223.78 223.78 Reserves 1332.58 1421.13 1574.56 1733.54 Face value 10.00 10.00 10.00 10.00 EPS 6.96 5.56 6.86 7.10 Quarterly Profit & Loss Statement for the period of 30th June, 2014 to 31st Mar, 2015E Value(Rs. mn) 30-Jun-14 30-Sep-14 31-Dec-14 31-Mar-15E Description 3m 3m 3m 3m Net Sales 385.55 348.43 337.71 425.51 Other income 19.89 19.72 9.81 10.99 Total Income 405.44 368.15 347.52 436.50 Expenditure -310.69 -299.25 -309.92 -367.22 Operating profit 94.75 68.90 37.60 69.28 Interest -2.41 -2.57 -2.42 -2.54 Gross profit 92.34 66.33 35.18 66.74 Depreciation -17.48 -18.73 -18.12 -21.02 Exceptional Items 0.00 0.00 17.46 0.00 Profit Before Tax 74.86 47.60 34.52 45.72 Tax -18.72 -11.55 -7.97 -11.03 Net Profit 56.14 36.05 26.55 34.69 Equity capital 223.78 223.78 223.78 223.78 Face value 10.00 10.00 10.00 10.00 EPS 2.51 1.61 1.19 1.55
- 6. Ratio Analysis Particulars FY13A FY14A FY15E FY16E EPS (Rs.) 6.96 5.56 6.86 7.10 EBITDA Margin (%) 14.12% 18.66% 18.07% 18.17% PBT Margin (%) 15.22% 12.69% 13.54% 12.79% PAT Margin (%) 12.02% 8.78% 10.25% 9.57% P/E Ratio (x) 10.23 12.81 10.39 10.03 ROE (%) 10.01% 7.57% 8.53% 8.12% ROCE (%) 12.40% 18.81% 17.59% 17.82% EV/EBITDA (x) 8.06 5.35 5.44 4.77 Book Value (Rs.) 69.55 73.51 80.36 87.47 P/BV 1.02 0.97 0.89 0.81 Charts
- 7. OUTLOOK AND CONCLUSION At the current market price of Rs. 71.25, the stock P/E ratio is at 10.39 x FY15E and 10.03 x FY16E respectively. Earnings per share (EPS) of the company for the earnings for FY15E and FY16E are seen at Rs. 6.86 and Rs. 7.10 respectively. Net Sales and Operating Profit of the company are expected to grow at a CAGR of 9% and 18% over 2013 to 2016E respectively. On the basis of EV/EBITDA, the stock trades at 5.44 x for FY15E and 4.77 x for FY16E. Price to Book Value of the stock is expected to be at 0.89 x and 0.81 x respectively for FY15E and FY16E. We recommend ‘BUY’ in this particular scrip with a target price of Rs. 82.00 for Medium to Long term investment. INDUSTRY OVERVIEW India holds the second-largest arable land resources in the world and also possesses 46 of the 60 soil types in the world. The country is the largest producer of pulses, milk, tea, cashew, mangoes, and buffalo meat; and the second-largest producer of tea, wheat, sugarcane, and rice. The domestic food processing industry in India is expected to reach US$ 200 billion in 2015 from US$ 135 billion in 2012. This industry ranks fifth in India in terms of production, consumption and exports. The sector is expected to contribute 6.5 per cent to the country's gross domestic product (GDP) by FY15. The unorganised sector accounts for 42 per cent of India's food processing industry, followed by small-scale industries at 33 per cent and the organised sector at 25 per cent. The Government of India's strong policy support gives a boost to this sector. Some of these policies, such as encouraging the private sector by exempting the export earnings from corporate taxes, has helped in this sector's growth. The government has also allowed 100 per cent foreign direct investment (FDI) under automatic route, opened up mega food parks, assigned Agri Export Zones and provided incentives for development of storage facilities. There is enough scope for growth in the food industry in supply chain infrastructure and contract farming. Also, the government's policies are expected to help turn the Indian food processing industry into a global outsourcing hub.
- 8. Disclaimer: This document is prepared by our research analysts and it does not constitute an offer or solicitation for the purchase or sale of any financial instrument or as an official confirmation of any transaction. The information contained herein is from publicly available data or other sources believed to be reliable but we do not represent that it is accurate or complete and it should not be relied on as such. Firstcall Research or any of its affiliates shall not be in any way responsible for any loss or damage that may arise to any person from any inadvertent error in the information contained in this report. Firstcall Research and/ or its affiliates and/or employees will not be liable for the recipients’ investment decision based on this document.
- 9. Firstcall India Equity Research: Email – info@firstobjectindia.com C.V.S.L.Kameswari Pharma & Diversified U. Janaki Rao Capital Goods B. Anil Kumar Auto, IT & FMCG M. Vinayak Rao Diversified G. Amarender Diversified Firstcall Research Provides Industry Research on all the Sectors and Equity Research on Major Companies forming part of Listed and Unlisted Segments For Further Details Contact: Tel.: 022-2527 2510/2527 6077 / 25276089 Telefax: 022-25276089 040-20000235 /20000233 E-mail: info@firstobjectindia.com www.firstcallresearch.com