Firstcall atul 7may15[1]
•
1 like•239 views

This document provides an analysis of Atul Limited, an Indian agrochemical company. It includes the company's current stock price and target price, as well as financial highlights such as revenue, earnings, ratios and outlook. The analysis recommends buying the stock based on expected revenue and earnings growth, reasonable valuation multiples, and the company's leadership position in the agrochemical industry in India.

Recommended
Recommended
More Related Content
What's hot
What's hot (19)
Viewers also liked
Viewers also liked (13)
Similar to Firstcall atul 7may15[1]
Similar to Firstcall atul 7may15[1] (19)
More from IndiaNotes.com
More from IndiaNotes.com (20)
Firstcall atul 7may15[1]
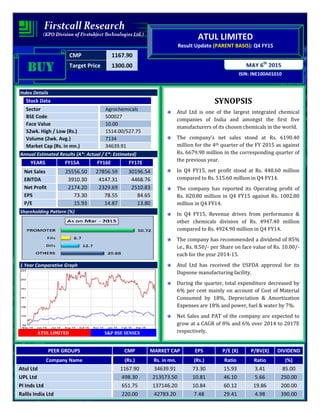
- 1. CMP 1167.90 Target Price 1300.00 ISIN: INE100A01010 MAY 6th 2015 ATUL LIMITED Result Update (PARENT BASIS): Q4 FY15 BUYBUYBUYBUY Index Details Stock Data Sector Agrochemicals BSE Code 500027 Face Value 10.00 52wk. High / Low (Rs.) 1514.00/527.75 Volume (2wk. Avg.) 7134 Market Cap (Rs. in mn.) 34639.91 Annual Estimated Results (A*: Actual / E*: Estimated) YEARS FY15A FY16E FY17E Net Sales 25556.50 27856.59 30196.54 EBITDA 3910.30 4147.31 4468.76 Net Profit 2174.20 2329.69 2510.83 EPS 73.30 78.55 84.65 P/E 15.93 14.87 13.80 Shareholding Pattern (%) 1 Year Comparative Graph ATUL LIMITED S&P BSE SENSEX SYNOPSIS Atul Ltd is one of the largest integrated chemical companies of India and amongst the first five manufacturers of its chosen chemicals in the world. The company’s net sales stood at Rs. 6190.40 million for the 4th quarter of the FY 2015 as against Rs. 6679.90 million in the corresponding quarter of the previous year. In Q4 FY15, net profit stood at Rs. 448.60 million compared to Rs. 515.60 million in Q4 FY14. The company has reported its Operating profit of Rs. 820.80 million in Q4 FY15 against Rs. 1002.80 million in Q4 FY14. In Q4 FY15, Revenue drives from performance & other chemicals division of Rs. 4947.40 million compared to Rs. 4924.90 million in Q4 FY14. The company has recommended a dividend of 85% i.e., Rs. 8.50/- per Share on face value of Rs. 10.00/- each for the year 2014-15. Atul Ltd has received the USFDA approval for its Dapsone manufacturing facility. During the quarter, total expenditure decreased by 6% per cent mainly on account of Cost of Material Consumed by 18%, Depreciation & Amortization Expenses are 18% and power, fuel & water by 7%. Net Sales and PAT of the company are expected to grow at a CAGR of 8% and 6% over 2014 to 2017E respectively. PEER GROUPS CMP MARKET CAP EPS P/E (X) P/BV(X) DIVIDEND Company Name (Rs.) Rs. in mn. (Rs.) Ratio Ratio (%) Atul Ltd 1167.90 34639.91 73.30 15.93 3.41 85.00 UPL Ltd 498.30 213573.50 10.81 46.10 5.66 250.00 PI Inds Ltd 651.75 137146.20 10.84 60.12 19.86 200.00 Rallis India Ltd 220.00 42783.20 7.48 29.41 4.98 390.00
- 2. QUARTERLY HIGHLIGHTS (PARENT BASIS) Results updates- Q4 FY15, Rs. In million MAR-15 MAR-14 % Change Net Sales 6190.40 6679.90 (7.33) Net profit 448.60 515.60 (12.99) EPS 15.12 17.38 (12.99) EBITDA 820.80 1002.80 (18.15) Atul Ltd achieved a turnover of Rs. 6190.40 million for the 4th quarter of the financial year 2015 as against Rs. 6679.90 million in the corresponding quarter of the previous year. The company has reported an EBITDA of Rs. 820.80 million against Rs. 1002.80 million. In the same quarter, net profit stood at Rs. 448.60 million against Rs. 515.60 million in the corresponding quarter of the previous year. The company has reported an EPS of Rs. 15.12 for the 4th quarter as against an EPS of Rs. 17.38 for the corresponding quarter of the previous year. Break up of Expenditure During the quarter, total expenditure decreased by 6% per cent mainly on account of Cost of Material Consumed by 18%, Depreciation & Amortization Expenses are 18% and power, fuel & water by 7% are the main impact of decrease of expenditure when compared to corresponding quarter of previous year. Whereas Employee Benefits expenses rose by 10%, purchase of stock in trade 13% and along with other expenditure by 12%. Total expenditure in Q4 FY15 stood to Rs. 5525.30 million as against Rs. 5853.50 million in Q4 FY14. Break up of Expenditure (Rs. millions) Q4 FY15 Q4 FY14 Cost of Material Consumed 2925.4 3549 Purchase of stock in trade 58.4 51.7 Employee Benefit Expenses 366.5 331.9 Depreciation & Amortization Expenses 142 173 Power, Fuel & Water 734.6 790.5 Other Expenses 1051.9 941
- 3. Segment Revenue COMPANY PROFILE Atul Ltd. is one of the largest integrated chemical companies of India and amongst the first five manufacturers of its chosen chemicals in the world. The Company serves about 4,000 customers belonging to the Adhesives, Agriculture, Animal Feed, Automobile, Chemical, Composites, Construction, Cosmetic, Defence, Dyestuff, Electrical and Electronics, Flavour and Fragrance, Food, Glass, Home Care, Horticulture, Hospitality, Paint and Coatings, Paper, Personal Care, Pharmaceutical, Plastic, Polymer, Rubber, Soap and Detergent, Textile and Tyre industries. The Company sells about 1,350 diverse products and formulations, placed under 41 (2012-13) product groups. Atul Ltd is an integrated chemical company serving about 4,000 customers belonging to 27 industries across the world. Industries served
- 4. Business Areas In order to enhance focus, the company has placed the products belonging to the two Reporting Segments, namely Life Science Chemicals and Performance & Other Chemicals under seven Businesses, namely, Aromatics, Bulk Chemicals, Colors, Crop Protection, Floras, Pharmaceuticals and Polymers. Subsidiary and Joint Venture Companies The Company has established subsidiary companies in the USA (1994), the UK (1996), Germany (1998), China (2004) and Brazil (2012) to serve its customers and thus enhance breadth and depth of its business. The Company has nine subsidiary companies namely, Atul Bioscience Ltd, Atul Rajasthan Date Palms Ltd, Atul USA Inc, Atul Europe Ltd, Atul Deutschland GmbH, Atul China Ltd, Atul Brasil Quimicos Ltda and Ameer Trading Corporation Ltd. Atul established successful joint venture companies with world-renowned multi-national companies namely American Cyanamid Company (now a part of BASF AG and Pfizer Inc) in 1947, Imperial Chemical Industries plc (now a part of Akzo Nobel and Astra Zeneca plc) in 1955 and Ciba-Geigy Ltd (now a part of BASF AG and Huntsman Corporation) in 1960.
- 5. FINANCIAL HIGHLIGHTS (PARENT BASIS) (A*- Actual, E* -Estimations & Rs. In Millions) Balance Sheet as at 31st March, 2014-2017E. FY-14A FY-15A FY-16E FY-17E I SOURCES OF FUNDS A) Shareholder's Funds Share Capital 296.80 296.80 296.80 296.80 Reserves and Surplus 9119.10 9861.00 10551.27 11226.55 Sub-Total Net worth 9415.90 10157.80 10848.07 11523.35 B) Non Current Liabilities long term borrowing 1133.60 540.80 416.42 324.80 Deferred Tax Liability (net) 353.90 444.10 546.24 655.49 Other Long term liabilities 178.00 201.30 217.40 232.62 Long term Provisions 151.60 158.60 174.95 188.95 Sub-Total -Non Current liabilities 1817.10 1344.80 1355.01 1401.87 C) Current Liabilities Short term borrowings 1842.70 1641.40 1477.26 1364.99 Trade payables 3190.10 2626.30 2232.36 2009.12 Other Current liabilities 1159.30 1422.20 1678.20 1946.71 Short term Provisions 332.40 425.60 536.26 664.96 Sub-Total-Current Liabilities 6524.50 6115.50 5924.07 5985.77 Total Liabilities (a + b + c) 17757.50 17618.10 18127.15 18910.99 II APPLICATION OF FUNDS 1) Non-Current Assets Fixed Assets 5725.80 5783.40 5922.20 6218.31 Non Current Investments 1364.70 1488.20 1607.26 1719.76 Long Term loans and advances 312.00 448.20 573.70 676.96 Other non-current assets 643.10 541.30 476.34 501.52 Sub-Total- Non-Current Assets 8045.60 8261.10 8579.50 9116.55 2) Current Assets Inventories 3757.50 3496.50 3370.63 3212.65 Trade receivables 4472.60 4391.90 4629.06 4953.10 Cash and Bank Balances 88.00 64.00 76.80 90.62 Short-terms loans & advances 1025.40 1074.60 1121.88 1160.03 Other current assets 368.40 330.00 349.28 378.04 Sub-Total Current Assets 9711.90 9357.00 9547.65 9794.44 Total Assets (1+2) 17757.50 17618.10 18127.15 18910.99
- 6. Annual Profit & Loss Statement for the period of 2014 to 2017E Value(Rs. mn) FY14A FY15A FY16E FY17E Description 12m 12m 12m 12m Net Sales 23654.50 25556.50 27856.59 30196.54 Other Income 396.20 153.10 163.82 180.85 Total Income 24050.70 25709.60 28020.40 30377.39 Expenditure -20223.20 -21799.30 -23873.09 -25908.63 Operating Profit 3827.50 3910.30 4147.31 4468.76 Interest -314.30 -236.40 -243.49 -255.67 Gross profit 3513.20 3673.90 3903.82 4213.10 Depreciation -542.30 -552.80 -580.44 -621.07 Profit Before Tax 2970.90 3121.10 3323.38 3592.02 Tax -843.00 -946.90 -993.69 -1081.20 Net Profit 2127.90 2174.20 2329.69 2510.83 Equity capital 296.60 296.60 296.60 296.60 Reserves 8095.10 9861.00 11833.20 14010.51 Face value 10.00 10.00 10.00 10.00 EPS 71.74 73.30 78.55 84.65 Quarterly Profit & Loss Statement for the period of 30th Sept, 2014 to 30th June, 2015E Value(Rs.in.mn) 30-Sep-14 31-Dec-14 31-Mar-15 30-Jun-15E Description 3m 3m 3m 3m Net sales 6624.10 6271.20 6190.40 6338.97 Other income 85.60 38.60 13.70 19.45 Total Income 6709.70 6309.80 6204.10 6358.42 Expenditure -5654.40 -5329.10 -5383.30 -5419.82 Operating profit 1055.30 980.70 820.80 938.60 Interest -57.30 -62.50 -54.90 -50.51 Gross profit 998.00 918.20 765.90 888.10 Depreciation -136.70 -138.50 -142.00 -134.90 Profit Before Tax 861.30 779.70 623.90 753.20 Tax -270.60 -242.60 -175.30 -214.66 Net Profit 590.70 537.10 448.60 538.54 Equity capital 296.60 296.60 296.60 296.60 Face value 10.00 10.00 10.00 10.00 EPS 19.92 18.11 15.12 18.16
- 7. Ratio Analysis Particulars FY14A FY15A FY16E FY17E EPS (Rs.) 71.74 73.30 78.55 84.65 EBITDA Margin (%) 16.18% 15.30% 14.89% 14.80% PBT Margin (%) 12.56% 12.21% 11.93% 11.90% PAT Margin (%) 9.00% 8.51% 8.36% 8.31% P/E Ratio (x) 16.28 15.93 14.87 13.80 ROE (%) 25.36% 21.40% 19.21% 17.55% ROCE (%) 37.11% 33.54% 30.63% 28.63% Debt Equity Ratio 0.40 0.31 0.27 0.24 EV/EBITDA (x) 9.91 9.65 9.13 8.51 Book Value (Rs.) 282.93 342.47 408.96 482.37 P/BV 4.13 3.41 2.86 2.42 Charts
- 8. OUTLOOK AND CONCLUSION At the current market price of Rs. 1167.90, the stock P/E ratio is at 14.87 x FY16E and 13.80 x FY17E respectively. Earning per share (EPS) of the company for the earnings for FY16E and FY17E is seen at Rs.78.55 and Rs.84.65 respectively. Net Sales and PAT of the company are expected to grow at a CAGR of 8% and 6% over 2014 to 2017E respectively. On the basis of EV/EBITDA, the stock trades at 9.13 x for FY16E and 9.13 x for FY17E. Price to Book Value of the stock is expected to be at 2.86 x and 2.42 x respectively for FY16E and FY17E. We recommend ‘BUY’ in this particular scrip with a target price of Rs.1300.00 for Medium to Long term investment. INDUSTRY OVERVIEW Agriculture plays a vital role in the Indian economy. Over 70 per cent of the rural households depend on agriculture as their principal means of livelihood. Agriculture, along with fisheries and forestry, accounts for one- third of the nation’s GDP and is its single largest contributor. The total Share of Agriculture & Allied Sectors (Including agriculture, livestock, forestry and fishery sub sectors) in terms of percentage of GDP is 13.9 percent during 2013-14 at 2004-05 prices. [As per the estimates released by Central Statistics Office] Agricultural exports constitute a fifth of the total exports of the country. In view of the predominant position of the Agricultural Sector, collection and maintenance of Agricultural Statistics assume great importance.
- 9. The country is also the largest producer, consumer and exporter of spices and spice products in the world and overall in farm and agriculture outputs, it is ranked second. From canned, dairy, processed, frozen food to fisheries, meat, poultry, and food grains, the Indian agro industry has plenty of areas to choose for business. The crop protection industry in India was generic in nature with ~80% of molecules non-patented. Hence, a strong distribution network and brand acted as competitive drivers. Insecticides formed the largest segment of the domestic crop protection chemicals market, accounting for 65% of the total market. The market was mostly dependent on rice and cotton crops. Herbicides were the largest growing segment and accounted for 16% of the total crop protection chemicals market. Sales were seasonal, owing to the fact that weeds flourished in damp, warm weather and died in cold spells. Rice and wheat crops consumed the major share of herbicides. Increasing costs of farm labour will drive sales of herbicides going forward. Fungicides, accounting for 15% of the total crop protection market, were used for fruit and vegetables and rice. Farmers moved from cash crops to fruit and vegetables while government support for exports increased fungicides usage. Outlook The Indian agriculture sector is expected to grow with better momentum in the next few years owing to increase in investment in agricultural infrastructure such as irrigation facilities, warehousing and cold storage. Factors such as reduced transaction costs, time, better port gate management and fiscal incentives will also contribute to this upward trend. Furthermore, the increased use of genetically modified crops is also expected to better the yield of the Indian farmers. The 12th Five Year Plan’s estimates of expanding the storage capacity to 35 MT and the target of achieving an overall growth of 4 per cent will also go a long way in modifying the overall face of the Indian agriculture sector in the next few years. The Indian crop protection industry is expected to grow at compound annual growth rate (CAGR) of 12 per cent to reach $7.5 billion by FY19, according to FICCI (Federation of Indian Chambers of Commerce & Industry. It was estimated to be $4.25 billion in FY14. Disclaimer: This document is prepared by our research analysts and it does not constitute an offer or solicitation for the purchase or sale of any financial instrument or as an official confirmation of any transaction. The information contained herein is from publicly available data or other sources believed to be reliable but we do not represent that it is accurate or complete and it should not be relied on as such. Firstcall Research or any of its affiliates shall not be in any way responsible for any loss or damage that may arise to any person from any inadvertent error in the information contained in this report. Firstcall Research and/ or its affiliates and/or employees will not be liable for the recipients’ investment decision based on this document.
- 10. Firstcall India Equity Research: Email – info@firstobjectindia.com C.V.S.L.Kameswari Pharma & Diversified U. Janaki Rao Capital Goods B. Anil Kumar Auto, IT & FMCG M. Vinayak Rao Diversified G. Amarender Diversified Firstcall Research Provides Industry Research on all the Sectors and Equity Research on Major Companies forming part of Listed and Unlisted Segments For Further Details Contact: Tel.: 022-2527 2510/2527 6077 / 25276089 Telefax: 022-25276089 040-20000235 /20000233 E-mail: info@firstobjectindia.com www.firstcallresearch.com