Finolex Ind: Q1 Net profit ramps up by 121.68%; Maintain buy
•
1 like•387 views

Finolex's net profit for the quarter ramps up by 121.68% to Rs. 502.03 million from Rs. 226.47 million, when compared with the prior year period. Investors are recommended to buy the stock for a price target of Rs319 for medium to long term investment.

Recommended
Recommended
More Related Content
What's hot
What's hot (19)
Similar to Finolex Ind: Q1 Net profit ramps up by 121.68%; Maintain buy
Similar to Finolex Ind: Q1 Net profit ramps up by 121.68%; Maintain buy (20)
More from IndiaNotes.com
More from IndiaNotes.com (20)
Recently uploaded
Recently uploaded (20)
Finolex Ind: Q1 Net profit ramps up by 121.68%; Maintain buy
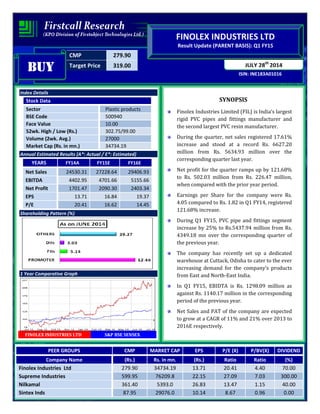
- 1. CMP 279.90 Target Price 319.00 ISIN: INE183A01016 JULY 28th 2014 FINOLEX INDUSTRIES LTD Result Update (PARENT BASIS): Q1 FY15 BUYBUYBUYBUY Index Details Stock Data Sector Plastic products BSE Code 500940 Face Value 10.00 52wk. High / Low (Rs.) 302.75/99.00 Volume (2wk. Avg.) 27000 Market Cap (Rs. in mn.) 34734.19 Annual Estimated Results (A*: Actual / E*: Estimated) YEARS FY14A FY15E FY16E Net Sales 24530.31 27228.64 29406.93 EBITDA 4402.95 4701.66 5155.66 Net Profit 1701.47 2090.30 2403.34 EPS 13.71 16.84 19.37 P/E 20.41 16.62 14.45 Shareholding Pattern (%) 1 Year Comparative Graph FINOLEX INDUSTRIES LTD S&P BSE SENSEX SYNOPSIS Finolex Industries Limited (FIL) is India’s largest rigid PVC pipes and fittings manufacturer and the second largest PVC resin manufacturer. During the quarter, net sales registered 17.61% increase and stood at a record Rs. 6627.20 million from Rs. 5634.93 million over the corresponding quarter last year. Net profit for the quarter ramps up by 121.68% to Rs. 502.03 million from Rs. 226.47 million, when compared with the prior year period. Earnings per Share for the company were Rs. 4.05 compared to Rs. 1.82 in Q1 FY14, registered 121.68% increase. During Q1 FY15, PVC pipe and fittings segment increase by 25% to Rs.5437.94 million from Rs. 4349.18 mn over the corresponding quarter of the previous year. The company has recently set up a dedicated warehouse at Cuttack, Odisha to cater to the ever increasing demand for the company’s products from East and North-East India. In Q1 FY15, EBIDTA is Rs. 1298.09 million as against Rs. 1140.17 million in the corresponding period of the previous year. Net Sales and PAT of the company are expected to grow at a CAGR of 11% and 21% over 2013 to 2016E respectively. PEER GROUPS CMP MARKET CAP EPS P/E (X) P/BV(X) DIVIDEND Company Name (Rs.) Rs. in mn. (Rs.) Ratio Ratio (%) Finolex Industries Ltd 279.90 34734.19 13.71 20.41 4.40 70.00 Supreme Industries 599.95 76209.8 22.15 27.09 7.03 300.00 Nilkamal 361.40 5393.0 26.83 13.47 1.15 40.00 Sintex Inds 87.95 29076.0 10.14 8.67 0.96 0.00
- 2. QUARTERLY HIGHLIGHTS (PARENT BASIS) Results updates- Q1 FY15, Months June-14 June-13 % Change Net Sales 6627.20 5634.93 17.61 PAT 502.03 226.47 121.68 EPS 4.05 1.82 121.68 EBITDA 1298.09 1140.17 13.85 The company net profit jumps to Rs. 502.03 million against Rs. 226.47 million in the corresponding quarter ending of previous year, an increase of 121.68%. The company achieved a turnover of Rs. 6627.20 million registering an increase of 17.61% for the 1st quarter of the current year 2014-15 as against Rs. 5634.93 millions in the corresponding quarter of the previous year. Reported earnings per share of the company stood at Rs. 4.05 a share during the quarter as against Rs. 1.82 over previous year period. Profit before interest, depreciation and tax is Rs. 1298.09 million as against Rs. 1140.17 million in the corresponding period of the previous year. Break up of Expenditure Particulars Rs. million Q1 FY15 Q1 FY14 Cost of materials consumed 3775.64 4106.12 Employee benefits expense 190.89 167.22 Depreciation and amortization expense 149.04 146.45 Power and fuel 262.43 252.81 Other expenditure 482.27 439.09
- 3. Segment Revenue Latest Updates: • The company has recently set up a dedicated warehouse at Cuttack, Odisha to cater to the ever increasing demand for the company’s products from East and North-East India. COMPANY PROFILE Finolex Industries Limited (FIL) is India’s largest rigid PVC pipes and fittings manufacturer and the second largest PVC resin manufacturer. FIL head office is based out of Pune, with manufacturing plants in Pune, Ratnagiri in Maharashtra and Vadodara in Gujarat. Finolex pipes and fittings are available in every state of the country and are sold through a network of dealers, subdealers and retailers. Products PVC-U Pipes & Fittings FIL is the largest PVC-U pipe manufacturer in India and the first to have been awarded the IS/ISO 9001:2000 certification. FIL offers a wide range of PVC-U pipes and fittings, for diverse applications in agriculture, housing, telecom etc. ranging between 20 mm to 400 mm diameter. PVC Resin PVC is a thermoplastic resin, which in versatility of processing and application surpasses all other thermoplastic materials. Today, PVC finds applications in insulation of cables, in pipes and hoses, agricultural products, windows and profiles, flooring tiles used in the building industry, blister packaging, films and sheets, foamed leather cloth, curtains, tarpaulins, and also for medical use - for IV, blood bags, etc.
- 4. Chemicals Finolex is actively trading in Ethylene Di Chloride and Methanol catering to various industries in the country. These products are used as solvents in the Pharma, Fertilizer, Paints, Lamination, Amines and various other industries in India.
- 5. FINANCIAL HIGHLIGHT (PARENT BASIS) (A*- Actual, E* -Estimations & Rs. In Millions) Balance Sheet as at March 31, 2013 -2016E FINOLEX INDUSTRIES LTD FY13A FY14A FY15E FY16E SOURCES OF FUNDS Shareholder's Funds Share Capital 1240.87 1240.95 1240.95 1240.95 Reserves and Surplus 5970.76 6655.93 8863.59 10193.13 1. Sub Total - Net worth 7211.63 7896.88 10104.54 11434.08 Non Current Liabilities Long term Borrowings 1397.09 2322.09 2600.74 2808.80 Deferred Tax Liabilities [Net] 936.35 1063.25 1148.31 1205.73 Other Long Term Liabilities 4.68 4.37 4.63 4.86 Long Term Provisions 136.51 80.65 84.68 93.15 2. Sub Total - Non Current Liabilities 2474.62 3470.36 3838.36 4112.54 Current Liabilities Short Term Borrowings 5709.22 4237.12 3474.44 2988.02 Trade Payables 1841.18 1114.29 980.57 1019.80 Other Current Liabilities 1973.19 1369.36 1232.42 1299.92 Short Term Provisions 796.75 1021.78 1154.61 1258.52 3. Sub Total - Current Liabilities 10320.33 7742.54 6842.04 6566.26 Total Liabilities (1+2+3) 20006.58 19109.79 20784.95 22112.88 Non-Current Assets a) Fixed Assets 9301.32 9376.80 10126.94 10633.29 b) Other non-current assets 4.08 328.09 377.30 422.58 c) Non-current investments 1274.04 1274.04 1375.96 1458.52 d) Long Term loans and advances 196.52 193.22 208.68 219.11 1. Sub Total - Non Current Assets 10775.96 11172.15 12088.89 12733.50 Current Assets Current Investments 2322.05 940.50 1053.36 1148.16 Inventories 4827.78 5059.46 5413.62 5738.44 Trade receivables 387.20 409.88 442.67 464.80 Cash and Bank Balances 90.48 209.19 271.95 331.77 Short-terms loans & advances 1603.10 1318.61 1514.46 1696.20 2. Sub Total - Current Assets 9230.62 7937.64 8696.06 9379.37 Total Assets (1+2) 20006.58 19109.79 20784.95 22112.88
- 6. Annual Profit & Loss Statement for the period of 2013 to 2016E Value(Rs.in.mn) FY13A FY14A FY15E FY16E Description 12m 12m 12m 12m Net Sales 21448.21 24530.31 27228.64 29406.93 Other Income 333.70 436.80 345.08 362.33 Total Income 21781.91 24967.11 27573.72 29769.26 Expenditure -17860.78 -20564.16 -22872.06 -24613.60 Operating Profit 3921.13 4402.95 4701.66 5155.66 Interest -514.49 -663.72 -876.11 -1016.28 Gross profit 3406.64 3739.24 3825.55 4139.38 Depreciation -544.16 -622.92 -685.21 -740.03 Exceptional Items -960.92 -697.70 -166.94 0.00 Profit Before Tax 1901.56 2418.62 2973.40 3399.35 Tax -540.20 -717.15 -883.10 -996.01 Net Profit 1361.36 1701.47 2090.30 2403.34 Equity capital 1240.95 1240.95 1240.95 1240.95 Reserves 5970.76 6655.93 8863.59 10193.13 Face value 10.00 10.00 10.00 10.00 EPS 10.97 13.71 16.84 19.37 Quarterly Profit & Loss Statement for the period of 31st Dec, 2013 to 30th Sep, 2014E Value(Rs.in.mn) 31-Dec-13 31-Mar-14 30-Jun-14 30-Sep-14E Description 3m 3m 3m 3m Net sales 6598.86 8397.41 6627.20 5169.22 Other income 8.87 61.87 52.16 56.33 Total Income 6607.73 8459.28 6679.36 5225.55 Expenditure -5419.10 -7371.97 -5381.27 -4274.94 Operating profit 1188.63 1087.31 1298.09 950.61 Interest -187.72 -216.96 -267.57 -232.79 Gross profit 1000.91 870.35 1030.52 717.82 Depreciation -177.49 -150.80 -149.04 -155.00 Exceptional Items 96.43 70.39 -166.94 0.00 Profit Before Tax 919.85 789.94 714.54 562.82 Tax -280.95 -228.01 -212.51 -166.03 Net Profit 638.90 561.93 502.03 396.79 Equity capital 1240.95 1240.95 1240.95 1240.95 Face value 10.00 10.00 10.00 10.00 EPS 5.15 4.53 4.05 3.20
- 7. Ratio Analysis Particulars FY13A FY14A FY15E FY16E EPS (Rs.) 10.97 13.71 16.84 19.37 EBITDA Margin (%) 18.28% 17.95% 17.27% 17.53% PBT Margin (%) 8.87% 9.86% 10.92% 11.56% PAT Margin (%) 6.35% 6.94% 7.68% 8.17% P/E Ratio (x) 25.51 20.41 16.62 14.45 ROE (%) 18.88% 21.55% 20.93% 21.27% ROCE (%) 31.19% 34.77% 33.54% 34.49% Debt Equity Ratio 0.99 0.83 0.61 0.51 EV/EBITDA (x) 8.86 7.89 7.39 6.74 Book Value (Rs.) 58.11 63.64 80.48 91.05 P/BV 4.82 4.40 3.48 3.07 Chart
- 8. OUTLOOK AND CONCLUSION At the current market price of Rs. 279.90, the stock P/E ratio is at 16.62 x FY15E and 14.45 x FY16E respectively. Earning per share (EPS) of the company for the earnings for FY15E and FY16E is seen at Rs. 16.84 and Rs. 19.37 respectively. Net Sales and PAT of the company are expected to grow at a CAGR of 11% and 21% over 2013 to 2016E respectively. On the basis of EV/EBITDA, the stock trades at 7.39 x for FY15E and 6.74 x for FY16E. Price to Book Value of the stock is expected to be at 3.48 x and 3.07 x respectively for FY15E and FY16E. We expect that the company surplus scenario is likely to continue for the next three years, will keep its growth story in the coming quarters also. We recommend ‘BUY’ in this particular scrip with a target price of Rs. 319.00 for Medium to Long term investment. INDUSTRY OVERVIEW FIL is India’s largest manufacturer of PVC pipes and fittings. Domestic PVC pipe industry has been growing at a 12% p.a. Government of India has declared rural water management as its focus area. It has set a target of bringing 650 lacs hectares of land under irrigation by 2020. The Twelfth Five Year Plan envisages investment in excess of Rs. 5,00,000 crore for the irrigation sector. Further, an amount of Rs. 2,30,000 crore has been set aside for water management. This will give further boost to the PVC pipes and fittings demand.
- 9. Global scenario The global demand of PVC stands at around 37.5 million tpa. The growth rate for 2012-13 has been around 2%. As against this, the Indian market for PVC resin has grown by almost 12% during 2012-13. The demand supply gap which currently stands at around 1 million tpa is expected to grow over the years. Globally, the application of PVC in pipes and fittings accounts for almost 43% of the total consumption. In India, the application of PVC in pipes and fittings is almost 70% of the total consumption. Disclaimer: This document prepared by our research analysts does not constitute an offer or solicitation for the purchase or sale of any financial instrument or as an official confirmation of any transaction. The information contained herein is from publicly available data or other sources believed to be reliable but do not represent that it is accurate or complete and it should not be relied on as such. Firstcall India Equity Advisors Pvt. Ltd. or any of it’s affiliates shall not be in any way responsible for any loss or damage that may arise to any person from any inadvertent error in the information contained in this report. This document is provide for assistance only and is not intended to be and must not alone be taken as the basis for an investment decision.
- 10. Firstcall India Equity Research: Email – info@firstcallindia.com C.V.S.L.Kameswari Pharma U. Janaki Rao Capital Goods B. Anil Kumar Auto, IT & FMCG M. Vinayak Rao Diversified C. Bhagya Lakshmi Diversified B. Vasanthi Diversified Firstcall India also provides Firstcall India Equity Advisors Pvt.Ltd focuses on, IPO’s, QIP’s, F.P.O’s,Takeover Offers, Offer for Sale and Buy Back Offerings. Corporate Finance Offerings include Foreign Currency Loan Syndications, Placement of Equity / Debt with multilateral organizations, Short Term Funds Management Debt & Equity, Working Capital Limits, Equity & Debt Syndications and Structured Deals. Corporate Advisory Offerings include Mergers & Acquisitions(domestic and cross-border), divestitures, spin-offs, valuation of business, corporate restructuring-Capital and Debt, Turnkey Corporate Revival – Planning & Execution, Project Financing, Venture capital, Private Equity and Financial Joint Ventures Firstcall India also provides Financial Advisory services with respect to raising of capital through FCCBs, GDRs, ADRs and listing of the same on International Stock Exchanges namely AIMs, Luxembourg, Singapore Stock Exchanges and other international stock exchanges. For Further Details Contact: 3rd Floor,Sankalp,The Bureau,Dr.R.C.Marg,Chembur,Mumbai 400 071 Tel. : 022-2527 2510/2527 6077/25276089 Telefax : 022-25276089 E-mail: info@firstcallindiaequity.com www.firstcallindiaequity.com