QUARTERLY HIGHLIGHTS
•
2 likes•226 views

Gabriel India: Q4FY15 net profit up 55.52% y/y to INR129.55m, Firstcall recommend 'Buy'

Recommended
Recommended
More Related Content
What's hot
What's hot (19)
Similar to QUARTERLY HIGHLIGHTS
Similar to QUARTERLY HIGHLIGHTS (20)
More from IndiaNotes.com
More from IndiaNotes.com (20)
Recently uploaded
Recently uploaded (20)
QUARTERLY HIGHLIGHTS
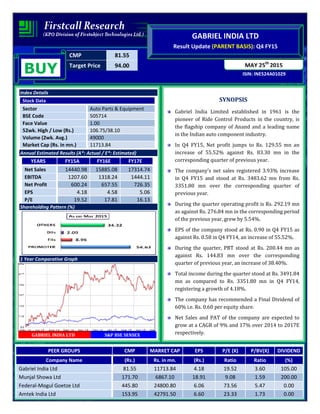
- 1. CMP 81.55 Target Price 94.00 ISIN: INE524A01029 MAY 25th 2015 GABRIEL INDIA LTD Result Update (PARENT BASIS): Q4 FY15 BUY Index Details Stock Data Sector Auto Parts & Equipment BSE Code 505714 Face Value 1.00 52wk. High / Low (Rs.) 106.75/38.10 Volume (2wk. Avg.) 49000 Market Cap (Rs. in mn.) 11713.84 Annual Estimated Results (A*: Actual / E*: Estimated) YEARS FY15A FY16E FY17E Net Sales 14440.98 15885.08 17314.74 EBITDA 1207.60 1318.24 1444.11 Net Profit 600.24 657.55 726.35 EPS 4.18 4.58 5.06 P/E 19.52 17.81 16.13 Shareholding Pattern (%) 1 Year Comparative Graph GABRIEL INDIA LTD S&P BSE SENSEX SYNOPSIS Gabriel India Limited established in 1961 is the pioneer of Ride Control Products in the country, is the flagship company of Anand and a leading name in the Indian auto component industry. In Q4 FY15, Net profit jumps to Rs. 129.55 mn an increase of 55.52% against Rs. 83.30 mn in the corresponding quarter of previous year. The company’s net sales registered 3.93% increase in Q4 FY15 and stood at Rs. 3483.62 mn from Rs. 3351.80 mn over the corresponding quarter of previous year. During the quarter operating profit is Rs. 292.19 mn as against Rs. 276.84 mn in the corresponding period of the previous year, grew by 5.54%. EPS of the company stood at Rs. 0.90 in Q4 FY15 as against Rs. 0.58 in Q4 FY14, an increase of 55.52%. During the quarter, PBT stood at Rs. 200.44 mn as against Rs. 144.83 mn over the corresponding quarter of previous year, an increase of 38.40%. Total income during the quarter stood at Rs. 3491.84 mn as compared to Rs. 3351.80 mn in Q4 FY14, registering a growth of 4.18%. The company has recommended a Final Dividend of 60% i.e. Rs. 0.60 per equity share. Net Sales and PAT of the company are expected to grow at a CAGR of 9% and 17% over 2014 to 2017E respectively. PEER GROUPS CMP MARKET CAP EPS P/E (X) P/BV(X) DIVIDEND Company Name (Rs.) Rs. in mn. (Rs.) Ratio Ratio (%) Gabriel India Ltd 81.55 11713.84 4.18 19.52 3.60 105.00 Munjal Showa Ltd 171.70 6867.10 18.91 9.08 1.59 200.00 Federal-Mogul Goetze Ltd 445.80 24800.80 6.06 73.56 5.47 0.00 Amtek India Ltd 153.95 42791.50 6.60 23.33 1.73 0.00
- 2. QUARTERLY HIGHLIGHTS (PARENT BASIS) Results Updates- Q4 FY15 The company’s net profit jumps to Rs. 129.55 million against Rs. 83.30 million in the corresponding quarter ending of previous year, an increase of 55.52%. Revenue for the quarter rose by 3.93% to Rs. 3483.62 million from Rs. 3351.80 million, when compared with the prior year period. Reported earnings per share of the company stood at Rs. 0.90 a share during the quarter as against Rs. 0.58 over previous year period. Profit before interest, depreciation and tax is Rs. 292.19 million as against Rs. 276.84 million in the corresponding period of the previous year. Break up of Expenditure Months Mar-15 Mar-14 % Change Net Sales 3483.62 3351.80 3.93 PAT 129.55 83.30 55.52 EPS 0.90 0.58 55.52 EBITDA 292.19 276.84 5.54 Break up of Expenditure (Rs in millions) Q4 FY15 Q4 FY14 % CHNG Cost of Materials Consumed 2484.59 2447.86 2% Purchase of Stock in Trade 35.91 12.29 192% Employee Benefits Expense 276.9 225.91 23% Depreciation & Amortization Expense 76.13 70.47 8% Other Expenses 429.72 450.94 -5%
- 3. COMPANY PROFILE Gabriel India was incorporated in 1961, is one of the 19 companies of Anand Group. Gabriel India is a renowned brand synonymous with shock absorbers in India having established a significant presence across all automotive customer segments: the OEMs, replacement market and exports. The company provides the widest range of ride control products in India: shock absorbers, struts and front forks, across every automotive segment with over 300 product models on offer. Over the last fifty years, Gabriel India has earned the reputation of being a provider of innovative and proprietary products and solutions that have become the company’s hallmark. Products • Shock Absorbers • Front Forks • Strut
- 4. FINANCIAL HIGHLIGHT (PARENT BASIS) (A*- Actual, E* -Estimations & Rs. In Millions) Balance Sheet as at March 31, 2014 -2017E FY14A FY15A FY16E FY17E SOURCES OF FUNDS Shareholder's Funds Share Capital 143.67 143.67 143.67 143.67 Reserves and Surplus 2708.05 3110.67 3515.06 3972.01 1. Sub Total - Net worth 2851.72 3254.34 3658.73 4115.68 Non Current Liabilities Long term Borrowings 95.65 58.40 47.89 41.66 Deferred Tax Liabilities 95.51 104.91 117.50 129.25 Long term Provisions 40.90 93.10 107.07 119.91 2. Sub Total - Non Current Liabilities 232.06 256.41 272.45 290.82 Current Liabilities Short term Borrowings 468.46 0.00 0.00 0.00 Trade Payables 1571.66 1907.26 2174.28 2391.70 Other Current Liabilities 429.31 410.68 427.11 448.46 Short Term Provisions 307.77 335.14 358.60 376.53 3. Sub Total - Current Liabilities 2777.20 2653.08 2959.98 3216.70 Total Liabilities (1+2+3) 5860.98 6163.83 6891.16 7623.21 APPLICATION OF FUNDS Non-Current Assets a) Fixed Assets 2796.53 2707.61 2837.74 3020.96 b) Non-current investments 0.23 0.23 0.25 0.27 c) Long Term loans and advances 233.39 226.39 235.45 247.22 d)Other current assets 1.64 24.00 27.84 30.07 1. Sub Total - Non Current Assets 3031.79 2958.23 3101.28 3298.51 Current Assets Inventories 1168.19 1121.40 1211.11 1295.89 Trade receivables 1360.80 1723.35 2154.19 2541.94 Cash and Bank Balances 47.12 38.85 44.68 50.04 Short-terms loans & advances 252.92 320.95 378.72 435.53 Other current assets 0.16 1.05 1.19 1.29 2. Sub Total - Current Assets 2829.19 3205.60 3789.88 4324.69 Total Assets (1+2) 5860.98 6163.83 6891.16 7623.21
- 5. Annual Profit & Loss Statement for the period of 2014 to 2017E Value(Rs.in.mn) FY14A FY15A FY16E FY17E Description 12m 12m 12m 12m Net Sales 12866.08 14440.98 15885.08 17314.74 Other Income 56.33 43.12 47.43 50.28 Total Income 12922.41 14484.10 15932.51 17365.01 Expenditure -11962.14 -13276.50 -14614.27 -15920.90 Operating Profit 960.27 1207.60 1318.24 1444.11 Interest -89.96 -54.80 -46.03 -43.27 Gross profit 870.31 1152.80 1272.21 1400.84 Depreciation -270.73 -311.32 -348.68 -383.55 Exceptional Items -42.00 -6.00 0.00 0.00 Profit Before Tax 557.58 835.48 923.53 1017.30 Tax -131.59 -235.24 -265.98 -290.95 Net Profit 425.99 600.24 657.55 726.35 Equity capital 143.64 143.64 143.64 143.64 Reserves 2708.05 3110.67 3515.06 3972.01 Face value 1.00 1.00 1.00 1.00 EPS 2.97 4.18 4.58 5.06 Quarterly Profit & Loss Statement for the period of 30th Sep, 2014 to 30th June, 2015E Value(Rs.in.mn) 30-Sep-14 31-Dec-14 31-Mar-15 30-Jun-15E Description 3m 3m 3m 3m Net sales 3845.02 3594.86 3483.62 3657.80 Other income 21.31 10.63 8.22 8.88 Total Income 3866.33 3605.49 3491.84 3666.68 Expenditure -3535.87 -3306.97 -3199.65 -3372.49 Operating profit 330.46 298.52 292.19 294.19 Interest -7.87 -13.87 -14.12 -12.43 Gross profit 322.59 284.65 278.07 281.76 Depreciation -78.74 -77.57 -76.13 -82.98 Exceptional Items -1.50 -1.50 -1.50 0.00 Profit Before Tax 242.35 205.58 200.44 198.78 Tax -68.06 -46.22 -70.89 -56.85 Net Profit 174.29 159.36 129.55 141.93 Equity capital 143.64 143.64 143.64 143.64 Face value 1.00 1.00 1.00 1.00 EPS 1.21 1.11 0.90 0.99
- 6. Ratio Analysis Particulars FY14A FY15A FY16E FY17E EPS (Rs.) 2.97 4.18 4.58 5.06 EBITDA Margin (%) 7.46 8.36 8.30 8.34 PBT Margin (%) 4.33 5.79 5.81 5.88 PAT Margin (%) 3.31 4.16 4.14 4.19 P/E Ratio (x) 27.50 19.52 17.81 16.13 ROE (%) 14.94 18.44 17.97 17.65 ROCE (%) 36.04 45.85 44.97 43.96 Debt Equity Ratio 0.20 0.02 0.01 0.01 EV/EBITDA (x) 12.74 9.72 8.89 8.11 Book Value (Rs.) 19.85 22.66 25.47 28.65 P/BV 4.11 3.60 3.20 2.85 Charts
- 7. OUTLOOK AND CONCLUSION At the current market price of Rs. 81.55, the stock P/E ratio is at 17.81 x FY16E and 16.13 x FY17E respectively. Earnings per share (EPS) of the company for the earnings for FY16E and FY17E are seen at Rs. 4.58 and Rs. 5.06 respectively. Net Sales and PAT of the company are expected to grow at a CAGR of 9% and 17% over 2014 to 2017E respectively. On the basis of EV/EBITDA, the stock trades at 8.89 x for FY16E and 8.11 x for FY17E. Price to Book Value of the stock is expected to be at 3.20 x and 2.85 x for FY16E and FY17E respectively. We recommend ‘BUY’ in this particular scrip with a target price of Rs. 94.00 for Medium to Long term investment. INDUSTRY OVERVIEW The Indian auto components industry has experienced healthy sequential growth over the last one-and-a-half years. The growth can be attributed to factors such as strong buoyancy in the end-user industry, recovery of the global economy, improved consumer sentiment and return of adequate liquidity in the financial system. The revival of the auto industry was initially driven by the fiscal stimulus programme of the government. The industry currently accounts for almost seven per cent of India’s gross domestic product (GDP) and employs about 19 million people, both directly and indirectly. The ever-increasing development in infrastructure, big
- 8. domestic market, increasing purchasing power and stable government framework have made India a favourable destination for investment, as per the vision of Automotive Mission Plan (AMP) 2006–2016. The Indian auto-components industry can be broadly classified into the organised and unorganised sectors. The organised sector caters to the original equipment manufacturers (OEMs) and consists of high-value precision instruments while the unorganised sector comprises low-valued products and caters mostly to the aftermarket category. The Indian auto component industry is expected to register a turnover of US$ 66 billion by FY 15–16 with the likelihood to touch US$ 115 billion by FY 20–21 depending on favourable conditions, as per the estimates by Automotive Component Manufacturers Association of India (ACMA). In addition, industry exports are projected to reach US$ 12 billion by FY 15–16 and add up to US$ 30 billion by FY 20–21. Outlook The rapidly globalising world is opening new avenues for the transportation industry, generating the need for more efficient, safe and reliable modes of transportation, which is subsequently adding to the auto component industry’s growing opportunities. According to a report by the Confederation of Indian Industry (CII), the Indian auto component industry is set to become the third largest in the world by 2025. Also, by that time, newer verticals and opportunities for component manufacturers will open up as the automobile market will shift towards electric, electronic and hybrid cars, and newer technologies will have to be adopted via systematic research and development. Indian auto component makers are well positioned to benefit from the globalisation of the sector as exports potential could be increased by up to four times to US$ 40 billion by 2020. Disclaimer: This document is prepared by our research analysts and it does not constitute an offer or solicitation for the purchase or sale of any financial instrument or as an official confirmation of any transaction. The information contained herein is from publicly available data or other sources believed to be reliable but we do not represent that it is accurate or complete and it should not be relied on as such. Firstcall Research or any of its affiliates shall not be in any way responsible for any loss or damage that may arise to any person from any inadvertent error in the information contained in this report. Firstcall Research and/ or its affiliates and/or employees will not be liable for the recipients’ investment decision based on this document.
- 9. Firstcall India Equity Research: Email – info@firstobjectindia.com C.V.S.L.Kameswari Pharma & Diversified U. Janaki Rao Capital Goods B. Anil Kumar Auto, IT & FMCG M. Vinayak Rao Diversified G. Amarender Diversified Firstcall Research Provides Industry Research on all the Sectors and Equity Research on Major Companies forming part of Listed and Unlisted Segments For Further Details Contact: Tel.: 022-2527 2510/2527 6077 / 25276089 Telefax: 022-25276089 040-20000235 /20000233 E-mail: info@firstobjectindia.com www.firstcallresearch.com