Cera Sanitaryware Q1FY15: Achieves a sharp 28% growth in top-line, buy
•
1 like•350 views

Cera Sanitaryware Ltd reported a 22% increase in net profit and 28% growth in revenue in the first quarter of FY2015 compared to the same period of the previous year. Net profit for Q1 FY2015 was Rs. 136.32 million, up from Rs. 111.82 million in Q1 FY2014. Revenue for Q1 FY2015 grew by 28.24% to Rs. 1623.33 million. Earnings per share grew by 21.91% to Rs. 10.77. The company is expected to see continued revenue and profit growth over the next two years supported by growth in the housing sector and increasing disposable incomes in India. The report recommends buying shares of C

Recommended
Recommended
More Related Content
What's hot
What's hot (20)
Viewers also liked
Viewers also liked (8)
Similar to Cera Sanitaryware Q1FY15: Achieves a sharp 28% growth in top-line, buy
Similar to Cera Sanitaryware Q1FY15: Achieves a sharp 28% growth in top-line, buy (20)
More from IndiaNotes.com
More from IndiaNotes.com (20)
Recently uploaded
Recently uploaded (20)
Cera Sanitaryware Q1FY15: Achieves a sharp 28% growth in top-line, buy
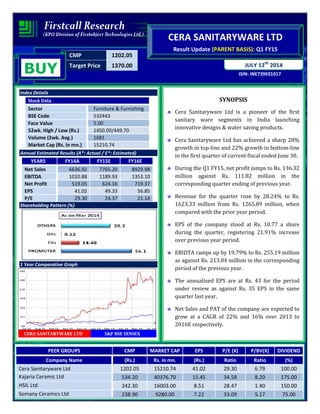
- 1. CMP 1202.05 Target Price 1370.00 ISIN: INE739E01017 JULY 12th 2014 CERA SANITARYWARE LTD Result Update (PARENT BASIS): Q1 FY15 BUY Index Details Stock Data Sector Furniture & Furnishing BSE Code 532443 Face Value 5.00 52wk. High / Low (Rs.) 1450.00/449.70 Volume (2wk. Avg.) 1681 Market Cap (Rs. in mn.) 15210.74 Annual Estimated Results (A*: Actual / E*: Estimated) YEARS FY14A FY15E FY16E Net Sales 6636.92 7765.20 8929.98 EBITDA 1010.88 1189.93 1353.10 Net Profit 519.05 624.16 719.37 EPS 41.02 49.33 56.85 P/E 29.30 24.37 21.14 Shareholding Pattern (%) 1 Year Comparative Graph CERA SANITARYWARE LTD S&P BSE SENSEX SYNOPSIS Cera Sanitaryware Ltd is a pioneer of the first sanitary ware segments in India launching innovative designs & water saving products. Cera Sanitaryware Ltd has achieved a sharp 28% growth in top-line and 22% growth in bottom-line in the first quarter of current fiscal ended June 30. During the Q1 FY15, net profit jumps to Rs. 136.32 million against Rs. 111.82 million in the corresponding quarter ending of previous year. Revenue for the quarter rose by 28.24% to Rs. 1623.33 million from Rs. 1265.89 million, when compared with the prior year period. EPS of the company stood at Rs. 10.77 a share during the quarter, registering 21.91% increase over previous year period. EBIDTA ramps up by 19.79% to Rs. 255.19 million as against Rs. 213.04 million in the corresponding period of the previous year. The annualized EPS are at Rs. 43 for the period under review as against Rs. 35 EPS in the same quarter last year. Net Sales and PAT of the company are expected to grow at a CAGR of 22% and 16% over 2013 to 2016E respectively. PEER GROUPS CMP MARKET CAP EPS P/E (X) P/BV(X) DIVIDEND Company Name (Rs.) Rs. in mn. (Rs.) Ratio Ratio (%) Cera Sanitaryware Ltd 1202.05 15210.74 41.02 29.30 6.79 100.00 Kajaria Ceramic Ltd 534.20 40376.70 15.45 34.58 8.20 175.00 HSIL Ltd 242.30 16003.00 8.51 28.47 1.40 150.00 Somany Ceramics Ltd 238.90 9280.00 7.22 33.09 5.17 75.00
- 2. QUARTERLY HIGHLIGHTS (PARENT BASIS) Results Updates- Q1 FY15, Months Jun-14 Jun-13 % Change Net Sales 1623.33 1265.89 28.24 PAT 136.32 111.82 21.91 EPS 10.77 8.84 21.91 EBITDA 255.19 213.04 19.79 The company’s net profit jumps to Rs. 136.32 million against Rs. 111.82 million in the corresponding quarter ending of previous year, an increase of 21.91%. Revenue for the quarter rose by 28.24% to Rs. 1623.33 million from Rs. 1265.89 million, when compared with the prior year period. Reported earnings per share of the company stood at Rs. 10.77 a share during the quarter, registering 21.91% increase over previous year period. Profit before interest, depreciation and tax is Rs. 255.19 million as against Rs. 213.04 million in the corresponding period of the previous year. Break up of Expenditure Break up of Expenditure Rs. in Mn Q1 FY15 Q1 FY14 % Change Cost of Material Consumed 168.50 138.78 21% Purchase of Stock in Trade 611.05 423.88 44% Employee Benefit Expenses 227.92 166.49 37% Depreciation & Amortization Expense 33.48 28.10 19% Power & Fuel 71.00 57.76 23% Other Expenses 403.81 292.34 38%
- 3. COMPANY PROFILE Cera Sanitaryware Ltd was launched in the year 1980 is a pioneer in the sanitary ware segment in India. The first sanitary ware company to use natural gas, Cera has been on the forefront of launching a versatile color range and introducing the bath suite concept. It also launched innovative designs and water-saving products. The twin- flush model launched in India by Cera for the first time, reduces the water needs of households considerably. WCs designed to flush in just 4 liters of water is another notable innovation by Cera. Cera Sanitaryware incorporated in the year 1998 is a pioneer in the sanitary ware segment in India. The company has launched a wide range of bath suite concept. Cera Sanitaryware sells its products through Cera Bath Studios, which provides consumers, architects and interior designers a full view of ranges of wash basins, shower panels, shower cubicles, bath tubs, shower temples, whirlpools, cp fittings etc. Cera Bath Studios has pan- India presence, are located at Ahmedabad, Bangalore, Chandigarh, Kolkata, Cochin and Hyderabad, Mumbai. Manufacturing Unit Cera Sanitaryware manufacturing facilities are located at Kadi, Gujarat. Products The company has providing the following products for various purposes. • Sanitary ware • Faucets • Wellness • Kitchen Sinks • Mirrors • Personal Care • Green Products The achieving the growth in the rapidly changing retail market in the country, Cera, has launched its one of a kind Cera Bath Studios in Ahmadabad, Bangalore, Chandigarh, Kolkata, Cochin and Hyderabad, Mumbai. With the opening of the Cera Bath Studios, the discerning consumers, architects and interior designers can have full view of the Cera’s premium ranges of WC’s, Wash Basins, Shower Panels, Shower Cubicles, Bath Tubs, Shower Temples, Whirlpools, CP fittings etc. Cera Bath Studios will complement its existing network of 1400 dealers and 14000 retailers. Several Bathrooms are displayed live, so that the customers can get a feel of Cera’s vast range of products.
- 4. FINANCIAL HIGHLIGHT (PARENT BASIS) (A*- Actual, E* -Estimations & Rs. In Millions) Balance Sheet as at March 31, 2013 -2016E FY13A FY14A FY15E FY16E SOURCES OF FUNDS Shareholder's Funds Share Capital 63.27 63.27 63.27 63.27 Reserves and Surplus 1731.76 2176.40 2800.56 3519.93 1. Sub Total - Net worth 1795.03 2239.67 2863.83 3583.20 Non Current Liabilities Long term Borrowings 148.92 90.00 76.50 67.32 Deferred Tax Liabilities 162.18 201.98 230.26 253.28 Other Long term Liabilities 70.65 79.11 85.44 89.71 Long term Provisions 197.48 274.75 321.46 356.82 2. Sub Total - Non Current Liabilities 579.23 645.84 713.65 767.13 Current Liabilities Short term Borrowings 400.49 333.61 290.24 261.22 Trade Payables 276.10 376.88 425.87 459.94 Other Current Liabilities 610.75 760.73 852.02 911.66 Short Term Provisions 135.01 175.34 198.13 213.98 3. Sub Total - Current Liabilities 1422.35 1646.56 1766.27 1846.80 Total Liabilities (1+2+3) 3796.61 4532.07 5343.75 6197.14 APPLICATION OF FUNDS Non-Current Assets Fixed Assets Tangible assets 1250.52 1517.03 1774.93 2041.16 Capital Work in Progress 43.33 52.03 59.31 65.84 a) Sub Total - Fixed Assets 1293.85 1569.06 1834.24 2107.00 b) Non-current investments 0.01 0.01 0.54 0.60 c) Long Term loans and advances 213.48 283.03 367.94 456.24 1. Sub Total - Non Current Assets 1507.34 1852.10 2202.72 2563.85 Current Assets Current Investment 13.81 121.30 143.13 166.04 Inventories 940.24 1045.76 1150.34 1265.37 Trade receivables 831.30 1066.22 1316.32 1589.52 Cash and Bank Balances 403.54 307.10 353.17 399.08 Short-terms loans & advances 93.62 134.60 172.29 206.75 Other current assets 6.76 4.99 5.79 6.54 2. Sub Total - Current Assets 2289.27 2679.97 3141.03 3633.29 Total Assets (1+2) 3796.61 4532.07 5343.75 6197.14
- 5. Annual Profit & Loss Statement for the period of 2013 to 2016E Value(Rs.in.mn) FY13A FY14A FY15E FY16E Description 15m 12m 12m 12m Net Sales 4878.67 6636.92 7765.20 8929.98 Other Income 89.94 61.52 63.98 67.18 Total Income 4968.61 6698.44 7829.18 8997.16 Expenditure -4125.36 -5687.56 -6639.24 -7644.06 Operating Profit 843.25 1010.88 1189.93 1353.10 Interest -70.92 -64.42 -62.49 -59.36 Gross profit 772.33 946.46 1127.45 1293.73 Depreciation -94.22 -122.47 -144.51 -166.19 Profit Before Tax 678.11 823.99 982.93 1127.54 Tax -216.04 -304.94 -358.77 -408.17 Net Profit 462.07 519.05 624.16 719.37 Equity capital 63.27 63.27 63.27 63.27 Reserves 1731.76 2176.40 2800.56 3519.93 Face value 5.00 5.00 5.00 5.00 EPS 36.52 41.02 49.33 56.85 Quarterly Profit & Loss Statement for the period of 31st Dec, 2013 to 30th Sep, 2014E Value(Rs.in.mn) 31-Dec-13 31-Mar-14 30-Jun-14 30-Sep-14E Description 3m 3m 3m 3m Net sales 1601.47 2181.94 1623.33 1883.06 Other income 11.54 19.25 13.76 14.59 Total Income 1613.01 2201.19 1637.09 1897.65 Expenditure -1395.45 -1830.24 -1381.90 -1619.43 Operating profit 217.56 370.95 255.19 278.21 Interest -17.13 -16.88 -13.92 -15.03 Gross profit 200.43 354.07 241.27 263.18 Depreciation -34.51 -28.92 -33.47 -36.48 Profit Before Tax 165.92 325.15 207.80 226.70 Tax -58.30 -131.76 -71.48 -81.84 Net Profit 107.62 193.39 136.32 144.86 Equity capital 63.27 63.27 63.27 63.27 Face value 5.00 5.00 5.00 5.00 EPS 8.50 15.28 10.77 11.45
- 6. Ratio Analysis Particulars FY13A FY14A FY15E FY16E EPS (Rs.) 36.52 41.02 49.33 56.85 EBITDA Margin (%) 17.28% 15.23% 15.32% 15.15% PBT Margin (%) 13.90% 12.42% 12.66% 12.63% PAT Margin (%) 9.47% 7.82% 8.04% 8.06% P/E Ratio (x) 32.92 29.30 24.37 21.14 ROE (%) 25.74% 23.18% 21.79% 20.08% ROCE (%) 39.99% 42.55% 41.31% 38.84% Debt Equity Ratio 0.31 0.19 0.13 0.09 EV/EBITDA (x) 18.19 15.04 12.67 11.07 Book Value (Rs.) 141.85 176.99 226.32 283.17 P/BV 8.47 6.79 5.31 4.25 Charts
- 7. OUTLOOK AND CONCLUSION At the current market price of Rs.1202.05, the stock P/E ratio is at 24.37 x FY15E and 21.14 x FY16E respectively. Earning per share (EPS) of the company for the earnings for FY15E and FY16E is seen at Rs.49.33 and Rs.56.85 respectively. Net Sales and PAT of the company are expected to grow at a CAGR of 22% and 16% over 2013 to 2016E respectively. On the basis of EV/EBITDA, the stock trades at 12.67 x for FY15E and 11.07 x for FY16E. Price to Book Value of the stock is expected to be at 5.31 x and 4.25 x respectively for FY15E and FY16E. We recommend ‘BUY’ in this particular scrip with a target price of Rs.1370.00 for Medium to Long term investment.
- 8. INDUSTRY OVERVIEW The Ceramic Tile Market in India is showing remarkable growth owing to the booming real estate sector along with the rising disposable income of the consumers. Consumers are becoming style conscious and this aesthetic sense of the consumers is leading to its increased consumption. Moreover, the user industries of ceramic tiles are also growing steadily due to its price competitiveness compared to marble leading to its increased demand from these sectors. The Indian home and furnishing market is pegged at about $20 billion (Rs 1.2 lakh crore), of which the furniture segment accounts for about half. As about 90 per cent of the market is unorganised, it is an attractive avenue for online players. Also, margins stand at 10-25 per cent, making it competitive and on a par with the apparel space, say industry insiders. In relatively developed markets such as China and Brazil, the share of the home-and-furniture category in the overall e-commerce space is estimated at 15-20 per cent, encouraging numbers for Indian e-tailers. Outlook The spread of roads, telephones and electricity is helping urban centres expand. As wage growth remains strong, ‘new urban’ consumption goods like tiles are expected to report robust demand. Despite a robust growth by the organized tiles sector over the past years, per capita consumption of ceramic tiles in India is only a seventh of Brazil’s, a sixth of China’s and a third of Indonesia’s. About 80-85% of tile demand is driven by new housing or first-time users, while the balance is derived from replacement. Interestingly, new housing demand is expected to emerge from non-metro locations (smaller urban centres, Tier-II and III towns) while replacement demand is expected to be largely a metro phenomenon. Disclaimer: This document prepared by our research analysts does not constitute an offer or solicitation for the purchase or sale of any financial instrument or as an official confirmation of any transaction. The information contained herein is from publicly available data or other sources believed to be reliable but do not represent that it is accurate or complete and it should not be relied on as such. Firstcall India Equity Advisors Pvt. Ltd. or any of it’s affiliates shall not be in any way responsible for any loss or damage that may arise to any person from any inadvertent error in the information contained in this report. This document is provide for assistance only and is not intended to be and must not alone be taken as the basis for an investment decision.
- 9. Firstcall India Equity Research: Email – info@firstcallindia.com C.V.S.L.Kameswari Pharma U. Janaki Rao Capital Goods B. Anil Kumar Auto, IT & FMCG M. Vinayak Rao Diversified C. Bhagya Lakshmi Diversified B. Vasanthi Diversified Firstcall India also provides Firstcall India Equity Advisors Pvt.Ltd focuses on, IPO’s, QIP’s, F.P.O’s,Takeover Offers, Offer for Sale and Buy Back Offerings. Corporate Finance Offerings include Foreign Currency Loan Syndications, Placement of Equity / Debt with multilateral organizations, Short Term Funds Management Debt & Equity, Working Capital Limits, Equity & Debt Syndications and Structured Deals. Corporate Advisory Offerings include Mergers & Acquisitions(domestic and cross-border), divestitures, spin-offs, valuation of business, corporate restructuring-Capital and Debt, Turnkey Corporate Revival – Planning & Execution, Project Financing, Venture capital, Private Equity and Financial Joint Ventures Firstcall India also provides Financial Advisory services with respect to raising of capital through FCCBs, GDRs, ADRs and listing of the same on International Stock Exchanges namely AIMs, Luxembourg, Singapore Stock Exchanges and other international stock exchanges. For Further Details Contact: 3rd Floor,Sankalp,The Bureau,Dr.R.C.Marg,Chembur,Mumbai 400 071 Tel. : 022-2527 2510/2527 6077/25276089 Telefax : 022-25276089 E-mail: info@firstcallindiaequity.com www.firstcallindiaequity.com