Astec Lifesciences: Q4FY15 net sales up 97.15% y/y; Firstcall recommend 'Buy'
•
1 like•412 views

Astec Lifesciences: Q4FY15 net profit up 100.99% y/y to INR32.46m, Firstcall recommend 'Buy'

Recommended
Recommended
More Related Content
What's hot
What's hot (20)
Viewers also liked
Viewers also liked (13)
Similar to Astec Lifesciences: Q4FY15 net sales up 97.15% y/y; Firstcall recommend 'Buy'
Similar to Astec Lifesciences: Q4FY15 net sales up 97.15% y/y; Firstcall recommend 'Buy' (20)
More from IndiaNotes.com
More from IndiaNotes.com (20)
Recently uploaded
Recently uploaded (20)
Astec Lifesciences: Q4FY15 net sales up 97.15% y/y; Firstcall recommend 'Buy'
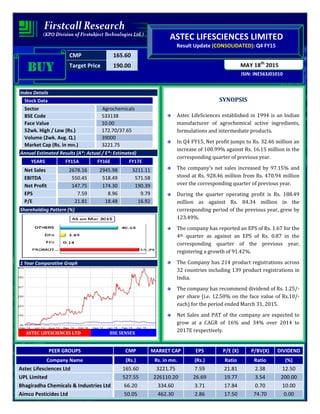
- 1. CMP 165.60 Target Price 190.00 ISIN: INE563J01010 MAY 18th 2015 ASTEC LIFESCIENCES LIMITED Result Update (CONSOLIDATED): Q4 FY15 BUYBUYBUYBUY Index Details Stock Data Sector Agrochemicals BSE Code 533138 Face Value 10.00 52wk. High / Low (Rs.) 172.70/37.65 Volume (2wk. Avg. Q.) 39000 Market Cap (Rs. in mn.) 3221.75 Annual Estimated Results (A*: Actual / E*: Estimated) YEARS FY15A FY16E FY17E Net Sales 2678.16 2945.98 3211.11 EBITDA 550.45 518.49 571.58 Net Profit 147.75 174.30 190.39 EPS 7.59 8.96 9.79 P/E 21.81 18.48 16.92 Shareholding Pattern (%) 1 Year Comparative Graph ASTEC LIFESCIENCES LTD BSE SENSEX SYNOPSIS Astec LifeSciences established in 1994 is an Indian manufacturer of agrochemical active ingredients, formulations and intermediate products. In Q4 FY15, Net profit jumps to Rs. 32.46 million an increase of 100.99% against Rs. 16.15 million in the corresponding quarter of previous year. The company’s net sales increased by 97.15% and stood at Rs. 928.46 million from Rs. 470.94 million over the corresponding quarter of previous year. During the quarter operating profit is Rs. 188.49 million as against Rs. 84.34 million in the corresponding period of the previous year, grew by 123.49%. The company has reported an EPS of Rs. 1.67 for the 4th quarter as against an EPS of Rs. 0.87 in the corresponding quarter of the previous year, registering a growth of 91.42%. The Company has 214 product registrations across 32 countries including 139 product registrations in India. The company has recommend dividend of Rs. 1.25/- per share (i.e. 12.50% on the face value of Rs.10/- each) for the period ended March 31, 2015. Net Sales and PAT of the company are expected to grow at a CAGR of 16% and 34% over 2014 to 2017E respectively. PEER GROUPS CMP MARKET CAP EPS P/E (X) P/BV(X) DIVIDEND Company Name (Rs.) Rs. in mn. (Rs.) Ratio Ratio (%) Astec Lifesciences Ltd 165.60 3221.75 7.59 21.81 2.38 12.50 UPL Limited 527.55 226110.20 26.69 19.77 3.54 200.00 Bhagiradha Chemicals & Industries Ltd 66.20 334.60 3.71 17.84 0.70 10.00 Aimco Pesticides Ltd 50.05 462.30 2.86 17.50 74.70 0.00
- 2. QUARTERLY HIGHLIGHTS (CONSOLIDATED) Results updates- Q4 FY15, Astec LifeSciences Ltd is an Indian manufacturer of agrochemical active ingredients, formulations and intermediate products has reported its financial results for the quarter ended 31st March, 2015. Rs. In million Mar-15 Mar-14 % Change Net Sales 928.46 470.94 97.15 PAT 32.46 16.15 100.99 EPS 1.67 0.87 91.42 EBITDA 188.49 84.34 123.49 The company has achieved a turnover of Rs. 928.46 million for the 4th quarter of the current year 2014-15 as against Rs. 470.94 million in the corresponding quarter of the previous year. EBITDA of Rs. 188.49 million in Q4 FY15 and increase of 123.49% against the corresponding period of last year. In Q4 FY15, net profit of Rs. 32.46 million against Rs. 16.15 million in the corresponding quarter of the previous year. The company has reported an EPS of Rs. 1.67 for the 4th quarter as against an EPS of Rs. 0.87 in the corresponding quarter of the previous year. Break up of Expenditure Latest Updates • The company has recommend dividend of Rs. 1.25/- per share (i.e. 12.50% on the face value of Rs.10/- each) for the period ended March 31, 2015. Break up of Expenditure (Rs. In millions) Q4 FY15 Q4 FY14 % Change Cost of Materials Consumed Including Utilities 567.17 286.08 98% Employee benefits expenses 35.12 31.2 13% Depreciation and amortization expenses 10.32 37.54 -73% Other expenditure 60.84 45.96 32%
- 3. COMPANY PROFILE Astec is a producer of agrochemicals and pharmaceutical intermediates. It was established in 1994 with a focus on the Agrochemical and Pharmaceutical industries. Today, Astec manufactures a wide range of Agrochemical active ingredients and pharmaceutical intermediates. Astec's considerable experience in the development and production of intermediates and active ingredients makes it an ideal partner. Astec has forged enduring relationships with large and small companies all over the world. Astec has an unshakeable reputation for providing quality products in manufacturing plants that meet global standards. Astec is proud of its rich experience of over two decades in the chemical industry. Astec employs highly qualified and trained personnel to monitor and maintain its manufacturing activities as well as process development work. The company prides itself in being responsive, reliable and quick to implement projects. At the same time company ensure high levels of confidentiality in implementing new projects thereby providing an excellent customized manufacturing service option to our clients at extremely competitive costs. Astec is a leader in Triazole fungicides and has a portfolio of fungicide and herbicide technical products for Indian and global markets. The Company has 214 product registrations across 32 countries including 139 product registrations in India. Astec also offers contract manufacturing services and has longstanding preferred partner relationships with global customers. Through its 100% subsidiary Astec Crop Care Pvt. Ltd, the Company markets and distributes branded agrochemical formulations in India. The Company has 2 multiproduct plants in Mahad, Maharashtra and an R&D site, manufacturing and pilot plant in Dombivli near Mumbai. The sites are certified to ISO 9001 (Quality), ISO 14001(Environment) and OHSAS 18001 (Safety) standards. The Company is a signatory to the International Council of Chemical Association’s Responsible Care Initiative for standards in Quality, Safety and Environment parameters. Astec’s well equipped R&D facility has a team of scientists and chemists focused on product development and process optimization. Products • Tebuconazole • Propiconazole • Hexaconazole • Difenoconazole • Epoxiconazole • Cyproconazole • Flutriafol • Tricyclazole • Metalaxyl • Lambda Cyhalothrin Intermediates • 2’,4’-Dichloroacetophenone • 2-Chloro-4’-fluoro acetophenone • 4-Methyl phthalic anhydride • Thio bis-4-chloro thymol
- 4. FINANCIAL HIGHLIGHT (CONSOLIDATED) (A*- Actual, E* -Estimations & Rs. In Millions) Balance Sheet as at March 31, 2014 -2017E FY14A FY15A FY16E FY17E I. EQUITY AND LIABILITIES: A. Shareholders’ Funds a) Share Capital 185.29 194.55 194.55 194.55 b) Reserves and Surplus 949.62 1158.81 1333.11 1523.51 Sub-Total-Net worth 1134.91 1353.36 1527.66 1718.06 B. Minority Interest 0.44 0.51 0.56 0.59 C. Non-Current Liabilities: a) Long-term borrowings 189.76 132.20 113.69 96.64 b) Deferred Tax Liabilities [Net] 41.33 52.10 59.39 65.33 c) Other Long Term Liabilities 307.29 297.68 309.59 325.07 d) Long Term Provisions 12.43 7.41 7.63 7.78 Sub-Total-Long term liabilities 550.81 489.39 490.31 494.82 D. Current Liabilities: a) Short-term borrowings 575.85 773.85 889.93 996.72 b) Trade Payables 456.47 838.34 964.09 1108.70 c) Other Current Liabilities 87.24 128.40 159.22 184.69 d) Short Term Provisions 43.72 47.17 50.00 52.00 Sub-Total-Current Liabilities 1163.28 1787.76 2063.23 2342.11 TOTAL-EQUITY AND LIABILITIES (A+B+C+D) 2849.44 3631.02 4081.76 4555.58 II. ASSETS: E. Non-Current Assets: Fixed Assets i. Tangible Assets/Intangible assets 1322.32 1330.64 1410.48 1495.11 ii. Capital Work-in-progress 58.37 122.47 139.62 154.97 a) Sub-Total-Fixed Assets 1380.69 1453.11 1550.09 1650.08 b) Non Current Investments 0.15 0.24 0.31 0.36 c) Deferred tax assets 4.80 0.00 0.00 0.00 d) Long Term Loans and Advances 114.83 193.30 222.30 251.19 Sub-Total-Non-Current Assets 1500.47 1646.65 1772.70 1901.63 F. Current Assets: a) Current Investments 0.68 0.92 1.15 1.33 b) Inventories 765.88 719.29 748.06 785.46 c) Trade Receivables 513.94 1048.31 1289.80 1545.46 d) Cash and Bank Balances 44.72 120.20 151.45 181.74 e) Short Term Loans and Advances 23.75 95.65 118.61 139.96 Sub-Total-Current Assets 1348.97 1984.37 2309.07 2653.95 TOTAL-ASSETS (E+F) 2849.44 3631.02 4081.76 4555.58
- 5. Annual Profit & Loss Statement for the period of 2014 to 2017E Value(Rs.in.mn) FY14A FY15A FY16E FY17E Description 12m 12m 12m 12m Net Sales 2073.38 2678.16 2945.98 3211.11 Other Income 0.00 0.00 0.00 0.00 Total Income 2073.38 2678.16 2945.98 3211.11 Expenditure -1692.77 -2127.71 -2427.48 -2639.54 Operating Profit 380.61 550.45 518.49 571.58 Interest -115.69 -128.40 -145.09 -162.50 Gross profit 264.92 422.05 373.40 409.08 Depreciation -147.67 -126.87 -134.48 -143.90 Exceptional items 0.00 -169.38 0.00 0.00 Profit Before Tax 117.25 125.80 238.92 265.18 Tax -24.98 -41.94 -63.07 -72.66 Profit after tax 92.27 83.86 175.84 192.52 Extraordinary items -5.75 63.96 -1.54 -2.13 Minority Interest 0.24 -0.07 0.00 0.00 Net Profit 86.76 147.75 174.30 190.39 Equity capital 185.29 194.55 194.55 194.55 Reserves 949.62 1158.81 1333.11 1523.51 Face value 10.00 10.00 10.00 10.00 EPS 4.68 7.59 8.96 9.79 Quarterly Profit & Loss Statement for the period of 30 Sep, 2014 to 30 Jun, 2015E Value(Rs.in.mn) 30-Sep-14 31-Dec-14 31-Mar-15 30-Jun-15E Description 3m 3m 3m 3m Net sales 656.70 574.10 928.46 668.49 Other income 0.00 0.00 0.00 0.00 Total Income 656.70 574.10 928.46 668.49 Expenditure -504.48 -452.63 -739.97 -551.51 Operating profit 152.22 121.47 188.49 116.99 Interest -33.53 -36.15 -32.15 -36.01 Gross profit 118.69 85.32 156.34 80.98 Depreciation -39.17 -39.41 -10.32 -13.62 Exceptional Items 0.00 0.00 -169.38 0.00 Profit Before Tax 79.52 45.91 -23.36 67.36 Tax -16.19 -10.49 -8.14 -17.38 Profit after Tax 63.33 35.42 -31.50 49.98 Extraordinary Items -1.96 0.51 63.96 -0.17 Minority interest -0.02 -0.03 0.00 0.00 Net Profit 61.35 35.90 32.46 49.81 Equity capital 185.29 185.29 194.55 194.55 Face value 10.00 10.00 10.00 10.00 EPS 3.31 1.94 1.67 2.56
- 6. Ratio Analysis Particulars FY14A FY15A FY16E FY17E EPS (Rs.) 4.68 7.59 8.96 9.79 EBITDA Margin (%) 18.36 20.55 17.60 17.80 PBT Margin (%) 5.66 4.70 8.11 8.26 PAT Margin (%) 4.45 3.13 5.97 6.00 P/E Ratio (x) 35.37 21.81 18.48 16.92 ROE (%) 8.13 6.20 11.51 11.21 ROCE (%) 27.80 29.98 25.80 25.45 Debt Equity Ratio 0.67 0.67 0.66 0.64 EV/EBITDA (x) 9.95 7.28 7.86 7.23 Book Value (Rs.) 61.25 69.56 78.52 88.31 P/BV 2.70 2.38 2.11 1.88 Charts
- 7. OUTLOOK AND CONCLUSION At the current market price of Rs. 165.60, the stock P/E ratio is at 18.48 x FY16E and 16.92 x FY17E respectively. Earning per share (EPS) of the company for the earnings for FY16E and FY17E is seen at Rs.8.96 and Rs.9.79 respectively. Net Sales and PAT of the company are expected to grow at a CAGR of 16% and 34% over 2014 to 2017E respectively. On the basis of EV/EBITDA, the stock trades at 7.86 x for FY16E and 7.23 x for FY17E. Price to Book Value of the stock is expected to be at 2.11 x and 1.88 x for FY16E and FY17E respectively. We recommend ‘BUY’ in this particular scrip with a target price of Rs.190.00 for Medium to Long term investment. INDUSTRY OVERVIEW Agriculture plays a vital role in the Indian economy. Over 70 per cent of the rural households depend on agriculture as their principal means of livelihood. Agriculture, along with fisheries and forestry, accounts for one- third of the nation’s GDP and is its single largest contributor. The total Share of Agriculture & Allied Sectors (Including agriculture, livestock, forestry and fishery sub sectors) in terms of percentage of GDP is 13.9 percent during 2013-14 at 2004-05 prices. [As per the estimates released by Central Statistics Office] Agricultural exports constitute a fifth of the total exports of the country. In view of the predominant position of the Agricultural Sector, collection and maintenance of Agricultural Statistics assume great importance.
- 8. The country is also the largest producer, consumer and exporter of spices and spice products in the world and overall in farm and agriculture outputs, it is ranked second. From canned, dairy, processed, frozen food to fisheries, meat, poultry, and food grains, the Indian agro industry has plenty of areas to choose for business. The Department of Agriculture and Cooperation under the Ministry of Agriculture is the nodal organisation re- sponsible for the development of the agriculture sector in India. Under it, several other bodies such as the National Dairy Development Board (NDDB) work for the development of other allied agricultural sectors. Outlook The Indian agriculture sector is expected to grow with better momentum in the next few years owing to increase in investment in agricultural infrastructure such as irrigation facilities, warehousing and cold storage. Factors such as reduced transaction costs, time, better port gate management and fiscal incentives will also contribute to this upward trend. Furthermore, the increased use of genetically modified crops is also expected to better the yield of the Indian farmers. The 12th Five Year Plan’s estimates of expanding the storage capacity to 35 MT and the target of achieving an overall growth of 4 per cent will also go a long way in modifying the overall face of the Indian agriculture sector in the next few years. Disclaimer: This document is prepared by our research analysts and it does not constitute an offer or solicitation for the purchase or sale of any financial instrument or as an official confirmation of any transaction. The information contained herein is from publicly available data or other sources believed to be reliable but we do not represent that it is accurate or complete and it should not be relied on as such. Firstcall Research or any of its affiliates shall not be in any way responsible for any loss or damage that may arise to any person from any inadvertent error in the information contained in this report. Firstcall Research and/ or its affiliates and/or employees will not be liable for the recipients’ investment decision based on this document.
- 9. Firstcall India Equity Research: Email – info@firstobjectindia.com C.V.S.L.Kameswari Pharma & Diversified U. Janaki Rao Capital Goods B. Anil Kumar Auto, IT & FMCG M. Vinayak Rao Diversified G. Amarender Diversified Firstcall Research Provides Industry Research on all the Sectors and Equity Research on Major Companies forming part of Listed and Unlisted Segments For Further Details Contact: Tel.: 022-2527 2510/2527 6077 / 25276089 Telefax: 022-25276089 040-20000235 /20000233 E-mail: info@firstobjectindia.com www.firstcallresearch.com