Brooks Laboratories FY15: Net profits up 31% y/y; Buy
•
1 like•317 views

Firstcall recommend Brooks Labs for target of 53 after 31% upsurge in FY15 net profits

Recommended
Recommended
More Related Content
What's hot
What's hot (19)
Similar to Brooks Laboratories FY15: Net profits up 31% y/y; Buy
Similar to Brooks Laboratories FY15: Net profits up 31% y/y; Buy (20)
More from IndiaNotes.com
More from IndiaNotes.com (20)
Recently uploaded
Recently uploaded (20)
Brooks Laboratories FY15: Net profits up 31% y/y; Buy
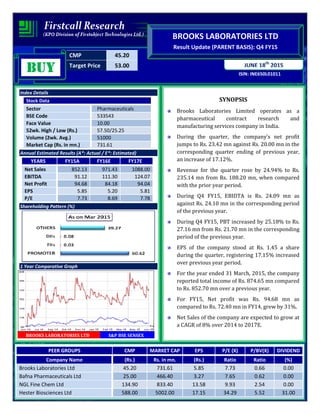
- 1. CMP 45.20 Target Price 53.00 ISIN: INE650L01011 JUNE 18th 2015 BROOKS LABORATORIES LTD Result Update (PARENT BASIS): Q4 FY15 BUYBUYBUYBUY Index Details Stock Data Sector Pharmaceuticals BSE Code 533543 Face Value 10.00 52wk. High / Low (Rs.) 57.50/25.25 Volume (2wk. Avg.) 51000 Market Cap (Rs. in mn.) 731.61 Annual Estimated Results (A*: Actual / E*: Estimated) YEARS FY15A FY16E FY17E Net Sales 852.13 971.43 1088.00 EBITDA 91.12 111.30 124.07 Net Profit 94.68 84.18 94.04 EPS 5.85 5.20 5.81 P/E 7.73 8.69 7.78 Shareholding Pattern (%) 1 Year Comparative Graph BROOKS LABORATORIES LTD S&P BSE SENSEX SYNOPSIS Brooks Laboratories Limited operates as a pharmaceutical contract research and manufacturing services company in India. During the quarter, the company’s net profit jumps to Rs. 23.42 mn against Rs. 20.00 mn in the corresponding quarter ending of previous year, an increase of 17.12%. Revenue for the quarter rose by 24.94% to Rs. 235.14 mn from Rs. 188.20 mn, when compared with the prior year period. During Q4 FY15, EBIDTA is Rs. 24.09 mn as against Rs. 24.10 mn in the corresponding period of the previous year. During Q4 FY15, PBT increased by 25.18% to Rs. 27.16 mn from Rs. 21.70 mn in the corresponding period of the previous year. EPS of the company stood at Rs. 1.45 a share during the quarter, registering 17.15% increased over previous year period. For the year ended 31 March, 2015, the company reported total income of Rs. 874.65 mn compared to Rs. 852.70 mn over a previous year. For FY15, Net profit was Rs. 94.68 mn as compared to Rs. 72.40 mn in FY14, grew by 31%. Net Sales of the company are expected to grow at a CAGR of 8% over 2014 to 2017E. PEER GROUPS CMP MARKET CAP EPS P/E (X) P/BV(X) DIVIDEND Company Name (Rs.) Rs. in mn. (Rs.) Ratio Ratio (%) Brooks Laboratories Ltd 45.20 731.61 5.85 7.73 0.66 0.00 Bafna Pharmaceuticals Ltd 25.00 466.40 3.27 7.65 0.62 0.00 NGL Fine Chem Ltd 134.90 833.40 13.58 9.93 2.54 0.00 Hester Biosciences Ltd 588.00 5002.00 17.15 34.29 5.52 31.00
- 2. QUARTERLY HIGHLIGHTS (PARENT BASIS) Results updates- Q4 FY15, Months Mar-15 Mar-14 % Change Net Sales 235.14 188.20 24.94% PAT 23.42 20.00 17.12% EPS 1.45 1.24 17.15% EBITDA 24.09 24.10 -0.04% The company’s net profit jumps to Rs. 23.42 million against Rs. 20.00 million in the corresponding quarter ending of previous year, an increase of 17.12%. Revenue for the quarter rose by 24.94% to Rs. 235.14 million from Rs. 188.20 million, when compared with the prior year period. Reported earnings per share of the company stood at Rs. 1.45 a share during the quarter, registering 17.15% increased over previous year period. Profit before interest, depreciation and tax is Rs. 24.09 million as against Rs. 24.10 million in the corresponding period of the previous year. Break up of Expenditure Break up of Expenditure Rs. in (millions) Q4 FY15 Q4 FY14 % CHNG Cost of material consumed 166.97 137.51 21% Employee Benefit Expenses 12.02 5.31 126% Depreciation & Amortization Expenses 2.64 2.00 32% Other Expenses 38.31 29.77 29%
- 3. COMPANY PROFILE Brooks Laboratories Ltd. was established in 2002 and maintains its strong presence in the Pharmaceutical industry as a Contract Manufacturing Company since its inception. Brooks Laboratories Ltd is a Research and Development driven Pharmaceutical manufacturing company, in last 6 years company has successfully established itself as a reputed Contract Manufacturing company for latest molecules in Injectables and Clavulanic Acid range in Tablets and Dry Syrups. Brooks is known in Pharmaceutical corporate circles as a quality production House which is evident from its top notch customer base of for companies like Zydus Cadilla, Alembic, Intas, Wockhardt, FDC, Alkem, Medley, Sanat to name a few. Brooks is now expanding its business into the International markets of Africa, Middle East & Latin America. A stringent quality control (chemical and instrumental analyst) is being maintained under the highly qualified and experienced team who are responsible for analyzing the manufacturing process from raw material procurement through all operations up to final packing. A separate QA team handles all in-process quality controls. Brooks has team of qualified professionals who are constantly working to stabilize new molecules in niche segments, thus serving their valuable customers with stable latest products. Company has DCGI permission for many latest injectables at present. It has world class manufacturing facility at Baddi (Himachal Pradesh) 40 km from International Airport of Chandigarh. The facility is having covered area of 75000 sq feet.
- 4. FINANCIAL HIGHLIGHT (PARENT BASIS) (A*- Actual, E* -Estimations & Rs. In Millions) Balance Sheet as at March 31st, 2014 -2017E FY14A FY15A FY16E FY17E SOURCES OF FUNDS Shareholder's Funds Share Capital 161.86 161.86 161.86 161.86 Reserves and Surplus 961.04 952.30 1036.48 1130.52 1. Sub Total - Net worth 1122.90 1114.16 1198.34 1292.38 Non Current Liabilities Deferred Tax Liabilities [Net] 15.96 13.29 11.96 11.00 Long Term Provisions 6.08 6.62 7.15 7.65 2. Sub Total - Non Current Liabilities 22.04 19.91 19.11 18.65 Current Liabilities Short Term Borrowings 1.38 5.13 5.64 6.09 Trade Payables 122.95 190.67 236.43 278.99 Other Current Liabilities 44.89 17.78 19.91 21.90 Short Term Provisions 90.21 3.80 4.86 5.64 3. Sub Total - Current Liabilities 259.43 217.37 266.84 312.62 Total Liabilities (1+2+3) 1404.37 1351.44 1484.29 1623.65 APPLICATION OF FUNDS Non-Current Assets a) Fixed Assets 573.11 691.81 774.83 852.31 b) Non-current investments 0.20 0.20 0.21 0.22 c) Long Term loans and advances 101.40 111.61 120.54 128.98 d) Other non-current assets 32.86 0.00 0.00 0.00 1. Sub Total - Non Current Assets 707.57 803.62 895.58 981.51 Current Assets Inventories 60.29 75.34 87.39 97.88 Trade receivables 164.64 192.95 218.03 239.83 Cash and Bank Balances 299.88 229.23 224.81 236.05 Short-terms loans & advances 7.36 35.61 42.02 47.06 Other current assets 164.63 14.70 16.46 21.31 2. Sub Total - Current Assets 696.80 547.82 588.72 642.13 Total Assets (1+2) 1404.37 1351.44 1484.29 1623.65
- 5. Annual Profit & Loss Statement for the period of 2014 to 2017E Value(Rs.in.mn) FY14A FY15A FY16E FY17E Description 12m 12m 12m 12m Net Sales 852.70 852.13 971.43 1088.00 Other Income 0.00 22.52 23.87 25.06 Total Income 852.70 874.65 995.30 1113.06 Expenditure -767.50 -783.52 -884.00 -988.99 Operating Profit 85.20 91.12 111.30 124.07 Interest -1.20 -4.43 -5.14 -5.76 Gross profit 84.00 86.69 106.16 118.31 Depreciation -8.30 -11.04 -12.36 -13.60 Exceptional Items 0.00 27.85 0.00 0.00 Profit Before Tax 75.70 103.51 93.80 104.72 Tax -3.30 -8.83 -9.61 -10.68 Net Profit 72.40 94.68 84.18 94.04 Equity capital 161.86 161.86 161.86 161.86 Reserves 961.04 952.30 1036.48 1130.52 Face value 10.00 10.00 10.00 10.00 EPS 4.47 5.85 5.20 5.81 Quarterly Profit & Loss Statement for the period of 30th Sep, 2014 to 30th June, 2015E Value(Rs.in.mn) 30-Sep-14 31-Dec-14 31-Mar-15 30-Jun-15E Description 3m 3m 3m 3m Net sales 215.56 236.82 235.14 218.68 Other income 6.24 6.84 3.72 3.91 Total Income 221.80 243.66 238.86 222.59 Expenditure -200.18 -216.17 -214.77 -199.66 Operating profit 21.62 27.49 24.09 22.93 Interest -0.50 -2.60 -1.12 -1.18 Gross profit 21.12 24.89 22.97 21.75 Depreciation -3.24 -2.33 -2.64 -3.01 Exceptional Items 21.02 0.00 6.83 0.00 Profit Before Tax 38.90 22.56 27.16 18.74 Tax -0.87 -4.68 -3.74 -2.30 Net Profit 38.03 17.88 23.42 16.44 Equity capital 161.86 161.86 161.86 161.86 Face value 10.00 10.00 10.00 10.00 EPS 2.35 1.10 1.45 1.02
- 6. Ratio Analysis Particulars FY14A FY15A FY16E FY17E EPS (Rs.) 4.47 5.85 5.20 5.81 EBITDA Margin (%) 9.99% 10.69% 11.46% 11.40% PBT Margin (%) 8.88% 12.15% 9.66% 9.62% PAT Margin (%) 8.49% 11.11% 8.67% 8.64% P/E Ratio (x) 10.11 7.73 8.69 7.78 ROE (%) 6.45% 8.50% 7.02% 7.28% ROCE (%) 8.32% 9.13% 10.27% 10.60% EV/EBITDA (x) 5.08 5.57 4.60 4.04 Book Value (Rs.) 69.37 68.83 74.04 79.85 P/BV 0.65 0.66 0.61 0.57 Charts
- 7. OUTLOOK AND CONCLUSION At the current market price of Rs.45.20, the stock P/E ratio is at 8.69 x FY16E and 7.78 x FY17E respectively. Earning per share (EPS) of the company for the earnings for FY16E and FY17E is seen at Rs.5.20 and Rs.5.81 respectively. Net Sales of the company are expected to grow at a CAGR of 8% over 2014 to 2017E. On the basis of EV/EBITDA, the stock trades at 4.60 x for FY16E and 4.04 x for FY17E. Price to Book Value of the stock is expected to be at 0.61 x and 0.57 x for FY16E and FY17E respectively. We recommend ‘BUY’ in this particular scrip with a target price of Rs.53.00 for Medium to Long term investment. INDUSTRY OVERVIEW India is expected to be the third-largest global generic active pharmaceutical ingredient (API) merchant market by 2016, with a 7.2 per cent market share. The country accounts for the second largest number of Abbreviated New Drug Applications (ANDAs) and is the world’s leader in Drug Master Files (DMFs) applications with the US. The country's pharmaceutical industry expanded at a compound annual growth rate (CAGR) of 9.4 per cent in 2013 to reach US$ 12 billion and is expected to expand at a CAGR of 23.9 per cent to US$ 55 billion by 2020. With 72 per cent of market share, generic drugs form the largest segment of the Indian pharmaceutical sector. In terms of value, exports of pharmaceutical products from India increased at a CAGR of 26.1 per cent to US$ 10.1 billion during FY06–13. Generic drugs account for 20 per cent of global exports in terms of volume, making the country the largest provider of generic medicines globally and expected to expand even further in coming years. The Government of India plans to set up a US$ 640 million venture capital fund to boost drug discovery and strengthen pharma infrastructure. Pharma Vision 2020 by the government’s Department of Pharmaceuticals aims to make India a major hub for end-to-end drug discovery. With 70 per cent of India’s population residing in rural areas, pharma companies have immense opportunities to tap this market. Various companies are investing in the distribution network in rural areas. India also has the potential to attract huge investments to its clinical trial market.
- 8. Disclaimer: This document is prepared by our research analysts and it does not constitute an offer or solicitation for the purchase or sale of any financial instrument or as an official confirmation of any transaction. The information contained herein is from publicly available data or other sources believed to be reliable but we do not represent that it is accurate or complete and it should not be relied on as such. Firstcall Research or any of its affiliates shall not be in any way responsible for any loss or damage that may arise to any person from any inadvertent error in the information contained in this report. Firstcall Research and/ or its affiliates and/or employees will not be liable for the recipients’ investment decision based on this document.
- 9. Firstcall India Equity Research: Email – info@firstobjectindia.com C.V.S.L.Kameswari Pharma & Diversified U. Janaki Rao Capital Goods B. Anil Kumar Auto, IT & FMCG M. Vinayak Rao Diversified G. Amarender Diversified Firstcall Research Provides Industry Research on all the Sectors and Equity Research on Major Companies forming part of Listed and Unlisted Segments For Further Details Contact: Tel.: 022-2527 2510/2527 6077 / 25276089 Telefax: 022-25276089 040-20000235 /20000233 E-mail: info@firstobjectindia.com www.firstcallresearch.com