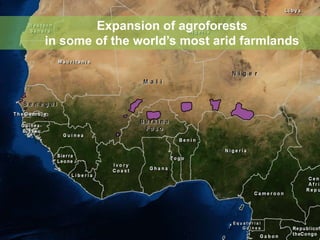
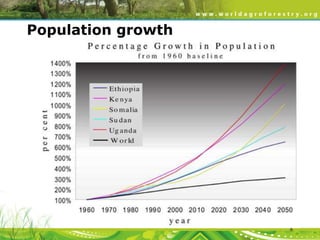
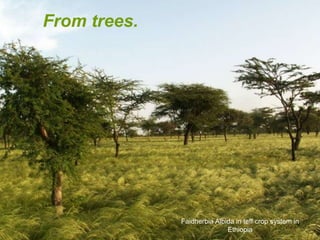
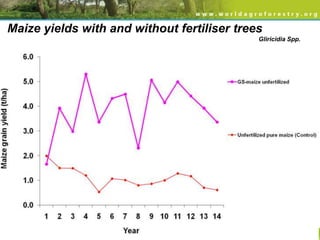
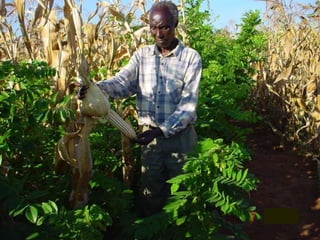
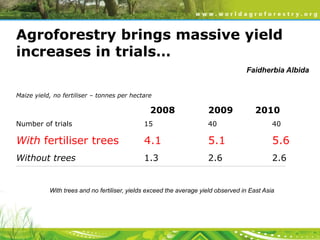
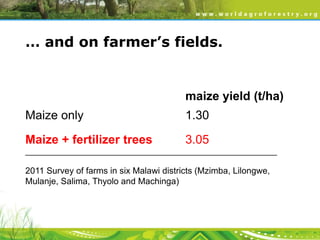
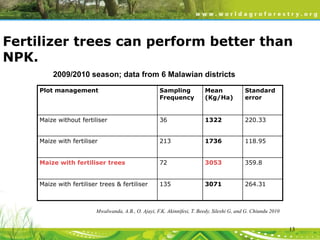
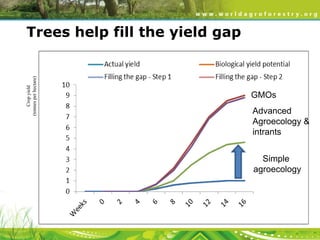
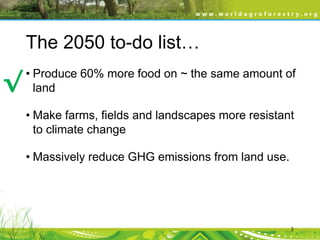
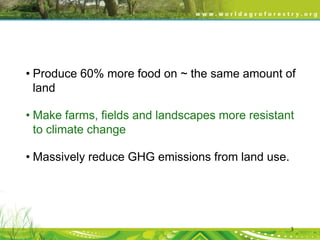
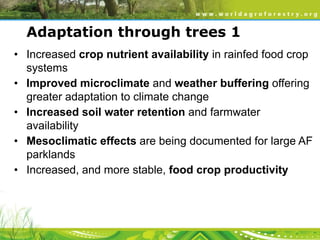
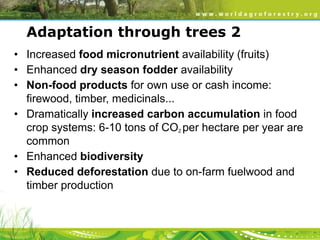
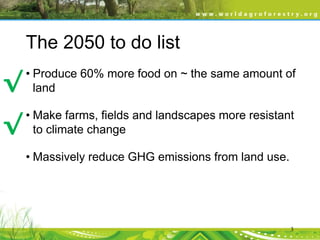
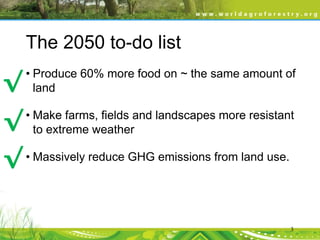
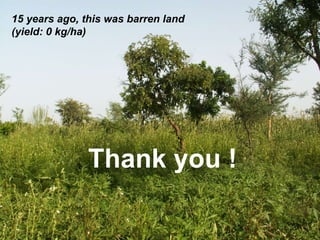
Agroforestry:
an essential climate resilience
tool
Patrick Worms, ICRAF
2013
Who are we?
• One of the 15 CGIAR research centres
• employing about 500 scientists and other staff.
• We generate knowledge about the diverse roles
that trees play in agricultural landscapes

• We use this research to advance policies and
practices that benefit the poor and the environment.

2
By 2050, we need to…
• Produce 60% more food on ~ the same amount of
land
• Make farms, fields and landscapes more resistant
to climate change
• Massively reduce GHG emissions from land use.

3
The context
Population growth

8
5000

Cereal yields by region

4500
4000

East Asia

Kg per Hectare

3500

Latin America

3000
2500
2000

South Asia

1500

1000

Sub-Saharan Africa
500
0
1960

1965

1970

1975

World Bank World Development Indicators

1980

1985

1990

1995

2000

2005
2500

Fertiliser use by region
East
Asia

100 grams per Hectare

2000

1500

South Asia
1000

Latin America
500

Sub-Saharan Africa
0
1960

1965

1970

1975

1980

World Bank World Development Indicators

1985

1990

1995

2000

2005
And, of course...
Which, depressingly, leads to...

IPCC 4th assessement report
The result?
Undernourishment, which...
… brings instability,...
…low literacy...
…especially among women...
…thus huge population growth rates...
… deep poverty ...
… hence huge yield gaps…
… and thus hunger.
Oh, and lest we forget...
Africa is
enormous.
The result?
A hellish spiral.
Or, less emotionally:
•

Population growth has rendered fallowing impossible in many
communities

•

Land overuse is depleting soil organic matter, soil carbon and soil
microbiology

•

Soil fertility is dropping by 10-15% a year (Bunch, 2011)

•

Poverty and logistics makes fertiliser unaffordable for most
smallholders

•

Funding for fertiliser subsidies is scarce and fickle

7
So… is that 2050 to-do list doable?
• Produce 60% more food on ~ the same amount of land
• Make farms, fields and landscapes more resistant to
climate change
• Massively reduce GHG emissions from land use.

3
Where will soil fertility and climate resilience
come from ?

7
From trees.

Faidherbia Albida in teff crop system in
Ethiopia
Maize yields with and without fertiliser trees
Gliricidia Spp.
Agroforestry brings massive yield
increases in trials…
Faidherbia Albida
Maize yield, no fertiliser – tonnes per hectare

2008

2009

2010

Number of trials

15

40

40

With fertiliser trees

4.1

5.1

5.6

Without trees

1.3

2.6

2.6

________________________________________________________________________________________________________________________________________________________________________________________________

With trees and no fertiliser, yields exceed the average yield observed in East Asia
… and on farmer’s fields.

maize yield (t/ha)
Maize only

1.30

Maize + fertilizer trees

3.05

__________________________________________________________

2011 Survey of farms in six Malawi districts (Mzimba, Lilongwe,
Mulanje, Salima, Thyolo and Machinga)
Then...
Zinder, Niger, 1980s
... and now.
Zinder, Niger, today.

These 5 million hectares of new agroforest
parklands are yielding

500,000 tonnes
more than before.
(Reij, 2012)
Kantché district, Zinder, Niger
350,000 people, rainfall ca. 350 mm / year, typical of Sahel
drylands.

•
•
•
•
•
•
•
•

Annual district-wide grain surplus:
2007
2008
2009
2010
2011

21,230
36,838
28,122
64,208
13,818

tons
tons
tons
tons
tons

drought year !

drought year !

.

Yamba & Sambo, 2012
23
Fertilizer trees can perform better than
NPK.
2009/2010 season; data from 6 Malawian districts
Plot management

Sampling
Frequency

Mean
(Kg/Ha)

Standard
error

Maize without fertiliser

36

1322

220.33

Maize with fertiliser

213

1736

118.95

Maize with fertiliser trees

72

3053

359.8

Maize with fertiliser trees & fertiliser

135

3071

264.31

Mwalwanda, A.B., O. Ajayi, F.K. Akinnifesi, T. Beedy, Sileshi G, and G. Chiundu 2010

13
Expansion of agroforests
in some of the world’s most arid farmlands
Fertiliser trees are just one of many kinds of
agroforestry.
• Agroforests: combinations of perennial species on arable
land
• Home gardens with perennials
• Woodlots or farm forests
• Trees on field and farm boundaries

• Sylvopastoral systems: Trees in pastures
• EverGreen Agriculture: Trees intercropped with field
crops
• Productive landscape systems
800 $ / Ha / year
High social costs

3,000 $ / Ha / year

High environmental
costs

No social costs
Low environmental
costs

Leakey, 2012
Crop yield
(tonnes per hectare)

Trees help fill the yield gap

GMOs

Advanced
Agroecology &
intrants
Simple
agroecology
The 2050 to-do list…

√

• Produce 60% more food on ~ the same amount of
land
• Make farms, fields and landscapes more resistant
to climate change
• Massively reduce GHG emissions from land use.

3
• Produce 60% more food on ~ the same amount of
land
• Make farms, fields and landscapes more resistant
to climate change
• Massively reduce GHG emissions from land use.

3
Adaptation through trees 1
• Increased crop nutrient availability in rainfed food crop
systems
• Improved microclimate and weather buffering offering
greater adaptation to climate change
• Increased soil water retention and farmwater
availability
• Mesoclimatic effects are being documented for large AF
parklands
• Increased, and more stable, food crop productivity
Adaptation through trees 2
• Increased food micronutrient availability (fruits)
• Enhanced dry season fodder availability
• Non-food products for own use or cash income:
firewood, timber, medicinals...
• Dramatically increased carbon accumulation in food
crop systems: 6-10 tons of CO2 per hectare per year are
common
• Enhanced biodiversity
• Reduced deforestation due to on-farm fuelwood and
timber production
Development of climate analogues
The 2050 to do list

√

• Produce 60% more food on ~ the same amount of
land

√

• Make farms, fields and landscapes more resistant
to climate change
• Massively reduce GHG emissions from land use.

3
• Produce 60% more food on ~ the same amount of
land
• Make farms, fields and landscapes more resistant
to climate change
• Massively reduce GHG emissions from land use.

3
Sectoral shares of global GHG emissions:
land use and ag > 30% !
Trees lock up C above and below ground
Mitigation
through trees

Carbon potential in various
AF systems

Mbow personal communication
(2012)
How do we know that?
Quantifying the potential of CSA.
Landscape

Monitoring GHGs

Multi-scale, randomized sampling
design

Physical
environment

Surveys & focus groups

Remote sensing & ground
truthing

Standard Assessment of Mitigation Potential and Livelihoods in Smallholder Systems
Mapping soil organic carbon
Mapping SOC Stocks using high resolution
(QuickBird) satellite image

A landscape level SOC stocks mapping can be
made using medium resolution satellite
imagery such as ASTER and Landsat

SOC stocks in the mid Yala, western Kenya. The effect of cloud is masked as no data
Mapping of soil erosion
The 2050 to-do list

√

• Produce 60% more food on ~ the same amount of
land

√

• Make farms, fields and landscapes more resistant
to extreme weather

√

• Massively reduce GHG emissions from land use.

3
To get there:
Integrate, don’t segregate.
How we manage
the landscape…
Crop
Land

Pasture &
Rangelands

1.5 billion ha

3.4 billion ha

Natural
Forest
4.1 billion ha

Deserts

Wetlands

1.9 billion ha

1.3 billion ha

… and what it looks like
in the real world.
Agroforests
Plantations

deforestation re- and afforestation

Fields,fallow, forest mosaic

Integrate
Segregate

Fields, F
orests &
Parks
Is this the best way to achieve..
•
•
•
•

Productivity/Income ?
Sequestration/Mitigation ?
Reduced emissions ?
Resilience/Adaptation ?

Agriculture
Forestry
Environment
CSA

REDD+

PES
Old Impact Pathway Paradigm

Development
(application of knowledge)

Research
(building of knowledge)

Time
(years)
New Impact Pathway Paradigm

Development
(proof of application &

application of knowledge)

Research
(building of knowledge)

Time
(years)
15 years ago, this was barren land
(yield: 0 kg/ha)

Thank you !
For more information
Patrick Worms, World Agroforestry Centre
Email:p.worms@cgiar.org
Tel: +32 495 24 46 11
www.worldagroforestrycentre.org

53

Drylands security and agroforestry

  • 1.
    Agroforestry: an essential climateresilience tool Patrick Worms, ICRAF 2013
  • 2.
    Who are we? •One of the 15 CGIAR research centres • employing about 500 scientists and other staff. • We generate knowledge about the diverse roles that trees play in agricultural landscapes • We use this research to advance policies and practices that benefit the poor and the environment. 2
  • 3.
    By 2050, weneed to… • Produce 60% more food on ~ the same amount of land • Make farms, fields and landscapes more resistant to climate change • Massively reduce GHG emissions from land use. 3
  • 4.
  • 5.
  • 6.
    5000 Cereal yields byregion 4500 4000 East Asia Kg per Hectare 3500 Latin America 3000 2500 2000 South Asia 1500 1000 Sub-Saharan Africa 500 0 1960 1965 1970 1975 World Bank World Development Indicators 1980 1985 1990 1995 2000 2005
  • 7.
    2500 Fertiliser use byregion East Asia 100 grams per Hectare 2000 1500 South Asia 1000 Latin America 500 Sub-Saharan Africa 0 1960 1965 1970 1975 1980 World Bank World Development Indicators 1985 1990 1995 2000 2005
  • 8.
  • 9.
    Which, depressingly, leadsto... IPCC 4th assessement report
  • 10.
  • 11.
  • 12.
  • 13.
  • 14.
  • 15.
    …thus huge populationgrowth rates...
  • 16.
  • 17.
    … hence hugeyield gaps…
  • 18.
    … and thushunger.
  • 19.
    Oh, and lestwe forget...
  • 20.
  • 21.
  • 22.
  • 23.
    Or, less emotionally: • Populationgrowth has rendered fallowing impossible in many communities • Land overuse is depleting soil organic matter, soil carbon and soil microbiology • Soil fertility is dropping by 10-15% a year (Bunch, 2011) • Poverty and logistics makes fertiliser unaffordable for most smallholders • Funding for fertiliser subsidies is scarce and fickle 7
  • 24.
    So… is that2050 to-do list doable? • Produce 60% more food on ~ the same amount of land • Make farms, fields and landscapes more resistant to climate change • Massively reduce GHG emissions from land use. 3
  • 25.
    Where will soilfertility and climate resilience come from ? 7
  • 26.
    From trees. Faidherbia Albidain teff crop system in Ethiopia
  • 27.
    Maize yields withand without fertiliser trees Gliricidia Spp.
  • 29.
    Agroforestry brings massiveyield increases in trials… Faidherbia Albida Maize yield, no fertiliser – tonnes per hectare 2008 2009 2010 Number of trials 15 40 40 With fertiliser trees 4.1 5.1 5.6 Without trees 1.3 2.6 2.6 ________________________________________________________________________________________________________________________________________________________________________________________________ With trees and no fertiliser, yields exceed the average yield observed in East Asia
  • 30.
    … and onfarmer’s fields. maize yield (t/ha) Maize only 1.30 Maize + fertilizer trees 3.05 __________________________________________________________ 2011 Survey of farms in six Malawi districts (Mzimba, Lilongwe, Mulanje, Salima, Thyolo and Machinga)
  • 31.
  • 32.
    ... and now. Zinder,Niger, today. These 5 million hectares of new agroforest parklands are yielding 500,000 tonnes more than before. (Reij, 2012)
  • 33.
    Kantché district, Zinder,Niger 350,000 people, rainfall ca. 350 mm / year, typical of Sahel drylands. • • • • • • • • Annual district-wide grain surplus: 2007 2008 2009 2010 2011 21,230 36,838 28,122 64,208 13,818 tons tons tons tons tons drought year ! drought year ! . Yamba & Sambo, 2012 23
  • 34.
    Fertilizer trees canperform better than NPK. 2009/2010 season; data from 6 Malawian districts Plot management Sampling Frequency Mean (Kg/Ha) Standard error Maize without fertiliser 36 1322 220.33 Maize with fertiliser 213 1736 118.95 Maize with fertiliser trees 72 3053 359.8 Maize with fertiliser trees & fertiliser 135 3071 264.31 Mwalwanda, A.B., O. Ajayi, F.K. Akinnifesi, T. Beedy, Sileshi G, and G. Chiundu 2010 13
  • 35.
    Expansion of agroforests insome of the world’s most arid farmlands
  • 36.
    Fertiliser trees arejust one of many kinds of agroforestry.
  • 37.
    • Agroforests: combinationsof perennial species on arable land • Home gardens with perennials • Woodlots or farm forests • Trees on field and farm boundaries • Sylvopastoral systems: Trees in pastures • EverGreen Agriculture: Trees intercropped with field crops • Productive landscape systems
  • 38.
    800 $ /Ha / year High social costs 3,000 $ / Ha / year High environmental costs No social costs Low environmental costs Leakey, 2012
  • 39.
    Crop yield (tonnes perhectare) Trees help fill the yield gap GMOs Advanced Agroecology & intrants Simple agroecology
  • 40.
    The 2050 to-dolist… √ • Produce 60% more food on ~ the same amount of land • Make farms, fields and landscapes more resistant to climate change • Massively reduce GHG emissions from land use. 3
  • 41.
    • Produce 60%more food on ~ the same amount of land • Make farms, fields and landscapes more resistant to climate change • Massively reduce GHG emissions from land use. 3
  • 42.
    Adaptation through trees1 • Increased crop nutrient availability in rainfed food crop systems • Improved microclimate and weather buffering offering greater adaptation to climate change • Increased soil water retention and farmwater availability • Mesoclimatic effects are being documented for large AF parklands • Increased, and more stable, food crop productivity
  • 43.
    Adaptation through trees2 • Increased food micronutrient availability (fruits) • Enhanced dry season fodder availability • Non-food products for own use or cash income: firewood, timber, medicinals... • Dramatically increased carbon accumulation in food crop systems: 6-10 tons of CO2 per hectare per year are common • Enhanced biodiversity • Reduced deforestation due to on-farm fuelwood and timber production
  • 44.
  • 45.
    The 2050 todo list √ • Produce 60% more food on ~ the same amount of land √ • Make farms, fields and landscapes more resistant to climate change • Massively reduce GHG emissions from land use. 3
  • 46.
    • Produce 60%more food on ~ the same amount of land • Make farms, fields and landscapes more resistant to climate change • Massively reduce GHG emissions from land use. 3
  • 47.
    Sectoral shares ofglobal GHG emissions: land use and ag > 30% !
  • 48.
    Trees lock upC above and below ground
  • 49.
    Mitigation through trees Carbon potentialin various AF systems Mbow personal communication (2012)
  • 50.
    How do weknow that? Quantifying the potential of CSA. Landscape Monitoring GHGs Multi-scale, randomized sampling design Physical environment Surveys & focus groups Remote sensing & ground truthing Standard Assessment of Mitigation Potential and Livelihoods in Smallholder Systems
  • 51.
    Mapping soil organiccarbon Mapping SOC Stocks using high resolution (QuickBird) satellite image A landscape level SOC stocks mapping can be made using medium resolution satellite imagery such as ASTER and Landsat SOC stocks in the mid Yala, western Kenya. The effect of cloud is masked as no data
  • 52.
  • 53.
    The 2050 to-dolist √ • Produce 60% more food on ~ the same amount of land √ • Make farms, fields and landscapes more resistant to extreme weather √ • Massively reduce GHG emissions from land use. 3
  • 54.
    To get there: Integrate,don’t segregate.
  • 55.
    How we manage thelandscape… Crop Land Pasture & Rangelands 1.5 billion ha 3.4 billion ha Natural Forest 4.1 billion ha Deserts Wetlands 1.9 billion ha 1.3 billion ha … and what it looks like in the real world.
  • 56.
    Agroforests Plantations deforestation re- andafforestation Fields,fallow, forest mosaic Integrate Segregate Fields, F orests & Parks
  • 57.
    Is this thebest way to achieve.. • • • • Productivity/Income ? Sequestration/Mitigation ? Reduced emissions ? Resilience/Adaptation ? Agriculture Forestry Environment CSA REDD+ PES
  • 58.
    Old Impact PathwayParadigm Development (application of knowledge) Research (building of knowledge) Time (years)
  • 59.
    New Impact PathwayParadigm Development (proof of application & application of knowledge) Research (building of knowledge) Time (years)
  • 61.
    15 years ago,this was barren land (yield: 0 kg/ha) Thank you !
  • 62.
    For more information PatrickWorms, World Agroforestry Centre Email:p.worms@cgiar.org Tel: +32 495 24 46 11 www.worldagroforestrycentre.org 53

Editor's Notes

  • #13 What are the data points we want to highlightBuild up – demographics, political, productivity, future resilienceD – start with political (in the news – terrorism, instability) – what’s undelying this – productivity