Download to read offline


![Characterization of Temperature and Time Staying on Updraft Fixed Continuous Incinerator for
REFERENCES
[1]. Bridgwater; 1980. Waste Incineration and Pyrolysis. Resource Recovery and Conservation. 5; 99-115
[2]. Blasi C.D; 2008.Modeling chemical and physical processes of wood and biomass pyrolysis. Progress in
53
Energy and Combustion Science. 34: 47–90
[3]. Barrio M, Fossum M, Hustad J.E; 2001. A small-scale stratified downdraft gasifiercoupled to a gas
engine for combined heat and power production. Progress in thermochemical biomass conversion. 426-
440
[4]. Caballero, J.A., Marcilla, A., Front, R., Conesa, JA., 1997. Characterisation of sludges primary and
secondary pyrolysis. J. Anal. Applied Pyrolysis. 4041 : 433-450
[5]. De Steene, L.V., Tagutchou, J.P., Mermoud, F., Martin, E., Salvadorb, F,, 2010.. Continuous Fixed
Bed Reactor to characterise wood char gasification.Fuel 89: 3320–3329
[6]. Hen, C, Yu-Qi, J., Jian-hua, Y., Chi, Y 2011. “Simulation of municipal solid waste gasification in two
different types of fixed bed reactors. Fuel
[7]. Jeng-ChyanMuti Lin, 2006, Development of an updraft fixed bed gasifierwith an embedded combustor
fed by solid biomass, Journal of the Chinese Institute of Engineers. 29 (3): 557-562.
[8]. Liu, Y.A., Liu, Y.U., 2005. “Novel incineration technology integrated with drying, pyrolysis,
gasification, and combustion of MSW and ashes vitrivication. Environmental Science Technology. 39:
3855- 3863.
[9]. Lee, C.C., Lin, S.D., 2007. Handbook of environmental engineering calculations. second edition. 39,
Mc. Graw- Hill Compa.](https://image.slidesharecdn.com/f1094453-141101054537-conversion-gate02/85/International-Journal-of-Engineering-Research-and-Development-10-320.jpg)

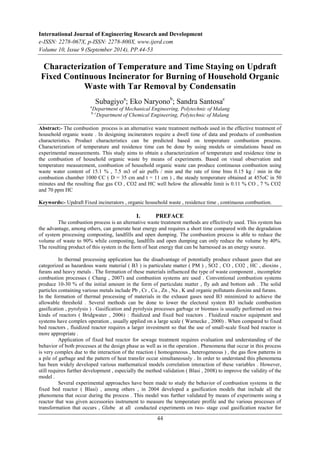
This study examines the characterization of temperature and residence time in a fixed updraft incinerator for effectively burning household organic waste. Experimental results indicate optimal combustion conditions, with a steady temperature achieved at 455°C over 50 minutes, and emissions of CO, CO2, and HC well below permissible limits. The findings highlight that higher water content in the waste decreases combustion temperature, and that efficiently removing tar from flue gases reduces pollutants.


![And automotive gas oil [ago].](https://cdn.slidesharecdn.com/ss_thumbnails/andautomotivegasoilago-130703081626-phpapp01-thumbnail.jpg?width=640&height=640&fit=bounds)