2014_Belkheiri et al._Cellulose Chemistry and Technology
1. CELLULOSE CHEMISTRY AND TECHNOLOGY
Cellulose Chem. Technol., 48 (9-10), 813-818 (2014)
KRAFT LIGNIN DEPOLYMERIZATION IN NEAR-CRITICAL WATER:
EFFECT OF CHANGING CO-SOLVENT
TALLAL BELKHEIRI, LENNART VAMLING, THI DIEU HUYEN NGUYEN,*
MARCO MASCHIETTI,*,***
LARS OLAUSSON,**
SVEN-INGVAR ANDERSSON,*
LARS-ERIK ÅMAND and HANS THELIANDER*
Chalmers University of Technology, Department of Energy and Environment,
SE-412 96 Gothenburg, Sweden
*
Chalmers University of Technology, Department of Chemical and Biological Engineering,
SE-412 96 Gothenburg, Sweden
**
Valmet Power AB, Box 8734, SE-402 75 Gothenburg, Sweden
***
Aalborg University Esbjerg, Department of Biotechnology, Chemistry and Environmental Engineering Niels
Bohrs Vej 8, 6700 Esbjerg, Denmark
✉Corresponding author: Tallal Belkheiri, Tallal.Belkheiri@chalmers.se
As part of developing a process to valorize lignin in a pulp mill with lignin separation, the depolymerisation of lignin to
valuable chemicals was investigated in near-critical water. This was done by using methanol as co-solvent and
hydrogen donor, phenol to suppress repolymerization (e.g. formation of char), and ZrO2 as a heterogeneous catalyst,
with potassium carbonate as a co-catalyst. The reaction was carried out in a continuous flow fixed-bed reactor (500
cm3
), at 280-350 °C and 25MPa. An important aspect is to suppress char formation. Therefore, the char formation was
studied by using different concentrations of methanol and phenol. The char yield varied between 14% and 26%. When
using methanol as the only co-solvent, the char yield decreased with increasing methanol concentration. Adding phenol
resulted in a further decrease. The reactor outlet consisted mainly of two liquid phases, an aqueous and an oil phase,
mixed together. The chemical analysis of the aqueous phase showed the presence of mainly phenolic compounds, for
instance guaiacol, catechol, phenol and cresol.
Keywords: LignoBoost, lignin conversion, hydrogen donors, char formation, phenolic compound, near-critical water
INTRODUCTION
To date, the pulping industries have been
focused on manufacturing fibers and thereby
mainly using the cellulose in the wood, while
lignin has been mainly utilized as internal fuel.
Accordingly, 55 million tons of lignin are
produced per year as a secondary product in the
pulping process.1
Nevertheless, it contributes with
40% of the energy content of lignocellulose
biomass.1
It is separated in the pulping process
from the other lignocellulosic constituents by
means of physical and chemical processes, and
these extraction procedures influence the
structure, purity and properties of lignin.2
In the Kraft process, lignin is recovered in the
“black liquor”, which has been used as fuel to
meet the steam and power needs of the pulping
processes. Until now, many chemical conversion
routes have been investigated with the purpose of
increasing the value of lignin.
One such new method for the valorization of
Kraft lignin is the LignoBoost process,3
which has
recently been commercialized. The LignoBoost
process extracts high quality lignin from the black
liquor, which gives new possibilities for
expanding the pulp mill capacity at lower cost,
and the potential for internal or external use of the
lignin depending on the energy balance of the
mill.
Several studies have shown that lignin is a
promising source for further conversion to liquid
fuel and phenolic compounds.4,5
Therefore, many
thermal, chemical and thermochemical processes
for converting lignin into valuable chemicals have
been investigated. For instance, Pińkowska et al.,6
and Yong et al.7
have shown lignin depoly-
merization in sub- and supercritical water for a
range of temperatures from 473K to 663K. In
these studies, water was considered as a reaction
2. TALLAL BELKHEIRI et al.
814
medium. Moreover, water has many applications
as a medium for chemical synthesis, waste
destruction and biomass processing.8
Supercritical
water is an attractive fluid from a thermodynamic
perspective due to the properties that it has,
compared to other fluids, in supercritical
conditions. For instance supercritical water has a
lower dielectric constant, weaker hydrogen bonds,
and high isothermal compressibility.8
Thus, it is a
suitable medium for biomass degradation
reactions.
Supercritical water has, however, a drawback,
i.e. that salts have a very low solubility.
Therefore, near supercritical water is to be
preferred in cases when inorganic salts are
present: many inorganic salts have a reasonably
good solubility and the water has properties that
approach those of supercritical water.
The mechanisms associated with different
homogenous9,10,11
and heterogeneous catalysts12, 13
for biomass conversion processes have been
investigated. These studies have shown a char
reduction and high phenolic compounds yields
when suitable operation conditions are used.
Different hydrogen donor solvents have also been
investigated for the conversion of lignin, such as
methanol, which has shown a high activity as a
hydrogen donor.14
An earlier study13
has shown that
depolymerization reactions are promoted in the
presence of homogeneous (K2CO3) and
heterogeneous (Zirconia) catalysts. Phenol has the
role of a capping agent to suppress char.15
The
objective of this study has been to examine the
effect of methanol and phenol together with
K2CO3 and Zirconia on the conversion of Kraft
lignin into bio-fuel and small aromatic
compounds in near critical water.
EXPERIMENTAL
Materials
Softwood lignin, extracted with the LignoBoost
process in Bäckhammar, was used in all experiments.
All the chemicals were used without further
purification.
The heterogeneous catalyst used in the reactor was
made of zirconia (ZrO2) pellets from two suppliers: I)
Harshaw Chemie BV, length: 3 mm, diameter: 3 mm,
BET surface area 48 m2
/g and II) Saint-Gobain
NorPro, length: 3 mm, diameter: 3 mm, BET surface
area 55 m2
/g. Potassium carbonate (K2CO3, ≥99.5%),
used as the homogeneous co-catalyst, methanol
(≥98.5%) and phenol (crystallized, ≥99.5%), used as
co-solvent, were all from Scharlau.
Apparatus and procedure
The experiments were performed in a continuous
pilot plant (see Figure 1).
The system was composed of a fixed bed reactor
(500 cm3
Parr 4575), made of Inconel 600 and
equipped with an electrical heating jacket; two high-
pressure diaphragm pumps were installed, one used as
a feed pump and the second as recirculation pump in
order to rapidly heat up the fresh feed. The heating
system was constituted of an electrical heating jacket
around the piping, the feed tank and the reactor.
A run was carried out in the following steps.
First a lignin slurry was prepared, which was
constituted of a mixture of lignin, K2CO3, methanol
and deionized water. The mixture was dispersed by
using an Ultra Turrax disperser for approximately 10
min at room temperature. Then phenol was added to
the slurry in the experiments where it was used (A, D
and E).
The system was heated up and pressurized to
operating conditions (see Table 1) by using a
continuous flow of deionized water. Then, the lignin
slurry was continuously pumped by a high-pressure
diaphragm pump at a flow rate of 1 kg/h. The mixture
flowed through the catalyst bed for a residence time of
approximately 11 min. The free volume of the reactor
charged with the catalyst was 294 cm3
. The major part
of the outlet was recirculated using a pump at a flow
rate of approximately 10 kg/h.
The liquid products were continuously collected in
sampling bottles every 40 min for analysis. Gas
samples were collected in a gas bag (Tedlar sample
bag, SKC) for a qualitative analysis.
After approximately 90 min from the start of the
operation, the operating parameters became stable. The
total run period was about 320 min with more than 180
min under steady state conditions. The shutdown
operation began with cooling down to meet the
conditions required for depressurizing. Then, the
reactor was disassembled and the catalyst was
recovered to measure the char deposited.
The collected samples of liquid products were
separated by means of centrifugation.13
The
centrifugation resulted in an aqueous phase with a
yellowish colour, and an oily phase with a black colour
and high viscosity. However, in some experiments
there was a water phase with solid particles instead of
an oily phase.
Experimental conditions
In order to evaluate the effect of changing the ratio
of methanol/water, it was varied from 0 to 3 by
volume, in the presence of phenol, and for two ratios in
the runs without phenol. The operating conditions for
all runs are reported in Table 1. The reactor
temperature and pressure were selected taking into
account the near critical conditions for each ratio of
water-methanol, with the critical point estimated using
the “RefProp” program.16
The K2CO3 amount in the
3. Lignin conversion
815
feed and the lignin amount were kept constant (wet
lignin 170 g, K2CO3 34 g) for all runs.
Analytical methods
Characterization methods
Characterization methods as well as analytical
apparatus have been previously reported in details by
the authors.13
Regarding the analysis of the molecular weight
distribution of the oily phase in Experiments D and E,
a Gel permeation chromatography (GPC) was run with
three series coupled columns Styragel HR2 (500-20
kDa), HR1 (0.1-5 kDa) and HR0,5 (0-1 kDa) with
THF as eluent, calibration was made with polystyrene
standard curve 480-19600 Da, and a UV-absorbance
detector was used for detection at wavelength 280 nm.
The samples (15-190 mg) were dissolved in 50:50
THF:DMSO, which was further diluted to 1 mg/mL
with THF and analyzed with GPC/UV. The GPC
analysis was carried out by SP Technical Research
Institute of Sweden.
Quantitation of char on solid catalyst
During the operation, char was formed due to the
repolymerization of unconverted lignin and reactive
light fraction. In order to quantify the char deposited
on the catalyst, a regeneration procedure was carried
out. The catalyst particles were recovered at the end of
the cleaning procedure, and a portion of the catalyst
was sampled. This sample was dried in an oven at 105
°C for about 24 h. After this, the sample was weighed.
The catalyst sample was regenerated at 500 °C for 12 h
to remove char. Afterwards the sample was cooled
then weighed again. Thus by knowing the total mass of
dry catalyst before the experiment in the reactor, the
yield of char on a dry lignin basis could be calculated
for each experiment.
Electric
heater
Cooling
water
Reactor
Gas feed/
sampling
HP Feed
pump
Product
sampling
Water
Safety
system
Electric
preheater
Pressure
control
Feed
tank
HP
Recirc.
pump
Cooler
Figure 1: Pilot plant
Table 1
Operation conditions
A B C D E
Temperature (K) 623 623 583 583 553
Pressure (MPa) 25 25 25 25 20
Methanol/Water* 0 0.064** 1 1 3
Methanol (%w/w) 0 4.1% 41% 39% 61%
Phenol (%w/w) 4.1% 0 0 3.9% 4.7%
K2CO3 (%w/w) 1.6% 1.6% 1.6% 1.6% 1.9%
Dry lignin (%w/w) 5.5% 5.5% 5.5% 5.3% 6.5%
Catalyst supplier I I I I II
*Ratio by volume
**It is equivalent to 86 g of methanol. This is the same amount of phenol as used in previous tests
RESULTS AND DISCUSSION
Properties of the used LignoBoost Kraft lignin
The properties of the lignin used are given in
Table 2.
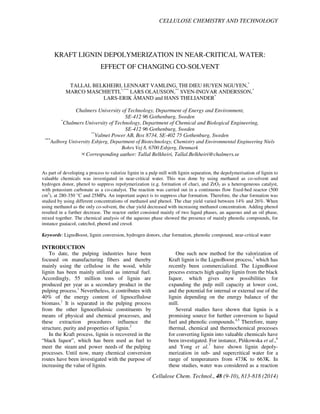
Char formation
The effect of methanol and phenol on lignin
conversion was investigated for different ratios of
4. TALLAL BELKHEIRI et al.
816
methanol/water with (and without) phenol and the results are shown in Figure 2.
Table 2
Properties of LignoBoost Kraft lignin13
Moisture
(wt%)
Aromatics
(wt%)
Aliphatics
(wt%)
Molecular
weight (g/mol)
Lignin
properties
32.6 78 22 3900
Figure 2: Char yields for different methanol and phenol concentrations
Table 3
Mass fractions (%) of the main compound classes in the aqueous phase analysed by GCMS
Class A D E
Phenol 1.96 1.96 3.14
Anisoles 0.001 0.19 0.21
Cresol 0.17 0.3 0.06
Guaiacols 0.05 0.19 0.26
Catechols 0.19 0.02 -
Dimers 0.006 0.4 0.52
By increasing the methanol to water ratio from
0.064 to 1 (by volume) without using phenol, the
char yield on the solid catalyst decreased from
26.2% to 16.7%. By adding phenol and increasing
the methanol/water ratio from 0 to 1, this char
yield decreased further to 14.1%. However, by
keeping the same phenol/lignin ratio and
increasing the methanol/water ratio to 3, the char
yield increased to 17.5%. In contrast, using
methanol as a solvent created more clogging
problems and variation in pressure during the
experiments. An improvement during the
experiments was observed when phenol was
added, which prevented char formation. Thus, the
phenol-methanol mixture showed a lower char
yield on the solid catalyst and more stable
operating conditions. It was observed that using
methanol led to the formation of a small amount
of solid particles, it might be an oily phase with
very high molecular weight (soluble in THF).
Accordingly, less oil in the liquid phase was
recovered or no oil phase was observed in
Experiments B and C.
Chemical analysis
The aqueous phase also contained a
considerable amount of methanol in Experiments
D and E, but no accurate analysis was made of the
methanol content.
Table 3 shows that an increase in the methanol
concentration increased the amount of guaiacol
and anisole to 0.26% and 0.21%, respectively.
Furthermore, the phenol concentration increased
to 3.14% in Experiment E, which had the highest
5. Lignin conversion
817
amount of methanol (61%) in the feed slurry. For
the same amount of methanol (61%), the dimers
fraction in the aqueous phase increased to 0.52%.
The largest amount of cresol (0.3%) was observed
in Experiment D.
Table 4
Yields of oil, water soluble organics and char
A D E
YOIL % 72.2 38.8 17.8
YWSO % 9.7 24.0 17.8
YCHAR % 20.7 14.1 17.5
Figure 3: Molecular weight distribution of the oily phase for different methanol concentration,
according to GPC analysis
A qualitative analysis of the aqueous phase for
Experiments B and C was carried out to identify
the composition. The results showed the same
class of compounds as in tests A, D and E
(phenols, anisoles, cresols, guaiacols and other
monomers and dimers).
The overall yield balance, Table 4, gave an
acceptable discrepancy of ±2.6% for Experiment
A, which is an accurate balance taking into
account errors related to characterization methods
and losses in the process. However, Experiments
D and E have high errors (more than ±20%),
which probably are mainly due to the oily phase
nature in those tests, which was partly in solid
form. Consequently, it was concluded that more
oil in the solid phase was accumulated in the
reactor system. It should also be noted that the
catalyst used in Experiment E has another
supplier than the other experiments. Tests have
been carried out under equal conditions for the
two catalysts and so far no indication of
differences has been observed. The highest oil
yield was observed for non-methanol
experiments. In addition the oil and water soluble
organics yield were calculated on a phenol free-
product basis.
A GPC analysis (see Figure 3) shows that the
oily phase of Experiment E (61% methanol) has a
higher average molecular weight than that of
Experiment D (39% methanol). Since the average
molecular weight of the lignin used is about 3900
Da (which corresponds to about 40 phenolic
units), it can be concluded from the results in
Figure 3 that all large lignin molecules have been
depolymerized. Furthermore, the results presented
in this Figure show that the major part of the
molecules in Experiment D have a size
corresponding to 1 to 5 phenolic units and the
corresponding numbers for Experiment E are 1 to
10 units.
6. TALLAL BELKHEIRI et al.
818
CONCLUSION
Lignin depolymerisation in this study showed
an optimum point for char suppression, when both
methanol and phenol were used. Nevertheless, the
highest oil yield (72.2%) was obtained in a non-
methanol test. Water soluble organics, such as
monomers and dimers, represented about 24% in
terms of the highest yield in the experiment with
the methanol-phenol mixture. It was concluded
that methanol as co-solvent improved char
suppression moderately. However, it had a
negative effect on oil yield when used in a high
amount. On the other hand, phenol improved the
oil yield.
ACKNOWLEDGEMENTS: This work is
supported by grants from Chalmers Energy
Initiative-Ligno Fuel Project, Valmet Power AB,
Swedish Energy Agency. We thank Bengt
Erichsen for his technical contribution in this
work.
REFERENCES
1
C. Zhao and J. A. Lercher, in "The Role of
Catalysis for the Sustainable Production of Bio-fuels
and Bio-chemicals", edited by K. S. Triantafyllidis, A.
A. Lappas, and M. Stöcker, 2013, p. 289-320.
2
A. T. Gosselink, Ph.D. Thesis, Wageningen
University, 2011, p. 196.
3
P. Tomani, Cellulose Chem. Technol., 44, 53
(2010).
4
P. Azadi, O. R. Inderwildi, R. Farnood and D. A.
King, Renew. Sust. Ener. Rev.,. 21, 506 (2013).
5
J. E. Holladay, J. F. White, J. J. Bozell and D.
Johnson, PNNL report no 16983, 2007, pp. 30-40.
6
H. Pińkowska, P. Wolak, and A. Złocińska, Chem.
Eng. J., 187, 410 (2012).
7
T. L. K. Yong and Y. Matsumura, Ind. Eng. Chem.
Res., 51, 11975 (2012).
8
N. Akiya and P. E. Savage, Chem. Rev., 102, 2725
(2002).
9
J.-M. Lavoie, W. Baré, and M. Bilodeau,
Bioresource Technol., 102, 4917 (2011).
10
J. E. Miller, L. Evans, J. E. Mudd and K. A.
Brown, SAND report no1318, 2002, pp. 1-49.
11
M. V. Olarte, Ph.D. Thesis, Georgia Tech., 2011, p.
232.
12
R. P. Nielsen, G. Olofsson, and E. G. Søgaard,
Biomass Bioenerg., 39, 399 (2012).
13
T. D. H. Nguyen, M. Maschietti, T. Belkheiri, L.-E.
Åmand, H. Theliander et al., J. Supercrit. Fluid., 86,
67 (2014).
14
Y. Xiang, X. Li, C. Lu, L. Ma and Q. Zhang, Appl.
Catal. A, 375, 289 (2010).
15
A. Toledano, L. Serrano and J. Labidi, Fuel, 116,
617 (2014).
16
E. W. Lemmon, M. L. Huber, M. O. McLinden,
NIST Standard Reference Database 23: Version 9.0.
NIST, Gaithersburg, 2010.