Download to read offline
![International Journal of Engineering Research and Development
e-ISSN: 2278-067X, p-ISSN: 2278-800X, www.ijerd.com
Volume 10, Issue 1 (February 2014), PP. 27-31
27
Context-Based Image Segmentation of Radiography
W. Al-Hameed1
, P.D.Picton2
, Y.Al-Mayali3
1
Computer Science, University of Babylon, Iraq
2
School of Science & Technology, The University of Northampton, United Kingdom
3
Faculty of mathematics & Computer Science, University of Kufa, Iraq.
Abstract:- In radiographic images, many researchers have used conventional image processing techniques to
detect and segment any defects, which could include cracks, porosity or inclusions. Usually, these methods do
not take into account the contextual knowledge that is used by the experienced radiographer, and instead use
standard image processing techniques. In this research, knowledge about the defects and the images are used to
develop a much simpler image processing technique.
I. INTRODUCTION
One of the major areas of non-destructive testing is the inspection of welds, particularly in areas such
as the oil and gas industry where pipelines contain thousands of welds. The inspection can take many forms,
such as ultrasonic inspection, the use of eddy-current probes, and radiography, which could be x-ray or gamma
ray. In the the case of radiography, the data that is produced is in the form of images, and the role of the NDT
technician is to inspect the images (on film or digitally) to detect the existence of any flaws, and to assess their
size. The ability of humans to detect the defects may be effectedbythelighting, or duetoalow levelexpertise
whichcangive different interpretations ofthe same defect In an attempt to automate the process, previous
research [1-5]has used a variety of image processing techniques, some of which rely on statistical data to find
local thresholds. Theseimage processing methods have been developed to work on general purpose images, and
do not take into account the specific knowledge that an experienced operator would know when analysisng
images from radiography.
II. DEFECTS IN WELDS
The sort of defects that can be found in welds consist of cracks, trapped bubbles, cavities, and
inclusions. Figure 1 shows some typical examples. Typically the aim of a radiograph is to get a good even
contrast, so that defects that are large enough to be of concern will show up, usually as darker regions in the
image. Since much of the image will not contain any defects, it is wasteful to have to apply complex image
processing algorithms to the whole image. Therefore, a typical approach to this problem is to carry out a number
of stages.
Elongated cavity - large, non-
spherical cavity with its major
dimension approximately
parallel to the axis of the weld
Burn-Through - produced by
the excessive heat of the weld
metal when penetration welding
zone which leads to the
emergence of areas burned in the
form of dark spots](https://image.slidesharecdn.com/f1012731-140322025733-phpapp02/85/International-Journal-of-Engineering-Research-and-Development-1-320.jpg)
![International Journal of Engineering Research and Development
e-ISSN: 2278-067X, p-ISSN: 2278-800X, www.ijerd.com
Volume 10, Issue 1 (February 2014), PP. 27-31
27
Context-Based Image Segmentation of Radiography
W. Al-Hameed1
, P.D.Picton2
, Y.Al-Mayali3
1
Computer Science, University of Babylon, Iraq
2
School of Science & Technology, The University of Northampton, United Kingdom
3
Faculty of mathematics & Computer Science, University of Kufa, Iraq.
Abstract:- In radiographic images, many researchers have used conventional image processing techniques to
detect and segment any defects, which could include cracks, porosity or inclusions. Usually, these methods do
not take into account the contextual knowledge that is used by the experienced radiographer, and instead use
standard image processing techniques. In this research, knowledge about the defects and the images are used to
develop a much simpler image processing technique.
I. INTRODUCTION
One of the major areas of non-destructive testing is the inspection of welds, particularly in areas such
as the oil and gas industry where pipelines contain thousands of welds. The inspection can take many forms,
such as ultrasonic inspection, the use of eddy-current probes, and radiography, which could be x-ray or gamma
ray. In the the case of radiography, the data that is produced is in the form of images, and the role of the NDT
technician is to inspect the images (on film or digitally) to detect the existence of any flaws, and to assess their
size. The ability of humans to detect the defects may be effectedbythelighting, or duetoalow levelexpertise
whichcangive different interpretations ofthe same defect In an attempt to automate the process, previous
research [1-5]has used a variety of image processing techniques, some of which rely on statistical data to find
local thresholds. Theseimage processing methods have been developed to work on general purpose images, and
do not take into account the specific knowledge that an experienced operator would know when analysisng
images from radiography.
II. DEFECTS IN WELDS
The sort of defects that can be found in welds consist of cracks, trapped bubbles, cavities, and
inclusions. Figure 1 shows some typical examples. Typically the aim of a radiograph is to get a good even
contrast, so that defects that are large enough to be of concern will show up, usually as darker regions in the
image. Since much of the image will not contain any defects, it is wasteful to have to apply complex image
processing algorithms to the whole image. Therefore, a typical approach to this problem is to carry out a number
of stages.
Elongated cavity - large, non-
spherical cavity with its major
dimension approximately
parallel to the axis of the weld
Burn-Through - produced by
the excessive heat of the weld
metal when penetration welding
zone which leads to the
emergence of areas burned in the
form of dark spots](https://image.slidesharecdn.com/f1012731-140322025733-phpapp02/75/International-Journal-of-Engineering-Research-and-Development-1-2048.jpg)
![Context-Based Image Segmentation of Radiography
28
Longitudinal crack - crack
essentially parallel to the axis of
the weld
Slag inclusions - nonmetallic
solid material entrapped in weld
metal or between weld and base
metal.
Fig. 1. Examples of flaws in welds and their radiographs.
The first stage would be to quickly scan the image to find if there any areas that contain potential flaws.
This would define “regions of interest” in which a flaw may exist. The second stage would be to isolatethe flaw,
and to identify all of the pixels that make up the image of a flaw. The third stage is usually feature extraction in
which certain parameters of the flaw are extracted, in preparation for the final stage which is the identification
and possibly measurement of the flaw. This paper is concerned with Stage 2 which is the identification of the
pixels that belong to the image of the flaw.
III. METHODOLOGY
Previous research by the authors has shown that one way of detecting regions of interest in a
radiographic image is by edge detection, using a Sobel or Canny edge detector [6]. Regions in which rapid
changes in intensity occur will be identified as regions of interest, and an area around that region defined. That
is the starting point for the work reported in this paper.
The aim in Stage 2 is to identify all, or as many, of the pixels that belong to the flaw. As already
mentioned, any flaws in an image tend to be darker than the rest of the image. The first assumption
wouldtherefore be that a simple threshold would easily detect the flaw. The issue here is that of choosing the
appropriate value of the threshold.
One option is to find a value of the threshold based on global information i.e. statistical information
about the whole image. However, it is often the case that there is somelocal variation in the gray levels of the
image because, for example, the image is of a pipe, in which casethe object being tested curves away from the
source of radiation, and is therefore darker at the edges. A threshold that is therefore able to pick out the flaw in
one part of the image may also then pick out areas in other parts of the image where there are no flaws.
In this work use is made of the contect of the image, knowing that there is a difference in the statistical
variation in the horizontal direction and in the vertical direction. Because of the way that these images are taken,
there tends to be a farly constant gray level value in the horizontal direction, and a gradient from dark to light
andthen dark again in the vertical direction. Over the whole image there will be a statistical variation due to
noise, which is assumed to be Gaussian and that this level of noise does not vary across the image.
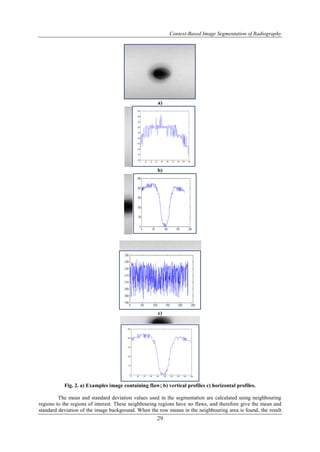
This is illustrated in Figure 2a), where an image containing a flaw is shown. Figure 2b) shows two
vertical cross sections, the first through part of the image where there is no flaw, and the second through part of
the image containing the flaw. In the first it is fairly clear that the profile is a curve which has a low value at
each end, and a maximum in the middle. Finally Figure 2c) shows horizontal profiles, firstly through part of the
image where there is no flaw and secondly through the flaw. In the first it can be seen that the gray level is farly
constant (around 215) and that there is Gaussian noise. In the second profile the significant dip can be seen
where the profile passes through the flaw.
IV. STATISTICAL THRESHOLD
Assuming that the noise throughout the image is Gaussian, then the distribution of the pixels would be
expected to be a normal distribution, centred on a mean value and with 95% of the gray levels falling within ±2
standard deviationsof the mean. Therefore, if the threshold is set to 2 x standard deviation below the mean, the
flaw should be segmented, plus a small number of individual pixels.](https://image.slidesharecdn.com/f1012731-140322025733-phpapp02/85/International-Journal-of-Engineering-Research-and-Development-2-320.jpg)
![Context-Based Image Segmentation of Radiography
30
is a similar profile to Figure 2b). Then, if a pixel value is less than 2 times the standard deviation below the
mean value of the row, it is catagorized as belonging to the flaw.
V. RESULTS
Previous research [1-5] has generally used far more complex image processing methods. Although
these methods produce good results for many of the flaws, they generally are poor at detecting fine cracks.
Figure 3 shows the results obtained using the method described in this paper. The first image shows that the
method is good at detecting some of the easier flaws such as porosity. The second example shows how
successful the method is at detecting the more difficult case of fine cracks. One additional feature was added,
which was to remove any pixel which was classified as flaw, but which was an isolated pixel i.e. none of its
eight neighbouring pixels were classified as flaws.
a)
b)
Fig. 3. a) Examples image containing a porosity; b)fine vertical cracks
It can be seen that the flaws were well segmented and no other pixels were wrongly classified.
VI. CONCLUSIONS
The main approach to identifying the pixels belonging to the image of a flaw is to use some form of
thresholding. The selection of an appropriate threshold is problematic. In this poaper the approch has been to use
the knowledge of the nature of radiographs to use a threshold based on the mean of the row of pixels, and the
overall standard deviation. This has proven to be very successful, despite its simplicity, and is therefore a
significant step in the direction of automating defect classification in weld radiography.
VII. FUTURE WORK
Having successfully segmented the flaw from the rest of the image, the next step is feature extraction
and then classification. In order to achieve a good classification it is imperative that the segmentation contains
as much of the flaw as possible, and that pixels wrongly attributed to the flaw are minimised. The algorithm
presented in this paper appears to achieve this and has been successfully applied to a range of radiographic
images. The features extracted are statistical, and include averages, moments, aspect ratios etc [7]. Once
extracted the features are then fed into a linear support vector machine (LSVM) [8,9] for training and then](https://image.slidesharecdn.com/f1012731-140322025733-phpapp02/85/International-Journal-of-Engineering-Research-and-Development-4-320.jpg)
![Context-Based Image Segmentation of Radiography
31
testing. So far, the success rate in classification has been as high as 82% correct. However, the aim of this
research is to achieve over 90% correct classification, so there is still more work to be done.
REFERENCES
[1] W. Al-Hameed, Y. Mayali, P. Picton, “Segmentation of Radiographic mages of Weld Defects”, Journal
of Global Research in Computer Science, 4, 7, pp. 1-4, July 2013.
[2] X. Wang and B.S. Wong ,'Radiographic Image Segmentationfor Weld Inspection Usinga Robust
Algorithm', Research in Nondestructive Evaluation, 16, 3, pp. 131–142, 2005
[3] R. Silva and D. Mery, “State-of-the-art of weld seam inspection using X-ray testing: Part I –Image
Processing”, Materials Evaluation, Vol. 65, No. 6, pp. 643–647, 2007.
[4] R. Silva and D. Mery. “State-of-the-art of weld seam inspection using X-ray testing: Part II - Pattern
Recognition”, Materials Evaluation, Vol. 65, No. 9, p. 833–838, 2007.
[5] N. Nacereddine, M. Zelmat, S.S. Belaïfaand,M. Tridi, “Weld defect detection in industrial radiography
based digital image processing", Proc. 3rd International Conference: Sciences of Electronic,
Technologies of Information and Telecommunications, Tunisia, March 27-31, 2005.
[6] S.S. Al-Amri,N.V. Kalyankar and S.D. Khamitkar, “Image Segmentation by Using Edge Detection",
International Journal on Computer Science and Engineering, Vol. 2, No. 3, 2010, pp. 804-807
[7] I. Valavanis, D. Kosmopoulos, “Multiclass defect detection and classification in weld radiographic
images using geometric and texture features”, Expert Systems with Applications, 37, 2010, pp. 7606-
7614
[8] T.Y. Lim, M.M. Ratnam and M.A. Khalid, “Automatic classification of weld defects using simulated
data and an MLP neural network”, Insight, Vol. 49, No. 3, March 2007
[9] X. Wang, S. Wong and C.S. Tan, “Recognition of Welding Defects in Radiographic Images by Using
Support Vector Machine Classifier", Research Journal of Applied Sciences, Engineering and
Technology 2, 3,pp. 295-301, 2010](https://image.slidesharecdn.com/f1012731-140322025733-phpapp02/85/International-Journal-of-Engineering-Research-and-Development-5-320.jpg)

This document summarizes a study on context-based image segmentation of radiography images to detect defects in welds. The researchers developed a simple image processing technique that uses contextual knowledge about radiography images rather than standard techniques. They first identify regions of interest using edge detection. They then segment potential flaws from the image using a statistical threshold based on the mean and standard deviation of pixel values in neighboring regions, rather than global thresholding. They show their technique successfully segments flaws like porosity and fine cracks from test images. Future work will involve extracting features of segmented flaws and using machine learning for classification.