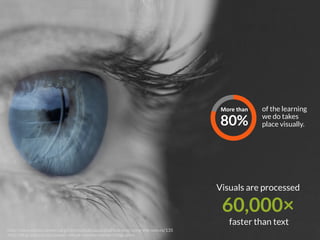
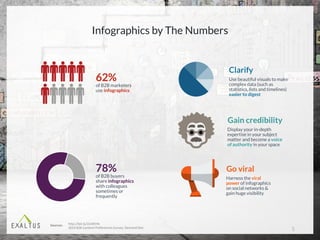
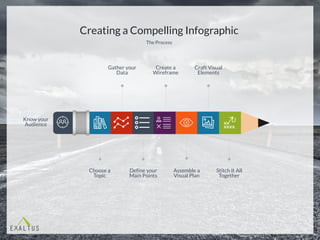
Infographic Design
INFOGRAPHIC
DESIGN SERVICES
Exaltus.ca
WHY PRODUCE INFOGRAPHICS?
People remember
only
20%
of what they read.
http://blog.wyzowl.com/power-visual-communication-infographic
2
WHY PRODUCE
INFOGRAPHICS ?
of the learning
we do takes
place visually.
Visuals are processed
60,000×
faster than text
http://www.familyconnect.org/info/multidiscapacidad/learning/using-the-senses/135
http://blog.wyzowl.com/power-visual-communication-infographic
More	than
80%
Infographics by The Numbers
4
62%
of B2B marketers
use infographics
78%
of B2B buyers
share infographics
with colleagues
sometimes or
frequently
Gain credibility
Display your in-depth
expertise in your subject
matter and become a voice
of authority in your space
Clarify
Use beautiful visuals to make
complex data (such as
statistics, lists and timelines)
easier to digest
Go viral
Harness the viral
power of infographics
on social networks &
gain huge visibility
http://bit.ly/2icWEHk
2014	B2B	Content	Preferences	Survey,	Demand	Gen
Sources:
5
7
Creating a Compelling Infographic
The Process
Know your
Audience
Choose a
Topic
Gather your
Data
Define your
Main Points
Create a
Wireframe
Assemble a
Visual Plan
Craft Visual
Elements
Stitch It All
Together
Make key decisions based on your audience.
KNOW YOUR AUDIENCE
The Right
Topic
The Right Amount
of Data
The Right Level of
Complexity
The Right
Look & Feel
Choose a Topic
10
Valuable &
interesting to
your audience
Not already
widely
available
Showcases
what makes
you special
Your sweet spot
Create a Storyline or Wireframe
• Organize the flow of the
infographic into a clear storyline.
• If your story isn’t flowing quite
right, reorganize.
• Fill any gaps with additional data
points, examples or anecdotes that
bolster your thesis. Try to answer
the five key questions of Where,
What, Who, When, and How.
• Add rough renderings of charts,
graphs, and other data
visualization.
11
• Key	point
• Key	pointTitle
• Key	point
• Key	pointTitle
• Key	point
• Key	pointTitle
Craft a plan that works with both your content and your style guidelines
Create a Visual Plan
12
Typography
Colors
Image Style
Gather Visual Elements
• Preserve a consistent visual style
throughout your infographic
• Ensure consistency by creating original
images or finding free icons at these
sites.
13
Stitching it All Together
• Pull everything together with snappy
headlines and descriptive text.
• Use tools such as:
• Canva
• Piktochart
• Visual.ly
• Easel.ly
• Adobe Illustrator
• Adobe Photoshop
14
INFOGRAPHICS
LOBBY
MORE INFOGRAPHICS
Visit exaltus.ca/contact

Exaltus infographic design services

  • 1.
  • 2.
    WHY PRODUCE INFOGRAPHICS? Peopleremember only 20% of what they read. http://blog.wyzowl.com/power-visual-communication-infographic 2
  • 3.
    WHY PRODUCE INFOGRAPHICS ? ofthe learning we do takes place visually. Visuals are processed 60,000× faster than text http://www.familyconnect.org/info/multidiscapacidad/learning/using-the-senses/135 http://blog.wyzowl.com/power-visual-communication-infographic More than 80%
  • 4.
    Infographics by TheNumbers 4 62% of B2B marketers use infographics 78% of B2B buyers share infographics with colleagues sometimes or frequently Gain credibility Display your in-depth expertise in your subject matter and become a voice of authority in your space Clarify Use beautiful visuals to make complex data (such as statistics, lists and timelines) easier to digest Go viral Harness the viral power of infographics on social networks & gain huge visibility http://bit.ly/2icWEHk 2014 B2B Content Preferences Survey, Demand Gen Sources:
  • 5.
  • 7.
  • 8.
    Creating a CompellingInfographic The Process Know your Audience Choose a Topic Gather your Data Define your Main Points Create a Wireframe Assemble a Visual Plan Craft Visual Elements Stitch It All Together
  • 9.
    Make key decisionsbased on your audience. KNOW YOUR AUDIENCE The Right Topic The Right Amount of Data The Right Level of Complexity The Right Look & Feel
  • 10.
    Choose a Topic 10 Valuable& interesting to your audience Not already widely available Showcases what makes you special Your sweet spot
  • 11.
    Create a Storylineor Wireframe • Organize the flow of the infographic into a clear storyline. • If your story isn’t flowing quite right, reorganize. • Fill any gaps with additional data points, examples or anecdotes that bolster your thesis. Try to answer the five key questions of Where, What, Who, When, and How. • Add rough renderings of charts, graphs, and other data visualization. 11 • Key point • Key pointTitle • Key point • Key pointTitle • Key point • Key pointTitle
  • 12.
    Craft a planthat works with both your content and your style guidelines Create a Visual Plan 12 Typography Colors Image Style
  • 13.
    Gather Visual Elements •Preserve a consistent visual style throughout your infographic • Ensure consistency by creating original images or finding free icons at these sites. 13
  • 14.
    Stitching it AllTogether • Pull everything together with snappy headlines and descriptive text. • Use tools such as: • Canva • Piktochart • Visual.ly • Easel.ly • Adobe Illustrator • Adobe Photoshop 14
  • 15.
  • 16.

Editor's Notes

  • #2 Hi everyone, Thank you so much for giving me your time today. My name is Carole Alalouf and I am the founder and President of Exaltus. I’m going to try to keep it short and sweet for you. I find that generally the best thing I can do for people to see the value of my Slide Wizard tool is to let them see it in action. So I am going to show you how I use the tool for my own needs. Just before I start, I’d like to just get a bit of an idea of who I am talking to. So I’m just going to throw out a few questions: Are there people on the call who are in Sales? Are there people on the call who are in Marketing and Research? In your company, who produces the master decks? Who customizes them? Great. So let’s begin.