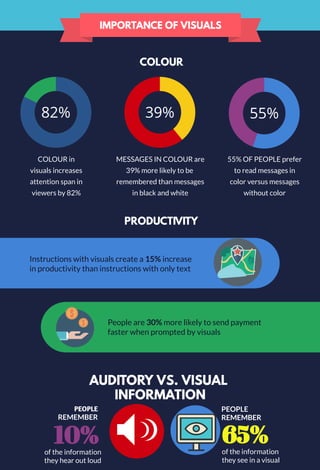
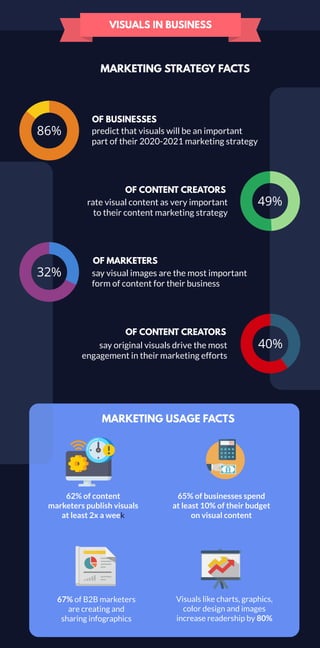
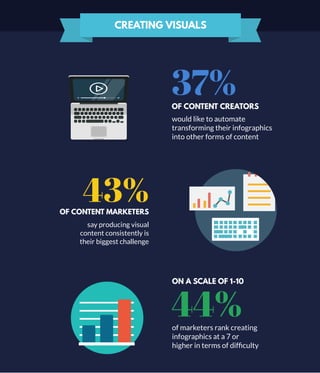
18INFOGRAPHIC
STATISTICS
TO TAKE INTO ACCOUNT FOR 2020-2021
IMPORTANCE OF VISUALS
82%
COLOUR in
visuals increases
attention span in
viewers by 82%
39%
MESSAGES IN COLOUR are
39% more likely to be
remembered than messages
in black and white
55%
55% OF PEOPLE prefer
to read messages in
color versus messages
without color
COLOUR
Instructions with visuals create a 15% increase
in productivity than instructions with only text
People are 30% more likely to send payment
faster when prompted by visuals
PEOPLE
REMEMBER
PRODUCTIVITY
AUDITORY VS. VISUAL
INFORMATION
10%of the information
they hear out loud
PEOPLE
REMEMBER
65%of the information
they see in a visual
VISUALS IN BUSINESS
86% predict that visuals will be an important
part of their 2020-2021 marketing strategy
49%rate visual content as very important
to their content marketing strategy
32% say visual images are the most important
form of content for their business
40%say original visuals drive the most
engagement in their marketing efforts
62% of content
marketers publish visuals
at least 2x a week
67% of B2B marketers
are creating and
sharing infographics
65% of businesses spend
at least 10% of their budget
on visual content
Visuals like charts, graphics,
color design and images
increase readership by 80%
MARKETING STRATEGY FACTS
MARKETING USAGE FACTS
OF BUSINESSES
OF CONTENT CREATORS
OF MARKETERS
OF CONTENT CREATORS
CREATING VISUALS
37%OF CONTENT CREATORS
would like to automate
transforming their infographics
into other forms of content
43%OF CONTENT MARKETERS
say producing visual
content consistently is
their biggest challenge
44%
ON A SCALE OF 1-10
of marketers rank creating
infographics at a 7 or
higher in terms of difficulty
1. https://www.researchgate.net/publication/339150528_Effects_of_Colors_on_Cognition_and_Emotions_in_Learning
2. https://www.researchgate.net/publication/338955831_Search_superiority_Goal-
directed_attentional_allocation_creates_more_reliable_incidental_identity_and_location_memory_than_explicit_encoding_in_naturalistic_virtual_environments
3. https://www.researchgate.net/publication/340892200_The_Effectiveness_of_Mandala_Colouring_Therapy_in_Increasing_Year_3_Pupils'_Focus_during_the_Init
ial_Lesson
4. https://www.researchgate.net/publication/256190067_The_Influence_of_Colour_on_Memory_Performance_A_Review
5. https://www.office.xerox.com/latest/XOGFL-19U.pdf
6. https://www.researchgate.net/publication/336982208_Patient_preferences_for_visualization_of_longitudinal_patient-reported_outcomes_data
7. https://readwrite.com/2019/01/11/the-business-benefits-of-visualizing-your-
data/#:~:text=Visualization%20Increases%20Productivity,have%20eyes%20on%20that%20information.
8. https://www-sciencedirect-com.ezaccess.libraries.psu.edu/science/article/pii/S0738399119301715?via%3Dihub#tbl0005
9. https://www.rochester.edu/pr/Review/V74N4/0402_brainscience.html
10. https://www.researchgate.net/publication/331249556_Visualizing_the_terror_threat_The_impact_of_communicating_security_information_to_the_general_pub
lic_using_infographics_and_motion_graphics
11. https://www.researchgate.net/publication/342009058_The_use_of_eye-
tracking_technology_to_identify_visualisers_and_verbalisers_accuracy_and_contributing_factors
12. https://www.socialmediatoday.com/news/14-visual-content-stats-to-guide-your-marketing-strategy-in-2020-infograph/575495/
SOURCES:
Created by Lyzi G Cota
LIONS GROUP GLOBAL
Marketing

Digital content statistics

  • 1.
  • 2.
    IMPORTANCE OF VISUALS 82% COLOURin visuals increases attention span in viewers by 82% 39% MESSAGES IN COLOUR are 39% more likely to be remembered than messages in black and white 55% 55% OF PEOPLE prefer to read messages in color versus messages without color COLOUR Instructions with visuals create a 15% increase in productivity than instructions with only text People are 30% more likely to send payment faster when prompted by visuals PEOPLE REMEMBER PRODUCTIVITY AUDITORY VS. VISUAL INFORMATION 10%of the information they hear out loud PEOPLE REMEMBER 65%of the information they see in a visual
  • 3.
    VISUALS IN BUSINESS 86%predict that visuals will be an important part of their 2020-2021 marketing strategy 49%rate visual content as very important to their content marketing strategy 32% say visual images are the most important form of content for their business 40%say original visuals drive the most engagement in their marketing efforts 62% of content marketers publish visuals at least 2x a week 67% of B2B marketers are creating and sharing infographics 65% of businesses spend at least 10% of their budget on visual content Visuals like charts, graphics, color design and images increase readership by 80% MARKETING STRATEGY FACTS MARKETING USAGE FACTS OF BUSINESSES OF CONTENT CREATORS OF MARKETERS OF CONTENT CREATORS
  • 4.
    CREATING VISUALS 37%OF CONTENTCREATORS would like to automate transforming their infographics into other forms of content 43%OF CONTENT MARKETERS say producing visual content consistently is their biggest challenge 44% ON A SCALE OF 1-10 of marketers rank creating infographics at a 7 or higher in terms of difficulty
  • 5.
    1. https://www.researchgate.net/publication/339150528_Effects_of_Colors_on_Cognition_and_Emotions_in_Learning 2. https://www.researchgate.net/publication/338955831_Search_superiority_Goal- directed_attentional_allocation_creates_more_reliable_incidental_identity_and_location_memory_than_explicit_encoding_in_naturalistic_virtual_environments 3.https://www.researchgate.net/publication/340892200_The_Effectiveness_of_Mandala_Colouring_Therapy_in_Increasing_Year_3_Pupils'_Focus_during_the_Init ial_Lesson 4. https://www.researchgate.net/publication/256190067_The_Influence_of_Colour_on_Memory_Performance_A_Review 5. https://www.office.xerox.com/latest/XOGFL-19U.pdf 6. https://www.researchgate.net/publication/336982208_Patient_preferences_for_visualization_of_longitudinal_patient-reported_outcomes_data 7. https://readwrite.com/2019/01/11/the-business-benefits-of-visualizing-your- data/#:~:text=Visualization%20Increases%20Productivity,have%20eyes%20on%20that%20information. 8. https://www-sciencedirect-com.ezaccess.libraries.psu.edu/science/article/pii/S0738399119301715?via%3Dihub#tbl0005 9. https://www.rochester.edu/pr/Review/V74N4/0402_brainscience.html 10. https://www.researchgate.net/publication/331249556_Visualizing_the_terror_threat_The_impact_of_communicating_security_information_to_the_general_pub lic_using_infographics_and_motion_graphics 11. https://www.researchgate.net/publication/342009058_The_use_of_eye- tracking_technology_to_identify_visualisers_and_verbalisers_accuracy_and_contributing_factors 12. https://www.socialmediatoday.com/news/14-visual-content-stats-to-guide-your-marketing-strategy-in-2020-infograph/575495/ SOURCES:
  • 6.
    Created by LyziG Cota LIONS GROUP GLOBAL Marketing