Designing infographics
•Download as PPTX, PDF•
0 likes•175 views

Workshop at International Design in Government Conference http://international.gov-design.com/ License: CC Attribution-NonCommercial-NoDerivs License
Report
Share
Report
Share

Recommended
Jane Minto and Tom Stewart, Chatbots aren't just for millenials
1) The document discusses the development of a chatbot for Age UK to increase engagement with older users. User testing found the chatbot helped 44% of users and 32% had repeat interactions.
2) The chatbot was designed over 20 days by exploring trends, mapping conversations, and testing with users. It aims to diagnose needs, surface information, and signpost users to other resources.
3) Interviews with older users found the chatbot could help when access to websites is difficult and allow discreet help from family members. This suggests chatbots can effectively engage older audiences not just millennials.
Infographics for the social sector webinar
Does your organization have loads of unused data? Information design can turn that data into understandable visuals, giving your members the right information to make choices or learn something new about your industry. Be better positioned to tell your story by learning how to make your infographics clear, compelling, and convincing. Learn how infographics can boost your website’s SEO and can aid in user engagement in this free webinar.
Accessibility vs Design
A discussion on web and software design vs accessibility.
This was originally presented in early 2014.
Why most presentations fail
Susan Joy Schleef of Presentations With Results, Inc. explains 3 reasons why most presentations fail to achieve the intended results, including neuromarketing principles to make your presentations more successful. Please add a comment and share this presentation with friends. Thank you!
Between Paper & Code
An introductory workshop on UX design, taught to design thinking students at the Hasso-Plattner-Institut School of Design Thinking in Potsdam, Germany.
Companion website: http://paperandcode.weebly.com
Software used in the workshop: Sketch, Invision
How to Present Results to Get Results
Presented by Lea Synefakis-Pica for Analytics That Excite 2014
Even the most seasoned analyst can make very simple changes to a presentations to make a big impact. If everyone in your audience is catching up on email or sleep, chances are your presentation design and/or data charts are obscuring your valuable insights and hurting you rather than helping you. Lea can help you inspire action and build credibility with a fresh new toolbox of tips and techniques to set your presentations apart and get the results you’re looking for.
Programming ideas
This document provides programming and activity ideas for makerspaces, including ideas for robotics, circuits, 3D printing, and virtual/augmented reality. It also discusses tips for organizing, marketing, planning, and surveying makerspaces. Some key programming ideas mentioned are robot obstacle courses, story-based circuit design, 3D printing community projects, and hosting hackathons or startup weekends. The document emphasizes that makerspaces should provide a safe space for failure and experimentation to spark interest in fields like engineering.
Emerging Platforms in Interactive Storytelling
Watched the recorded webinar at: http://www.fusionspark.com/lp/platforms-interactive-storytelling-ondemandreg/
In this discussion, FusionSpark media will explore with the founders of SpinRiot and The Documentary Summit the brief history of interactive content, the accelerated movement and key drivers towards interactive engagement with audiences, and, through emerging interactive platforms how storytellers can quickly create and publish their own original interactive storylines. We will then demonstrate a new platform that requires little to no technical training to get you up and running in no time.
Separating Myth from Truth in Data Visualisation
This document outlines an agenda for a one-day workshop on data visualization and infographic design. The workshop aims to challenge existing thinking about creating and consuming visualizations, equip attendees with an appreciation of analytical and design choices, provide practice opportunities, and inspire attendees. The agenda covers fundamentals, the design methodology, data representation types, color theory, interactivity, and tools. Exercises are integrated throughout. The trainer, Andy Kirk, has extensive experience delivering visualization training globally.
Insights - Cristobal South Code.pdf
If you can understand the deepest concerns of your customers, you can certainly find an underserved niche to compete with any giant in your industry.
Discover how to find deep imaginative truths about motivations & behaviors with business value.
Understand several sources of Insights with examples from different industries.
Finding insights is a continuous process, especially in the digital world. In the industrial world, decisions are hard to change once they've been made, but in the software world, we can change as many times as necessary.
Furthermore, once we have built the habit of seeking insights into our culture, we will begin to see them everywhere.
Visual Explanations
This document discusses effective visual displays of information. It provides examples of different types of visuals like photographs, drawings, diagrams and charts. It emphasizes that visuals can communicate complex ideas efficiently by conveying the most information in a small space. The document outlines principles of effective visual design from scholars like Tufte, including using graphics to present text and numbers as visual ideas. It also discusses the concept of multimodality, using different modes like images, text and audio together. Learners are given tasks to analyze visual displays and create their own, and readings are suggested for further exploring visual communication and semiotics.
Foundations of IA
Held in conjunction with World IA Day 2018, this practical session was an introduction to the core skills and methods of thinking that you will use as part of your day to day work in IA.
Topics covered include the foundations of IA, the importance of a ‘content first’ approach, thinking like a user and how to present your work to clients.
The session was led by Jon Fisher, Head of UX at Nomensa, an award-winning UX design agency based in London, Bristol and Amsterdam.
Foundations of IA - World IA Day
Held in conjunction with World IA Day 2018, this practical session was an introduction to the core skills and methods of thinking that you can use as part of your day to day work in IA.
Topics covered included the foundations of IA, the importance of a ‘content first’ approach, thinking like a user and how to present your work to clients.
The session was led by Jon Fisher, Head of UX at Nomensa, an award-winning UX design agency based in London, Bristol and Amsterdam.
This is a free event recommended for those new to IA or looking for a refresher on fundamentals.
Following the event, Nomensa will be providing pizza and beers for delegates to enjoy and continue networking.
If you register, but are unable to attend, please give us 48 hours notice so we can reallocate your place.
Touchpoint 2012 Symposium on Interaction Design: Notes
The document summarizes notes from a TouchPoint2012 Symposium on interaction design. Theme One discusses the necessary future of interaction design and panels say know the limits of your intellectual leash, trust your intuition, and being curious as a designer involves trust-building with clients. Theme Two discusses the interaction design experience, with speakers from Adobe, frog, LVL Studio, Habanero, SAP, and Crispin Porter + Bogusky talking about topics like user experience optimization, contextual design, and evaluating interaction designers. Panels recommend focusing on strengths, versatility and creative spirit, using data to support ideas, and addressing how companies view failure.
UI/UX Designer in the year 2020 | Developers Day Nov.19
What it's like to be a designer in the current year, what difficulties we all face and what soft skills everyone should invest in the following years so that they become future-proof in their discipline.
Design Method for Visualizing Complex Data for Users
Social math provides a method for designers to make complex numerical data about an important cause both meaningful and understandable to your audience. Social math is a design process of telling a story with data that will motivate your users to engage in the behavior you intend.
This half-day course is appropriate for all levels of experience. The lessons focus on introducing the concept of social math and detailing a method to design using social math. Design activities provide an opportunity for attendees to practice using the method.
Attendees will learn:
How to define and identify social math
Why social math is an important part of an impactful design
When to incorporate social math into the design process
Where to find reliable data for designing with social math
A method for incorporating social math into their design
What additional resources exist for using social math
Natt Phenjati's Portfolio
This document provides details about Natt Phenjati's educational and professional background, skills, and sample works. It includes information about his Bachelor's degree from Rensselaer Polytechnic Institute in Electronic Media, Arts and Communication and his Master's degree from Domus Academy in Interaction Design. Various design and development projects are summarized, including ReadMe, Vitro, Mito Flip book, and systems designed for education in Thailand. Skills mentioned include design research, prototyping, interface design, and more.
Development slam 2017
These are the slides for a design thinking overview I gave to newly-onboarded developers at IBM. This is part of a larger session kicking off a six-month project where attendees will deliver user research, a set of hills and a prototype to key stakeholders looking for solutions to real problems. I used the example of helping Austin housing authorities fix the affordable housing problem that faces low-income families.
Introduction to User Experience Design
This document provides an introduction to user experience design. It defines user experience as encompassing all aspects of a user's interaction with a company, service, or product. It describes the role of a user experience designer as involving user research, content creation, coding, user interface design, and competitive analysis. The document outlines techniques for user experience research like usability testing, guerrilla research, and competitive analysis. It discusses how to create personas and problem statements to understand users and design problems. Finally, it provides an activity using a persona and problem statement to demonstrate how to apply this knowledge to design decisions.
Design Thinking & Lean UX
This document discusses design thinking and lean UX processes. It begins by defining design thinking as a human-centered approach to problem solving that helps organizations become more innovative. It then outlines some key aspects of design thinking like being empathetic, iterative, and daring. The document discusses how design thinking involves gaining insights into user needs and then testing solutions through quick iterations. It introduces lean UX as building the smallest viable product and getting frequent user feedback to learn what works and what doesn't. The overall process involves understanding user needs, generating ideas, rapidly prototyping solutions, and learning through testing with users.
Design Thinking and Lean UX
From insight to idea, to implementation.
Design Thinking helps us create value-driven innovation.
Lean UX secures success through testing and iterations.
These key ingredients make up a winning combination.
Lillian Ayla Ersoy, BEKK
[CXL Live 16] How To Present Your Testing Results to Get Results by Lea Pica
Are your executives and clients falling asleep during your testing presentations? Chances are your slide design and data visualizations are obscuring your valuable insights. With her special blend of neuroscience-based visualization principles, practical hands-on design techniques, and entertaining “tough love”, Lea will equip you with a fresh new toolbox that will get you and your data presentations remembered and acted upon.
Introduction to Ambassadors eTwinning challenges workshop
This document summarizes a workshop on using personas and design thinking to develop strategies for engaging eTwinning participants. The workshop introduces eTwinning personas, has participants brainstorm strategies for engaging different personas, and develops an action plan or "tool kit" of best strategies. Improv activities are used to encourage collaboration. The document provides context on personas, design thinking, and improv techniques to facilitate participation and idea generation.
How to Entertain audiences using data led content - Trend Report Spring 2015
In this seasons trend report, we open the lens to best practice campaigns from across the digital landscape whilst seeking opinions from the data visualisation community on the hot trends coming our way. Campaigns include airbnb, UNESCO, Virgin, IBM, Nike and some exploratory thinking on Tesla. Thought leading opinions from the likes of Alberto Cairo, Georgia Lupi, Andy Kirk.
How To Sell Your UX Vision- UX Scotland 2015
So you have a killer idea and you are ready to sell through your UX vision. You've got various internal and external stakeholders that you need to get on board. They have varying levels of technical savvy and involvement.
In a world of cross-channel experiences, with an ever-growing number of touchpoints, communicating a vision can be a challenge. In this session, we'll cover the key ingredients you'll need to sell a UX vision. We'll examine ways to craft your UX deliverables so that they tell a story in a way that clearly communicates your vision.
In this presentation, you will learn:
- How to define a UX Vision in five steps
- Why it's crucial to consider and be savvy about politics as part of your process
- How to speak the language of your internal and external audiences
- How to make the best use of numbers and metrics to support your strategy
- The magic of structuring a persuasive presentation
- How and why to adjust the fidelity of your deliverables based on the needs and expectations of your audience
- Techniques and tools to make deliverables that are engaging and memorable
User Experience Design: A Primer for Marketers
This document provides an overview of user experience design for marketers. It discusses how design has evolved from focusing on advertising, branding, and product design to also encompass digital experiences through websites, apps, and other interfaces. The value of companies like Uber and Airbnb that don't own assets but provide digital experiences is highlighted. User experience design is explained as an interdisciplinary practice that includes human-computer interaction, information architecture, visual design, and other areas. The design process of empathizing with users, exploring solutions, and executing prototypes is outlined. The importance of user research, prototyping, testing, and iteration is emphasized to create user-centered experiences.
thinkLA AdU: UX 2015 Presentation Slides
This document provides an overview of user experience design for marketers. It discusses how design has evolved from focusing on advertising, branding, and product design to also encompass digital experiences through websites, apps, and other interfaces. The value of companies like Uber and Airbnb that don't own assets but provide digital experiences is highlighted. User experience design is explained as an interdisciplinary practice that includes human-computer interaction, information architecture, visual design, and other areas. The design process of empathizing with users, exploring solutions, and executing prototypes is outlined. The importance of user research, prototyping, testing, and iteration is emphasized to create user-centered experiences.
Teaching visualization: effective communication in visual formats
This document discusses effective strategies for teaching visual literacy. It defines a visually literate person as someone who can interpret visual media, use images effectively to design and communicate, and understand ethical issues related to visuals. It provides examples of visual literacy standards and competencies, such as determining needed visual materials and interpreting meanings from images. Effective practices for presentations using visuals are also outlined, such as using images and words together, limiting one idea per slide, and making slides understandable within three seconds. Sample assignments are proposed to help students develop visual communication skills.
一比一原版布兰登大学毕业证(BU毕业证书)如何办理
学校原件一模一样【微信:6496090】【布兰登大学毕业证(BU毕业证书)成绩单学位证】【微信:6496090】(留信学历认证永久存档查询)采用学校原版纸张、特殊工艺完全按照原版一比一制作(包括:隐形水印,阴影底纹,钢印LOGO烫金烫银,LOGO烫金烫银复合重叠,文字图案浮雕,激光镭射,紫外荧光,温感,复印防伪)行业标杆!精益求精,诚心合作,真诚制作!多年品质 ,按需精细制作,24小时接单,全套进口原装设备,十五年致力于帮助留学生解决难题,业务范围有加拿大、英国、澳洲、韩国、美国、新加坡,新西兰等学历材料,包您满意。
【业务选择办理准则】
一、工作未确定,回国需先给父母、亲戚朋友看下文凭的情况,办理一份就读学校的毕业证【微信:6496090】文凭即可
二、回国进私企、外企、自己做生意的情况,这些单位是不查询毕业证真伪的,而且国内没有渠道去查询国外文凭的真假,也不需要提供真实教育部认证。鉴于此,办理一份毕业证【微信:6496090】即可
三、进国企,银行,事业单位,考公务员等等,这些单位是必需要提供真实教育部认证的,办理教育部认证所需资料众多且烦琐,所有材料您都必须提供原件,我们凭借丰富的经验,快捷的绿色通道帮您快速整合材料,让您少走弯路。
留信网认证的作用:
1:该专业认证可证明留学生真实身份【微信:6496090】
2:同时对留学生所学专业登记给予评定
3:国家专业人才认证中心颁发入库证书
4:这个认证书并且可以归档倒地方
5:凡事获得留信网入网的信息将会逐步更新到个人身份内,将在公安局网内查询个人身份证信息后,同步读取人才网入库信息
6:个人职称评审加20分
7:个人信誉贷款加10分
8:在国家人才网主办的国家网络招聘大会中纳入资料,供国家高端企业选择人才
→ 【关于价格问题(保证一手价格)
我们所定的价格是非常合理的,而且我们现在做得单子大多数都是代理和回头客户介绍的所以一般现在有新的单子 我给客户的都是第一手的代理价格,因为我想坦诚对待大家 不想跟大家在价格方面浪费时间
对于老客户或者被老客户介绍过来的朋友,我们都会适当给一些优惠。
选择实体注册公司办理,更放心,更安全!我们的承诺:可来公司面谈,可签订合同,会陪同客户一起到教育部认证窗口递交认证材料,客户在教育部官方认证查询网站查询到认证通过结果后付款,不成功不收费!
办理布兰登大学毕业证(BU毕业证书)【微信:6496090 】外观非常简单,由纸质材料制成,上面印有校徽、校名、毕业生姓名、专业等信息。
办理布兰登大学毕业证(BU毕业证书)【微信:6496090 】格式相对统一,各专业都有相应的模板。通常包括以下部分:
校徽:象征着学校的荣誉和传承。
校名:学校英文全称
授予学位:本部分将注明获得的具体学位名称。
毕业生姓名:这是最重要的信息之一,标志着该证书是由特定人员获得的。
颁发日期:这是毕业正式生效的时间,也代表着毕业生学业的结束。
其他信息:根据不同的专业和学位,可能会有一些特定的信息或章节。
办理布兰登大学毕业证(BU毕业证书)【微信:6496090 】价值很高,需要妥善保管。一般来说,应放置在安全、干燥、防潮的地方,避免长时间暴露在阳光下。如需使用,最好使用复印件而不是原件,以免丢失。
综上所述,办理布兰登大学毕业证(BU毕业证书)【微信:6496090 】是证明身份和学历的高价值文件。外观简单庄重,格式统一,包括重要的个人信息和发布日期。对持有人来说,妥善保管是非常重要的。
一比一原版(ECU毕业证)澳洲埃迪斯科文大学毕业证如何办理
原件一模一样【微信:WP101A】【(ECU毕业证)澳洲埃迪斯科文大学毕业证学位证成绩单】【微信:WP101A】(留信学历认证永久存档查询)采用学校原版纸张、特殊工艺完全按照原版一比一制作(包括:隐形水印,阴影底纹,钢印LOGO烫金烫银,LOGO烫金烫银复合重叠,文字图案浮雕,激光镭射,紫外荧光,温感,复印防伪)行业标杆!精益求精,诚心合作,真诚制作!多年品质 ,按需精细制作,24小时接单,全套进口原装设备,十五年致力于帮助留学生解决难题,业务范围有加拿大、英国、澳洲、韩国、美国、新加坡,新西兰等学历材料,包您满意。
【业务选择办理准则】
一、工作未确定,回国需先给父母、亲戚朋友看下文凭的情况,办理一份就读学校的毕业证【微信:WP101A】文凭即可
二、回国进私企、外企、自己做生意的情况,这些单位是不查询毕业证真伪的,而且国内没有渠道去查询国外文凭的真假,也不需要提供真实教育部认证。鉴于此,办理一份毕业证【微信:WP101A】即可
三、进国企,银行,事业单位,考公务员等等,这些单位是必需要提供真实教育部认证的,办理教育部认证所需资料众多且烦琐,所有材料您都必须提供原件,我们凭借丰富的经验,快捷的绿色通道帮您快速整合材料,让您少走弯路。
留信网认证的作用:
1:该专业认证可证明留学生真实身份【微信:WP101A】
2:同时对留学生所学专业登记给予评定
3:国家专业人才认证中心颁发入库证书
4:这个认证书并且可以归档倒地方
5:凡事获得留信网入网的信息将会逐步更新到个人身份内,将在公安局网内查询个人身份证信息后,同步读取人才网入库信息
6:个人职称评审加20分
7:个人信誉贷款加10分
8:在国家人才网主办的国家网络招聘大会中纳入资料,供国家高端企业选择人才
→ 【关于价格问题(保证一手价格)
我们所定的价格是非常合理的,而且我们现在做得单子大多数都是代理和回头客户介绍的所以一般现在有新的单子 我给客户的都是第一手的代理价格,因为我想坦诚对待大家 不想跟大家在价格方面浪费时间
对于老客户或者被老客户介绍过来的朋友,我们都会适当给一些优惠。
选择实体注册公司办理,更放心,更安全!我们的承诺:可来公司面谈,可签订合同,会陪同客户一起到教育部认证窗口递交认证材料,客户在教育部官方认证查询网站查询到认证通过结果后付款,不成功不收费!
办理(ECU毕业证)澳洲埃迪斯科文大学毕业证学位证【微信:WP101A 】外观非常精致,由特殊纸质材料制成,上面印有校徽、校名、毕业生姓名、专业等信息。
办理(ECU毕业证)澳洲埃迪斯科文大学毕业证学位证【微信:WP101A 】格式相对统一,各专业都有相应的模板。通常包括以下部分:
校徽:象征着学校的荣誉和传承。
校名:学校英文全称
授予学位:本部分将注明获得的具体学位名称。
毕业生姓名:这是最重要的信息之一,标志着该证书是由特定人员获得的。
颁发日期:这是毕业正式生效的时间,也代表着毕业生学业的结束。
其他信息:根据不同的专业和学位,可能会有一些特定的信息或章节。
办理(ECU毕业证)澳洲埃迪斯科文大学毕业证学位证【微信:WP101A 】价值很高,需要妥善保管。一般来说,应放置在安全、干燥、防潮的地方,避免长时间暴露在阳光下。如需使用,最好使用复印件而不是原件,以免丢失。
综上所述,办理(ECU毕业证)澳洲埃迪斯科文大学毕业证学位证【微信:WP101A 】是证明身份和学历的高价值文件。外观简单庄重,格式统一,包括重要的个人信息和发布日期。对持有人来说,妥善保管是非常重要的。
More Related Content
Similar to Designing infographics
Separating Myth from Truth in Data Visualisation
This document outlines an agenda for a one-day workshop on data visualization and infographic design. The workshop aims to challenge existing thinking about creating and consuming visualizations, equip attendees with an appreciation of analytical and design choices, provide practice opportunities, and inspire attendees. The agenda covers fundamentals, the design methodology, data representation types, color theory, interactivity, and tools. Exercises are integrated throughout. The trainer, Andy Kirk, has extensive experience delivering visualization training globally.
Insights - Cristobal South Code.pdf
If you can understand the deepest concerns of your customers, you can certainly find an underserved niche to compete with any giant in your industry.
Discover how to find deep imaginative truths about motivations & behaviors with business value.
Understand several sources of Insights with examples from different industries.
Finding insights is a continuous process, especially in the digital world. In the industrial world, decisions are hard to change once they've been made, but in the software world, we can change as many times as necessary.
Furthermore, once we have built the habit of seeking insights into our culture, we will begin to see them everywhere.
Visual Explanations
This document discusses effective visual displays of information. It provides examples of different types of visuals like photographs, drawings, diagrams and charts. It emphasizes that visuals can communicate complex ideas efficiently by conveying the most information in a small space. The document outlines principles of effective visual design from scholars like Tufte, including using graphics to present text and numbers as visual ideas. It also discusses the concept of multimodality, using different modes like images, text and audio together. Learners are given tasks to analyze visual displays and create their own, and readings are suggested for further exploring visual communication and semiotics.
Foundations of IA
Held in conjunction with World IA Day 2018, this practical session was an introduction to the core skills and methods of thinking that you will use as part of your day to day work in IA.
Topics covered include the foundations of IA, the importance of a ‘content first’ approach, thinking like a user and how to present your work to clients.
The session was led by Jon Fisher, Head of UX at Nomensa, an award-winning UX design agency based in London, Bristol and Amsterdam.
Foundations of IA - World IA Day
Held in conjunction with World IA Day 2018, this practical session was an introduction to the core skills and methods of thinking that you can use as part of your day to day work in IA.
Topics covered included the foundations of IA, the importance of a ‘content first’ approach, thinking like a user and how to present your work to clients.
The session was led by Jon Fisher, Head of UX at Nomensa, an award-winning UX design agency based in London, Bristol and Amsterdam.
This is a free event recommended for those new to IA or looking for a refresher on fundamentals.
Following the event, Nomensa will be providing pizza and beers for delegates to enjoy and continue networking.
If you register, but are unable to attend, please give us 48 hours notice so we can reallocate your place.
Touchpoint 2012 Symposium on Interaction Design: Notes
The document summarizes notes from a TouchPoint2012 Symposium on interaction design. Theme One discusses the necessary future of interaction design and panels say know the limits of your intellectual leash, trust your intuition, and being curious as a designer involves trust-building with clients. Theme Two discusses the interaction design experience, with speakers from Adobe, frog, LVL Studio, Habanero, SAP, and Crispin Porter + Bogusky talking about topics like user experience optimization, contextual design, and evaluating interaction designers. Panels recommend focusing on strengths, versatility and creative spirit, using data to support ideas, and addressing how companies view failure.
UI/UX Designer in the year 2020 | Developers Day Nov.19
What it's like to be a designer in the current year, what difficulties we all face and what soft skills everyone should invest in the following years so that they become future-proof in their discipline.
Design Method for Visualizing Complex Data for Users
Social math provides a method for designers to make complex numerical data about an important cause both meaningful and understandable to your audience. Social math is a design process of telling a story with data that will motivate your users to engage in the behavior you intend.
This half-day course is appropriate for all levels of experience. The lessons focus on introducing the concept of social math and detailing a method to design using social math. Design activities provide an opportunity for attendees to practice using the method.
Attendees will learn:
How to define and identify social math
Why social math is an important part of an impactful design
When to incorporate social math into the design process
Where to find reliable data for designing with social math
A method for incorporating social math into their design
What additional resources exist for using social math
Natt Phenjati's Portfolio
This document provides details about Natt Phenjati's educational and professional background, skills, and sample works. It includes information about his Bachelor's degree from Rensselaer Polytechnic Institute in Electronic Media, Arts and Communication and his Master's degree from Domus Academy in Interaction Design. Various design and development projects are summarized, including ReadMe, Vitro, Mito Flip book, and systems designed for education in Thailand. Skills mentioned include design research, prototyping, interface design, and more.
Development slam 2017
These are the slides for a design thinking overview I gave to newly-onboarded developers at IBM. This is part of a larger session kicking off a six-month project where attendees will deliver user research, a set of hills and a prototype to key stakeholders looking for solutions to real problems. I used the example of helping Austin housing authorities fix the affordable housing problem that faces low-income families.
Introduction to User Experience Design
This document provides an introduction to user experience design. It defines user experience as encompassing all aspects of a user's interaction with a company, service, or product. It describes the role of a user experience designer as involving user research, content creation, coding, user interface design, and competitive analysis. The document outlines techniques for user experience research like usability testing, guerrilla research, and competitive analysis. It discusses how to create personas and problem statements to understand users and design problems. Finally, it provides an activity using a persona and problem statement to demonstrate how to apply this knowledge to design decisions.
Design Thinking & Lean UX
This document discusses design thinking and lean UX processes. It begins by defining design thinking as a human-centered approach to problem solving that helps organizations become more innovative. It then outlines some key aspects of design thinking like being empathetic, iterative, and daring. The document discusses how design thinking involves gaining insights into user needs and then testing solutions through quick iterations. It introduces lean UX as building the smallest viable product and getting frequent user feedback to learn what works and what doesn't. The overall process involves understanding user needs, generating ideas, rapidly prototyping solutions, and learning through testing with users.
Design Thinking and Lean UX
From insight to idea, to implementation.
Design Thinking helps us create value-driven innovation.
Lean UX secures success through testing and iterations.
These key ingredients make up a winning combination.
Lillian Ayla Ersoy, BEKK
[CXL Live 16] How To Present Your Testing Results to Get Results by Lea Pica
Are your executives and clients falling asleep during your testing presentations? Chances are your slide design and data visualizations are obscuring your valuable insights. With her special blend of neuroscience-based visualization principles, practical hands-on design techniques, and entertaining “tough love”, Lea will equip you with a fresh new toolbox that will get you and your data presentations remembered and acted upon.
Introduction to Ambassadors eTwinning challenges workshop
This document summarizes a workshop on using personas and design thinking to develop strategies for engaging eTwinning participants. The workshop introduces eTwinning personas, has participants brainstorm strategies for engaging different personas, and develops an action plan or "tool kit" of best strategies. Improv activities are used to encourage collaboration. The document provides context on personas, design thinking, and improv techniques to facilitate participation and idea generation.
How to Entertain audiences using data led content - Trend Report Spring 2015
In this seasons trend report, we open the lens to best practice campaigns from across the digital landscape whilst seeking opinions from the data visualisation community on the hot trends coming our way. Campaigns include airbnb, UNESCO, Virgin, IBM, Nike and some exploratory thinking on Tesla. Thought leading opinions from the likes of Alberto Cairo, Georgia Lupi, Andy Kirk.
How To Sell Your UX Vision- UX Scotland 2015
So you have a killer idea and you are ready to sell through your UX vision. You've got various internal and external stakeholders that you need to get on board. They have varying levels of technical savvy and involvement.
In a world of cross-channel experiences, with an ever-growing number of touchpoints, communicating a vision can be a challenge. In this session, we'll cover the key ingredients you'll need to sell a UX vision. We'll examine ways to craft your UX deliverables so that they tell a story in a way that clearly communicates your vision.
In this presentation, you will learn:
- How to define a UX Vision in five steps
- Why it's crucial to consider and be savvy about politics as part of your process
- How to speak the language of your internal and external audiences
- How to make the best use of numbers and metrics to support your strategy
- The magic of structuring a persuasive presentation
- How and why to adjust the fidelity of your deliverables based on the needs and expectations of your audience
- Techniques and tools to make deliverables that are engaging and memorable
User Experience Design: A Primer for Marketers
This document provides an overview of user experience design for marketers. It discusses how design has evolved from focusing on advertising, branding, and product design to also encompass digital experiences through websites, apps, and other interfaces. The value of companies like Uber and Airbnb that don't own assets but provide digital experiences is highlighted. User experience design is explained as an interdisciplinary practice that includes human-computer interaction, information architecture, visual design, and other areas. The design process of empathizing with users, exploring solutions, and executing prototypes is outlined. The importance of user research, prototyping, testing, and iteration is emphasized to create user-centered experiences.
thinkLA AdU: UX 2015 Presentation Slides
This document provides an overview of user experience design for marketers. It discusses how design has evolved from focusing on advertising, branding, and product design to also encompass digital experiences through websites, apps, and other interfaces. The value of companies like Uber and Airbnb that don't own assets but provide digital experiences is highlighted. User experience design is explained as an interdisciplinary practice that includes human-computer interaction, information architecture, visual design, and other areas. The design process of empathizing with users, exploring solutions, and executing prototypes is outlined. The importance of user research, prototyping, testing, and iteration is emphasized to create user-centered experiences.
Teaching visualization: effective communication in visual formats
This document discusses effective strategies for teaching visual literacy. It defines a visually literate person as someone who can interpret visual media, use images effectively to design and communicate, and understand ethical issues related to visuals. It provides examples of visual literacy standards and competencies, such as determining needed visual materials and interpreting meanings from images. Effective practices for presentations using visuals are also outlined, such as using images and words together, limiting one idea per slide, and making slides understandable within three seconds. Sample assignments are proposed to help students develop visual communication skills.
Similar to Designing infographics (20)
Touchpoint 2012 Symposium on Interaction Design: Notes
Touchpoint 2012 Symposium on Interaction Design: Notes
UI/UX Designer in the year 2020 | Developers Day Nov.19
UI/UX Designer in the year 2020 | Developers Day Nov.19
Design Method for Visualizing Complex Data for Users
Design Method for Visualizing Complex Data for Users
[CXL Live 16] How To Present Your Testing Results to Get Results by Lea Pica
[CXL Live 16] How To Present Your Testing Results to Get Results by Lea Pica
Introduction to Ambassadors eTwinning challenges workshop
Introduction to Ambassadors eTwinning challenges workshop
How to Entertain audiences using data led content - Trend Report Spring 2015
How to Entertain audiences using data led content - Trend Report Spring 2015
Teaching visualization: effective communication in visual formats
Teaching visualization: effective communication in visual formats
Recently uploaded
一比一原版布兰登大学毕业证(BU毕业证书)如何办理
学校原件一模一样【微信:6496090】【布兰登大学毕业证(BU毕业证书)成绩单学位证】【微信:6496090】(留信学历认证永久存档查询)采用学校原版纸张、特殊工艺完全按照原版一比一制作(包括:隐形水印,阴影底纹,钢印LOGO烫金烫银,LOGO烫金烫银复合重叠,文字图案浮雕,激光镭射,紫外荧光,温感,复印防伪)行业标杆!精益求精,诚心合作,真诚制作!多年品质 ,按需精细制作,24小时接单,全套进口原装设备,十五年致力于帮助留学生解决难题,业务范围有加拿大、英国、澳洲、韩国、美国、新加坡,新西兰等学历材料,包您满意。
【业务选择办理准则】
一、工作未确定,回国需先给父母、亲戚朋友看下文凭的情况,办理一份就读学校的毕业证【微信:6496090】文凭即可
二、回国进私企、外企、自己做生意的情况,这些单位是不查询毕业证真伪的,而且国内没有渠道去查询国外文凭的真假,也不需要提供真实教育部认证。鉴于此,办理一份毕业证【微信:6496090】即可
三、进国企,银行,事业单位,考公务员等等,这些单位是必需要提供真实教育部认证的,办理教育部认证所需资料众多且烦琐,所有材料您都必须提供原件,我们凭借丰富的经验,快捷的绿色通道帮您快速整合材料,让您少走弯路。
留信网认证的作用:
1:该专业认证可证明留学生真实身份【微信:6496090】
2:同时对留学生所学专业登记给予评定
3:国家专业人才认证中心颁发入库证书
4:这个认证书并且可以归档倒地方
5:凡事获得留信网入网的信息将会逐步更新到个人身份内,将在公安局网内查询个人身份证信息后,同步读取人才网入库信息
6:个人职称评审加20分
7:个人信誉贷款加10分
8:在国家人才网主办的国家网络招聘大会中纳入资料,供国家高端企业选择人才
→ 【关于价格问题(保证一手价格)
我们所定的价格是非常合理的,而且我们现在做得单子大多数都是代理和回头客户介绍的所以一般现在有新的单子 我给客户的都是第一手的代理价格,因为我想坦诚对待大家 不想跟大家在价格方面浪费时间
对于老客户或者被老客户介绍过来的朋友,我们都会适当给一些优惠。
选择实体注册公司办理,更放心,更安全!我们的承诺:可来公司面谈,可签订合同,会陪同客户一起到教育部认证窗口递交认证材料,客户在教育部官方认证查询网站查询到认证通过结果后付款,不成功不收费!
办理布兰登大学毕业证(BU毕业证书)【微信:6496090 】外观非常简单,由纸质材料制成,上面印有校徽、校名、毕业生姓名、专业等信息。
办理布兰登大学毕业证(BU毕业证书)【微信:6496090 】格式相对统一,各专业都有相应的模板。通常包括以下部分:
校徽:象征着学校的荣誉和传承。
校名:学校英文全称
授予学位:本部分将注明获得的具体学位名称。
毕业生姓名:这是最重要的信息之一,标志着该证书是由特定人员获得的。
颁发日期:这是毕业正式生效的时间,也代表着毕业生学业的结束。
其他信息:根据不同的专业和学位,可能会有一些特定的信息或章节。
办理布兰登大学毕业证(BU毕业证书)【微信:6496090 】价值很高,需要妥善保管。一般来说,应放置在安全、干燥、防潮的地方,避免长时间暴露在阳光下。如需使用,最好使用复印件而不是原件,以免丢失。
综上所述,办理布兰登大学毕业证(BU毕业证书)【微信:6496090 】是证明身份和学历的高价值文件。外观简单庄重,格式统一,包括重要的个人信息和发布日期。对持有人来说,妥善保管是非常重要的。
一比一原版(ECU毕业证)澳洲埃迪斯科文大学毕业证如何办理
原件一模一样【微信:WP101A】【(ECU毕业证)澳洲埃迪斯科文大学毕业证学位证成绩单】【微信:WP101A】(留信学历认证永久存档查询)采用学校原版纸张、特殊工艺完全按照原版一比一制作(包括:隐形水印,阴影底纹,钢印LOGO烫金烫银,LOGO烫金烫银复合重叠,文字图案浮雕,激光镭射,紫外荧光,温感,复印防伪)行业标杆!精益求精,诚心合作,真诚制作!多年品质 ,按需精细制作,24小时接单,全套进口原装设备,十五年致力于帮助留学生解决难题,业务范围有加拿大、英国、澳洲、韩国、美国、新加坡,新西兰等学历材料,包您满意。
【业务选择办理准则】
一、工作未确定,回国需先给父母、亲戚朋友看下文凭的情况,办理一份就读学校的毕业证【微信:WP101A】文凭即可
二、回国进私企、外企、自己做生意的情况,这些单位是不查询毕业证真伪的,而且国内没有渠道去查询国外文凭的真假,也不需要提供真实教育部认证。鉴于此,办理一份毕业证【微信:WP101A】即可
三、进国企,银行,事业单位,考公务员等等,这些单位是必需要提供真实教育部认证的,办理教育部认证所需资料众多且烦琐,所有材料您都必须提供原件,我们凭借丰富的经验,快捷的绿色通道帮您快速整合材料,让您少走弯路。
留信网认证的作用:
1:该专业认证可证明留学生真实身份【微信:WP101A】
2:同时对留学生所学专业登记给予评定
3:国家专业人才认证中心颁发入库证书
4:这个认证书并且可以归档倒地方
5:凡事获得留信网入网的信息将会逐步更新到个人身份内,将在公安局网内查询个人身份证信息后,同步读取人才网入库信息
6:个人职称评审加20分
7:个人信誉贷款加10分
8:在国家人才网主办的国家网络招聘大会中纳入资料,供国家高端企业选择人才
→ 【关于价格问题(保证一手价格)
我们所定的价格是非常合理的,而且我们现在做得单子大多数都是代理和回头客户介绍的所以一般现在有新的单子 我给客户的都是第一手的代理价格,因为我想坦诚对待大家 不想跟大家在价格方面浪费时间
对于老客户或者被老客户介绍过来的朋友,我们都会适当给一些优惠。
选择实体注册公司办理,更放心,更安全!我们的承诺:可来公司面谈,可签订合同,会陪同客户一起到教育部认证窗口递交认证材料,客户在教育部官方认证查询网站查询到认证通过结果后付款,不成功不收费!
办理(ECU毕业证)澳洲埃迪斯科文大学毕业证学位证【微信:WP101A 】外观非常精致,由特殊纸质材料制成,上面印有校徽、校名、毕业生姓名、专业等信息。
办理(ECU毕业证)澳洲埃迪斯科文大学毕业证学位证【微信:WP101A 】格式相对统一,各专业都有相应的模板。通常包括以下部分:
校徽:象征着学校的荣誉和传承。
校名:学校英文全称
授予学位:本部分将注明获得的具体学位名称。
毕业生姓名:这是最重要的信息之一,标志着该证书是由特定人员获得的。
颁发日期:这是毕业正式生效的时间,也代表着毕业生学业的结束。
其他信息:根据不同的专业和学位,可能会有一些特定的信息或章节。
办理(ECU毕业证)澳洲埃迪斯科文大学毕业证学位证【微信:WP101A 】价值很高,需要妥善保管。一般来说,应放置在安全、干燥、防潮的地方,避免长时间暴露在阳光下。如需使用,最好使用复印件而不是原件,以免丢失。
综上所述,办理(ECU毕业证)澳洲埃迪斯科文大学毕业证学位证【微信:WP101A 】是证明身份和学历的高价值文件。外观简单庄重,格式统一,包括重要的个人信息和发布日期。对持有人来说,妥善保管是非常重要的。
欧洲杯足彩-欧洲杯足彩买球软件-欧洲杯足彩买球软件下载|【网址🎉ac123.net🎉】
【网址🎉ac123.net🎉】欧洲杯足彩 Sports 与其他博彩公司相比,其独特之处在于欧洲杯足彩 Sports 基于低利润和高营业额的独一无二的体育博彩模式,该模式可以为玩家开出最高的赔率。欧洲杯足彩的优势在于中文界面友好,接受人民币投注。他们的开户奖金和实时体育投注界面是大陆玩家的首选。
一比一原版(Brunel毕业证)英国布鲁内尔大学毕业证如何办理
原件一模一样【微信:WP101A】【(Brunel毕业证)英国布鲁内尔大学毕业证学位证成绩单】【微信:WP101A】(留信学历认证永久存档查询)采用学校原版纸张、特殊工艺完全按照原版一比一制作(包括:隐形水印,阴影底纹,钢印LOGO烫金烫银,LOGO烫金烫银复合重叠,文字图案浮雕,激光镭射,紫外荧光,温感,复印防伪)行业标杆!精益求精,诚心合作,真诚制作!多年品质 ,按需精细制作,24小时接单,全套进口原装设备,十五年致力于帮助留学生解决难题,业务范围有加拿大、英国、澳洲、韩国、美国、新加坡,新西兰等学历材料,包您满意。
【业务选择办理准则】
一、工作未确定,回国需先给父母、亲戚朋友看下文凭的情况,办理一份就读学校的毕业证【微信:WP101A】文凭即可
二、回国进私企、外企、自己做生意的情况,这些单位是不查询毕业证真伪的,而且国内没有渠道去查询国外文凭的真假,也不需要提供真实教育部认证。鉴于此,办理一份毕业证【微信:WP101A】即可
三、进国企,银行,事业单位,考公务员等等,这些单位是必需要提供真实教育部认证的,办理教育部认证所需资料众多且烦琐,所有材料您都必须提供原件,我们凭借丰富的经验,快捷的绿色通道帮您快速整合材料,让您少走弯路。
留信网认证的作用:
1:该专业认证可证明留学生真实身份【微信:WP101A】
2:同时对留学生所学专业登记给予评定
3:国家专业人才认证中心颁发入库证书
4:这个认证书并且可以归档倒地方
5:凡事获得留信网入网的信息将会逐步更新到个人身份内,将在公安局网内查询个人身份证信息后,同步读取人才网入库信息
6:个人职称评审加20分
7:个人信誉贷款加10分
8:在国家人才网主办的国家网络招聘大会中纳入资料,供国家高端企业选择人才
→ 【关于价格问题(保证一手价格)
我们所定的价格是非常合理的,而且我们现在做得单子大多数都是代理和回头客户介绍的所以一般现在有新的单子 我给客户的都是第一手的代理价格,因为我想坦诚对待大家 不想跟大家在价格方面浪费时间
对于老客户或者被老客户介绍过来的朋友,我们都会适当给一些优惠。
选择实体注册公司办理,更放心,更安全!我们的承诺:可来公司面谈,可签订合同,会陪同客户一起到教育部认证窗口递交认证材料,客户在教育部官方认证查询网站查询到认证通过结果后付款,不成功不收费!
办理(Brunel毕业证)英国布鲁内尔大学毕业证学位证【微信:WP101A 】外观非常精致,由特殊纸质材料制成,上面印有校徽、校名、毕业生姓名、专业等信息。
办理(Brunel毕业证)英国布鲁内尔大学毕业证学位证【微信:WP101A 】格式相对统一,各专业都有相应的模板。通常包括以下部分:
校徽:象征着学校的荣誉和传承。
校名:学校英文全称
授予学位:本部分将注明获得的具体学位名称。
毕业生姓名:这是最重要的信息之一,标志着该证书是由特定人员获得的。
颁发日期:这是毕业正式生效的时间,也代表着毕业生学业的结束。
其他信息:根据不同的专业和学位,可能会有一些特定的信息或章节。
办理(Brunel毕业证)英国布鲁内尔大学毕业证学位证【微信:WP101A 】价值很高,需要妥善保管。一般来说,应放置在安全、干燥、防潮的地方,避免长时间暴露在阳光下。如需使用,最好使用复印件而不是原件,以免丢失。
综上所述,办理(Brunel毕业证)英国布鲁内尔大学毕业证学位证【微信:WP101A 】是证明身份和学历的高价值文件。外观简单庄重,格式统一,包括重要的个人信息和发布日期。对持有人来说,妥善保管是非常重要的。
欧洲杯足彩-欧洲杯足彩比赛投注-欧洲杯足彩比赛投注官网|【网址🎉ac10.net🎉】
【网址🎉ac10.net🎉】欧洲杯足彩是世界上历史最悠久的博彩公司之一。其历史可以追溯到十九世纪末,确切时间是1886年。这家英国公司拥有超过15000名员工,是博彩行业规模最大的公司。欧洲杯足彩是英国最受欢迎的实体博彩公司之一,其排名仅次于欧洲杯足彩,旗下2800家投注站遍布全英国。
一比一原版(UoN毕业证书)纽卡斯尔大学毕业证如何办理
原件一模一样【微信:WP101A】【(UoN毕业证书)纽卡斯尔大学毕业证学位证成绩单】【微信:WP101A】(留信学历认证永久存档查询)采用学校原版纸张、特殊工艺完全按照原版一比一制作(包括:隐形水印,阴影底纹,钢印LOGO烫金烫银,LOGO烫金烫银复合重叠,文字图案浮雕,激光镭射,紫外荧光,温感,复印防伪)行业标杆!精益求精,诚心合作,真诚制作!多年品质 ,按需精细制作,24小时接单,全套进口原装设备,十五年致力于帮助留学生解决难题,业务范围有加拿大、英国、澳洲、韩国、美国、新加坡,新西兰等学历材料,包您满意。
【业务选择办理准则】
一、工作未确定,回国需先给父母、亲戚朋友看下文凭的情况,办理一份就读学校的毕业证【微信:WP101A】文凭即可
二、回国进私企、外企、自己做生意的情况,这些单位是不查询毕业证真伪的,而且国内没有渠道去查询国外文凭的真假,也不需要提供真实教育部认证。鉴于此,办理一份毕业证【微信:WP101A】即可
三、进国企,银行,事业单位,考公务员等等,这些单位是必需要提供真实教育部认证的,办理教育部认证所需资料众多且烦琐,所有材料您都必须提供原件,我们凭借丰富的经验,快捷的绿色通道帮您快速整合材料,让您少走弯路。
留信网认证的作用:
1:该专业认证可证明留学生真实身份【微信:WP101A】
2:同时对留学生所学专业登记给予评定
3:国家专业人才认证中心颁发入库证书
4:这个认证书并且可以归档倒地方
5:凡事获得留信网入网的信息将会逐步更新到个人身份内,将在公安局网内查询个人身份证信息后,同步读取人才网入库信息
6:个人职称评审加20分
7:个人信誉贷款加10分
8:在国家人才网主办的国家网络招聘大会中纳入资料,供国家高端企业选择人才
→ 【关于价格问题(保证一手价格)
我们所定的价格是非常合理的,而且我们现在做得单子大多数都是代理和回头客户介绍的所以一般现在有新的单子 我给客户的都是第一手的代理价格,因为我想坦诚对待大家 不想跟大家在价格方面浪费时间
对于老客户或者被老客户介绍过来的朋友,我们都会适当给一些优惠。
选择实体注册公司办理,更放心,更安全!我们的承诺:可来公司面谈,可签订合同,会陪同客户一起到教育部认证窗口递交认证材料,客户在教育部官方认证查询网站查询到认证通过结果后付款,不成功不收费!
办理(UoN毕业证书)纽卡斯尔大学毕业证学位证【微信:WP101A 】外观非常精致,由特殊纸质材料制成,上面印有校徽、校名、毕业生姓名、专业等信息。
办理(UoN毕业证书)纽卡斯尔大学毕业证学位证【微信:WP101A 】格式相对统一,各专业都有相应的模板。通常包括以下部分:
校徽:象征着学校的荣誉和传承。
校名:学校英文全称
授予学位:本部分将注明获得的具体学位名称。
毕业生姓名:这是最重要的信息之一,标志着该证书是由特定人员获得的。
颁发日期:这是毕业正式生效的时间,也代表着毕业生学业的结束。
其他信息:根据不同的专业和学位,可能会有一些特定的信息或章节。
办理(UoN毕业证书)纽卡斯尔大学毕业证学位证【微信:WP101A 】价值很高,需要妥善保管。一般来说,应放置在安全、干燥、防潮的地方,避免长时间暴露在阳光下。如需使用,最好使用复印件而不是原件,以免丢失。
综上所述,办理(UoN毕业证书)纽卡斯尔大学毕业证学位证【微信:WP101A 】是证明身份和学历的高价值文件。外观简单庄重,格式统一,包括重要的个人信息和发布日期。对持有人来说,妥善保管是非常重要的。
一比一原版(KPU毕业证)加拿大昆特兰理工大学毕业证如何办理
原件一模一样【微信:WP101A】【(KPU毕业证)加拿大昆特兰理工大学毕业证学位证成绩单】【微信:WP101A】(留信学历认证永久存档查询)采用学校原版纸张、特殊工艺完全按照原版一比一制作(包括:隐形水印,阴影底纹,钢印LOGO烫金烫银,LOGO烫金烫银复合重叠,文字图案浮雕,激光镭射,紫外荧光,温感,复印防伪)行业标杆!精益求精,诚心合作,真诚制作!多年品质 ,按需精细制作,24小时接单,全套进口原装设备,十五年致力于帮助留学生解决难题,业务范围有加拿大、英国、澳洲、韩国、美国、新加坡,新西兰等学历材料,包您满意。
【业务选择办理准则】
一、工作未确定,回国需先给父母、亲戚朋友看下文凭的情况,办理一份就读学校的毕业证【微信:WP101A】文凭即可
二、回国进私企、外企、自己做生意的情况,这些单位是不查询毕业证真伪的,而且国内没有渠道去查询国外文凭的真假,也不需要提供真实教育部认证。鉴于此,办理一份毕业证【微信:WP101A】即可
三、进国企,银行,事业单位,考公务员等等,这些单位是必需要提供真实教育部认证的,办理教育部认证所需资料众多且烦琐,所有材料您都必须提供原件,我们凭借丰富的经验,快捷的绿色通道帮您快速整合材料,让您少走弯路。
留信网认证的作用:
1:该专业认证可证明留学生真实身份【微信:WP101A】
2:同时对留学生所学专业登记给予评定
3:国家专业人才认证中心颁发入库证书
4:这个认证书并且可以归档倒地方
5:凡事获得留信网入网的信息将会逐步更新到个人身份内,将在公安局网内查询个人身份证信息后,同步读取人才网入库信息
6:个人职称评审加20分
7:个人信誉贷款加10分
8:在国家人才网主办的国家网络招聘大会中纳入资料,供国家高端企业选择人才
→ 【关于价格问题(保证一手价格)
我们所定的价格是非常合理的,而且我们现在做得单子大多数都是代理和回头客户介绍的所以一般现在有新的单子 我给客户的都是第一手的代理价格,因为我想坦诚对待大家 不想跟大家在价格方面浪费时间
对于老客户或者被老客户介绍过来的朋友,我们都会适当给一些优惠。
选择实体注册公司办理,更放心,更安全!我们的承诺:可来公司面谈,可签订合同,会陪同客户一起到教育部认证窗口递交认证材料,客户在教育部官方认证查询网站查询到认证通过结果后付款,不成功不收费!
办理(KPU毕业证)加拿大昆特兰理工大学毕业证学位证【微信:WP101A 】外观非常精致,由特殊纸质材料制成,上面印有校徽、校名、毕业生姓名、专业等信息。
办理(KPU毕业证)加拿大昆特兰理工大学毕业证学位证【微信:WP101A 】格式相对统一,各专业都有相应的模板。通常包括以下部分:
校徽:象征着学校的荣誉和传承。
校名:学校英文全称
授予学位:本部分将注明获得的具体学位名称。
毕业生姓名:这是最重要的信息之一,标志着该证书是由特定人员获得的。
颁发日期:这是毕业正式生效的时间,也代表着毕业生学业的结束。
其他信息:根据不同的专业和学位,可能会有一些特定的信息或章节。
办理(KPU毕业证)加拿大昆特兰理工大学毕业证学位证【微信:WP101A 】价值很高,需要妥善保管。一般来说,应放置在安全、干燥、防潮的地方,避免长时间暴露在阳光下。如需使用,最好使用复印件而不是原件,以免丢失。
综上所述,办理(KPU毕业证)加拿大昆特兰理工大学毕业证学位证【微信:WP101A 】是证明身份和学历的高价值文件。外观简单庄重,格式统一,包括重要的个人信息和发布日期。对持有人来说,妥善保管是非常重要的。
一比一原版(CSUEB毕业证)美国加州州立大学东湾分校毕业证如何办理
原件一模一样【微信:WP101A】【(CSUEB毕业证)美国加州州立大学东湾分校毕业证学位证成绩单】【微信:WP101A】(留信学历认证永久存档查询)采用学校原版纸张、特殊工艺完全按照原版一比一制作(包括:隐形水印,阴影底纹,钢印LOGO烫金烫银,LOGO烫金烫银复合重叠,文字图案浮雕,激光镭射,紫外荧光,温感,复印防伪)行业标杆!精益求精,诚心合作,真诚制作!多年品质 ,按需精细制作,24小时接单,全套进口原装设备,十五年致力于帮助留学生解决难题,业务范围有加拿大、英国、澳洲、韩国、美国、新加坡,新西兰等学历材料,包您满意。
【业务选择办理准则】
一、工作未确定,回国需先给父母、亲戚朋友看下文凭的情况,办理一份就读学校的毕业证【微信:WP101A】文凭即可
二、回国进私企、外企、自己做生意的情况,这些单位是不查询毕业证真伪的,而且国内没有渠道去查询国外文凭的真假,也不需要提供真实教育部认证。鉴于此,办理一份毕业证【微信:WP101A】即可
三、进国企,银行,事业单位,考公务员等等,这些单位是必需要提供真实教育部认证的,办理教育部认证所需资料众多且烦琐,所有材料您都必须提供原件,我们凭借丰富的经验,快捷的绿色通道帮您快速整合材料,让您少走弯路。
留信网认证的作用:
1:该专业认证可证明留学生真实身份【微信:WP101A】
2:同时对留学生所学专业登记给予评定
3:国家专业人才认证中心颁发入库证书
4:这个认证书并且可以归档倒地方
5:凡事获得留信网入网的信息将会逐步更新到个人身份内,将在公安局网内查询个人身份证信息后,同步读取人才网入库信息
6:个人职称评审加20分
7:个人信誉贷款加10分
8:在国家人才网主办的国家网络招聘大会中纳入资料,供国家高端企业选择人才
→ 【关于价格问题(保证一手价格)
我们所定的价格是非常合理的,而且我们现在做得单子大多数都是代理和回头客户介绍的所以一般现在有新的单子 我给客户的都是第一手的代理价格,因为我想坦诚对待大家 不想跟大家在价格方面浪费时间
对于老客户或者被老客户介绍过来的朋友,我们都会适当给一些优惠。
选择实体注册公司办理,更放心,更安全!我们的承诺:可来公司面谈,可签订合同,会陪同客户一起到教育部认证窗口递交认证材料,客户在教育部官方认证查询网站查询到认证通过结果后付款,不成功不收费!
办理(CSUEB毕业证)美国加州州立大学东湾分校毕业证学位证【微信:WP101A 】外观非常精致,由特殊纸质材料制成,上面印有校徽、校名、毕业生姓名、专业等信息。
办理(CSUEB毕业证)美国加州州立大学东湾分校毕业证学位证【微信:WP101A 】格式相对统一,各专业都有相应的模板。通常包括以下部分:
校徽:象征着学校的荣誉和传承。
校名:学校英文全称
授予学位:本部分将注明获得的具体学位名称。
毕业生姓名:这是最重要的信息之一,标志着该证书是由特定人员获得的。
颁发日期:这是毕业正式生效的时间,也代表着毕业生学业的结束。
其他信息:根据不同的专业和学位,可能会有一些特定的信息或章节。
办理(CSUEB毕业证)美国加州州立大学东湾分校毕业证学位证【微信:WP101A 】价值很高,需要妥善保管。一般来说,应放置在安全、干燥、防潮的地方,避免长时间暴露在阳光下。如需使用,最好使用复印件而不是原件,以免丢失。
综上所述,办理(CSUEB毕业证)美国加州州立大学东湾分校毕业证学位证【微信:WP101A 】是证明身份和学历的高价值文件。外观简单庄重,格式统一,包括重要的个人信息和发布日期。对持有人来说,妥善保管是非常重要的。
一比一原版(LSE毕业证书)伦敦政治经济学院毕业证如何办理
原件一模一样【微信:WP101A】【(LSE毕业证书)伦敦政治经济学院毕业证学位证成绩单】【微信:WP101A】(留信学历认证永久存档查询)采用学校原版纸张、特殊工艺完全按照原版一比一制作(包括:隐形水印,阴影底纹,钢印LOGO烫金烫银,LOGO烫金烫银复合重叠,文字图案浮雕,激光镭射,紫外荧光,温感,复印防伪)行业标杆!精益求精,诚心合作,真诚制作!多年品质 ,按需精细制作,24小时接单,全套进口原装设备,十五年致力于帮助留学生解决难题,业务范围有加拿大、英国、澳洲、韩国、美国、新加坡,新西兰等学历材料,包您满意。
【业务选择办理准则】
一、工作未确定,回国需先给父母、亲戚朋友看下文凭的情况,办理一份就读学校的毕业证【微信:WP101A】文凭即可
二、回国进私企、外企、自己做生意的情况,这些单位是不查询毕业证真伪的,而且国内没有渠道去查询国外文凭的真假,也不需要提供真实教育部认证。鉴于此,办理一份毕业证【微信:WP101A】即可
三、进国企,银行,事业单位,考公务员等等,这些单位是必需要提供真实教育部认证的,办理教育部认证所需资料众多且烦琐,所有材料您都必须提供原件,我们凭借丰富的经验,快捷的绿色通道帮您快速整合材料,让您少走弯路。
留信网认证的作用:
1:该专业认证可证明留学生真实身份【微信:WP101A】
2:同时对留学生所学专业登记给予评定
3:国家专业人才认证中心颁发入库证书
4:这个认证书并且可以归档倒地方
5:凡事获得留信网入网的信息将会逐步更新到个人身份内,将在公安局网内查询个人身份证信息后,同步读取人才网入库信息
6:个人职称评审加20分
7:个人信誉贷款加10分
8:在国家人才网主办的国家网络招聘大会中纳入资料,供国家高端企业选择人才
→ 【关于价格问题(保证一手价格)
我们所定的价格是非常合理的,而且我们现在做得单子大多数都是代理和回头客户介绍的所以一般现在有新的单子 我给客户的都是第一手的代理价格,因为我想坦诚对待大家 不想跟大家在价格方面浪费时间
对于老客户或者被老客户介绍过来的朋友,我们都会适当给一些优惠。
选择实体注册公司办理,更放心,更安全!我们的承诺:可来公司面谈,可签订合同,会陪同客户一起到教育部认证窗口递交认证材料,客户在教育部官方认证查询网站查询到认证通过结果后付款,不成功不收费!
办理(LSE毕业证书)伦敦政治经济学院毕业证学位证【微信:WP101A 】外观非常精致,由特殊纸质材料制成,上面印有校徽、校名、毕业生姓名、专业等信息。
办理(LSE毕业证书)伦敦政治经济学院毕业证学位证【微信:WP101A 】格式相对统一,各专业都有相应的模板。通常包括以下部分:
校徽:象征着学校的荣誉和传承。
校名:学校英文全称
授予学位:本部分将注明获得的具体学位名称。
毕业生姓名:这是最重要的信息之一,标志着该证书是由特定人员获得的。
颁发日期:这是毕业正式生效的时间,也代表着毕业生学业的结束。
其他信息:根据不同的专业和学位,可能会有一些特定的信息或章节。
办理(LSE毕业证书)伦敦政治经济学院毕业证学位证【微信:WP101A 】价值很高,需要妥善保管。一般来说,应放置在安全、干燥、防潮的地方,避免长时间暴露在阳光下。如需使用,最好使用复印件而不是原件,以免丢失。
综上所述,办理(LSE毕业证书)伦敦政治经济学院毕业证学位证【微信:WP101A 】是证明身份和学历的高价值文件。外观简单庄重,格式统一,包括重要的个人信息和发布日期。对持有人来说,妥善保管是非常重要的。
一比一原版(NU毕业证书)诺森比亚大学毕业证如何办理
原件一模一样【微信:WP101A】【(NU毕业证书)诺森比亚大学毕业证学位证成绩单】【微信:WP101A】(留信学历认证永久存档查询)采用学校原版纸张、特殊工艺完全按照原版一比一制作(包括:隐形水印,阴影底纹,钢印LOGO烫金烫银,LOGO烫金烫银复合重叠,文字图案浮雕,激光镭射,紫外荧光,温感,复印防伪)行业标杆!精益求精,诚心合作,真诚制作!多年品质 ,按需精细制作,24小时接单,全套进口原装设备,十五年致力于帮助留学生解决难题,业务范围有加拿大、英国、澳洲、韩国、美国、新加坡,新西兰等学历材料,包您满意。
【业务选择办理准则】
一、工作未确定,回国需先给父母、亲戚朋友看下文凭的情况,办理一份就读学校的毕业证【微信:WP101A】文凭即可
二、回国进私企、外企、自己做生意的情况,这些单位是不查询毕业证真伪的,而且国内没有渠道去查询国外文凭的真假,也不需要提供真实教育部认证。鉴于此,办理一份毕业证【微信:WP101A】即可
三、进国企,银行,事业单位,考公务员等等,这些单位是必需要提供真实教育部认证的,办理教育部认证所需资料众多且烦琐,所有材料您都必须提供原件,我们凭借丰富的经验,快捷的绿色通道帮您快速整合材料,让您少走弯路。
留信网认证的作用:
1:该专业认证可证明留学生真实身份【微信:WP101A】
2:同时对留学生所学专业登记给予评定
3:国家专业人才认证中心颁发入库证书
4:这个认证书并且可以归档倒地方
5:凡事获得留信网入网的信息将会逐步更新到个人身份内,将在公安局网内查询个人身份证信息后,同步读取人才网入库信息
6:个人职称评审加20分
7:个人信誉贷款加10分
8:在国家人才网主办的国家网络招聘大会中纳入资料,供国家高端企业选择人才
→ 【关于价格问题(保证一手价格)
我们所定的价格是非常合理的,而且我们现在做得单子大多数都是代理和回头客户介绍的所以一般现在有新的单子 我给客户的都是第一手的代理价格,因为我想坦诚对待大家 不想跟大家在价格方面浪费时间
对于老客户或者被老客户介绍过来的朋友,我们都会适当给一些优惠。
选择实体注册公司办理,更放心,更安全!我们的承诺:可来公司面谈,可签订合同,会陪同客户一起到教育部认证窗口递交认证材料,客户在教育部官方认证查询网站查询到认证通过结果后付款,不成功不收费!
办理(NU毕业证书)诺森比亚大学毕业证学位证【微信:WP101A 】外观非常精致,由特殊纸质材料制成,上面印有校徽、校名、毕业生姓名、专业等信息。
办理(NU毕业证书)诺森比亚大学毕业证学位证【微信:WP101A 】格式相对统一,各专业都有相应的模板。通常包括以下部分:
校徽:象征着学校的荣誉和传承。
校名:学校英文全称
授予学位:本部分将注明获得的具体学位名称。
毕业生姓名:这是最重要的信息之一,标志着该证书是由特定人员获得的。
颁发日期:这是毕业正式生效的时间,也代表着毕业生学业的结束。
其他信息:根据不同的专业和学位,可能会有一些特定的信息或章节。
办理(NU毕业证书)诺森比亚大学毕业证学位证【微信:WP101A 】价值很高,需要妥善保管。一般来说,应放置在安全、干燥、防潮的地方,避免长时间暴露在阳光下。如需使用,最好使用复印件而不是原件,以免丢失。
综上所述,办理(NU毕业证书)诺森比亚大学毕业证学位证【微信:WP101A 】是证明身份和学历的高价值文件。外观简单庄重,格式统一,包括重要的个人信息和发布日期。对持有人来说,妥善保管是非常重要的。
一比一原版(UW毕业证书)华盛顿大学毕业证如何办理
原件一模一样【微信:WP101A】【(UW毕业证书)华盛顿大学毕业证学位证成绩单】【微信:WP101A】(留信学历认证永久存档查询)采用学校原版纸张、特殊工艺完全按照原版一比一制作(包括:隐形水印,阴影底纹,钢印LOGO烫金烫银,LOGO烫金烫银复合重叠,文字图案浮雕,激光镭射,紫外荧光,温感,复印防伪)行业标杆!精益求精,诚心合作,真诚制作!多年品质 ,按需精细制作,24小时接单,全套进口原装设备,十五年致力于帮助留学生解决难题,业务范围有加拿大、英国、澳洲、韩国、美国、新加坡,新西兰等学历材料,包您满意。
【业务选择办理准则】
一、工作未确定,回国需先给父母、亲戚朋友看下文凭的情况,办理一份就读学校的毕业证【微信:WP101A】文凭即可
二、回国进私企、外企、自己做生意的情况,这些单位是不查询毕业证真伪的,而且国内没有渠道去查询国外文凭的真假,也不需要提供真实教育部认证。鉴于此,办理一份毕业证【微信:WP101A】即可
三、进国企,银行,事业单位,考公务员等等,这些单位是必需要提供真实教育部认证的,办理教育部认证所需资料众多且烦琐,所有材料您都必须提供原件,我们凭借丰富的经验,快捷的绿色通道帮您快速整合材料,让您少走弯路。
留信网认证的作用:
1:该专业认证可证明留学生真实身份【微信:WP101A】
2:同时对留学生所学专业登记给予评定
3:国家专业人才认证中心颁发入库证书
4:这个认证书并且可以归档倒地方
5:凡事获得留信网入网的信息将会逐步更新到个人身份内,将在公安局网内查询个人身份证信息后,同步读取人才网入库信息
6:个人职称评审加20分
7:个人信誉贷款加10分
8:在国家人才网主办的国家网络招聘大会中纳入资料,供国家高端企业选择人才
→ 【关于价格问题(保证一手价格)
我们所定的价格是非常合理的,而且我们现在做得单子大多数都是代理和回头客户介绍的所以一般现在有新的单子 我给客户的都是第一手的代理价格,因为我想坦诚对待大家 不想跟大家在价格方面浪费时间
对于老客户或者被老客户介绍过来的朋友,我们都会适当给一些优惠。
选择实体注册公司办理,更放心,更安全!我们的承诺:可来公司面谈,可签订合同,会陪同客户一起到教育部认证窗口递交认证材料,客户在教育部官方认证查询网站查询到认证通过结果后付款,不成功不收费!
办理(UW毕业证书)华盛顿大学毕业证学位证【微信:WP101A 】外观非常精致,由特殊纸质材料制成,上面印有校徽、校名、毕业生姓名、专业等信息。
办理(UW毕业证书)华盛顿大学毕业证学位证【微信:WP101A 】格式相对统一,各专业都有相应的模板。通常包括以下部分:
校徽:象征着学校的荣誉和传承。
校名:学校英文全称
授予学位:本部分将注明获得的具体学位名称。
毕业生姓名:这是最重要的信息之一,标志着该证书是由特定人员获得的。
颁发日期:这是毕业正式生效的时间,也代表着毕业生学业的结束。
其他信息:根据不同的专业和学位,可能会有一些特定的信息或章节。
办理(UW毕业证书)华盛顿大学毕业证学位证【微信:WP101A 】价值很高,需要妥善保管。一般来说,应放置在安全、干燥、防潮的地方,避免长时间暴露在阳光下。如需使用,最好使用复印件而不是原件,以免丢失。
综上所述,办理(UW毕业证书)华盛顿大学毕业证学位证【微信:WP101A 】是证明身份和学历的高价值文件。外观简单庄重,格式统一,包括重要的个人信息和发布日期。对持有人来说,妥善保管是非常重要的。
一比一原版(爱大毕业证)美国爱荷华大学毕业证如何办理
原件一模一样【微信:WP101A】【(爱大毕业证)美国爱荷华大学毕业证学位证成绩单】【微信:WP101A】(留信学历认证永久存档查询)采用学校原版纸张、特殊工艺完全按照原版一比一制作(包括:隐形水印,阴影底纹,钢印LOGO烫金烫银,LOGO烫金烫银复合重叠,文字图案浮雕,激光镭射,紫外荧光,温感,复印防伪)行业标杆!精益求精,诚心合作,真诚制作!多年品质 ,按需精细制作,24小时接单,全套进口原装设备,十五年致力于帮助留学生解决难题,业务范围有加拿大、英国、澳洲、韩国、美国、新加坡,新西兰等学历材料,包您满意。
【业务选择办理准则】
一、工作未确定,回国需先给父母、亲戚朋友看下文凭的情况,办理一份就读学校的毕业证【微信:WP101A】文凭即可
二、回国进私企、外企、自己做生意的情况,这些单位是不查询毕业证真伪的,而且国内没有渠道去查询国外文凭的真假,也不需要提供真实教育部认证。鉴于此,办理一份毕业证【微信:WP101A】即可
三、进国企,银行,事业单位,考公务员等等,这些单位是必需要提供真实教育部认证的,办理教育部认证所需资料众多且烦琐,所有材料您都必须提供原件,我们凭借丰富的经验,快捷的绿色通道帮您快速整合材料,让您少走弯路。
留信网认证的作用:
1:该专业认证可证明留学生真实身份【微信:WP101A】
2:同时对留学生所学专业登记给予评定
3:国家专业人才认证中心颁发入库证书
4:这个认证书并且可以归档倒地方
5:凡事获得留信网入网的信息将会逐步更新到个人身份内,将在公安局网内查询个人身份证信息后,同步读取人才网入库信息
6:个人职称评审加20分
7:个人信誉贷款加10分
8:在国家人才网主办的国家网络招聘大会中纳入资料,供国家高端企业选择人才
→ 【关于价格问题(保证一手价格)
我们所定的价格是非常合理的,而且我们现在做得单子大多数都是代理和回头客户介绍的所以一般现在有新的单子 我给客户的都是第一手的代理价格,因为我想坦诚对待大家 不想跟大家在价格方面浪费时间
对于老客户或者被老客户介绍过来的朋友,我们都会适当给一些优惠。
选择实体注册公司办理,更放心,更安全!我们的承诺:可来公司面谈,可签订合同,会陪同客户一起到教育部认证窗口递交认证材料,客户在教育部官方认证查询网站查询到认证通过结果后付款,不成功不收费!
办理(爱大毕业证)美国爱荷华大学毕业证学位证【微信:WP101A 】外观非常精致,由特殊纸质材料制成,上面印有校徽、校名、毕业生姓名、专业等信息。
办理(爱大毕业证)美国爱荷华大学毕业证学位证【微信:WP101A 】格式相对统一,各专业都有相应的模板。通常包括以下部分:
校徽:象征着学校的荣誉和传承。
校名:学校英文全称
授予学位:本部分将注明获得的具体学位名称。
毕业生姓名:这是最重要的信息之一,标志着该证书是由特定人员获得的。
颁发日期:这是毕业正式生效的时间,也代表着毕业生学业的结束。
其他信息:根据不同的专业和学位,可能会有一些特定的信息或章节。
办理(爱大毕业证)美国爱荷华大学毕业证学位证【微信:WP101A 】价值很高,需要妥善保管。一般来说,应放置在安全、干燥、防潮的地方,避免长时间暴露在阳光下。如需使用,最好使用复印件而不是原件,以免丢失。
综上所述,办理(爱大毕业证)美国爱荷华大学毕业证学位证【微信:WP101A 】是证明身份和学历的高价值文件。外观简单庄重,格式统一,包括重要的个人信息和发布日期。对持有人来说,妥善保管是非常重要的。
一比一原版马来西亚世纪大学毕业证成绩单一模一样
原件一模一样【微信:6496090】【马来西亚世纪大学毕业证学位证成绩单】【微信:6496090】(留信学历认证永久存档查询)采用学校原版纸张、特殊工艺完全按照原版一比一制作(包括:隐形水印,阴影底纹,钢印LOGO烫金烫银,LOGO烫金烫银复合重叠,文字图案浮雕,激光镭射,紫外荧光,温感,复印防伪)行业标杆!精益求精,诚心合作,真诚制作!多年品质 ,按需精细制作,24小时接单,全套进口原装设备,十五年致力于帮助留学生解决难题,业务范围有加拿大、英国、澳洲、韩国、美国、新加坡,新西兰等学历材料,包您满意。
【业务选择办理准则】
一、工作未确定,回国需先给父母、亲戚朋友看下文凭的情况,办理一份就读学校的毕业证【微信:6496090】文凭即可
二、回国进私企、外企、自己做生意的情况,这些单位是不查询毕业证真伪的,而且国内没有渠道去查询国外文凭的真假,也不需要提供真实教育部认证。鉴于此,办理一份毕业证【微信:6496090】即可
三、进国企,银行,事业单位,考公务员等等,这些单位是必需要提供真实教育部认证的,办理教育部认证所需资料众多且烦琐,所有材料您都必须提供原件,我们凭借丰富的经验,快捷的绿色通道帮您快速整合材料,让您少走弯路。
留信网认证的作用:
1:该专业认证可证明留学生真实身份【微信:6496090】
2:同时对留学生所学专业登记给予评定
3:国家专业人才认证中心颁发入库证书
4:这个认证书并且可以归档倒地方
5:凡事获得留信网入网的信息将会逐步更新到个人身份内,将在公安局网内查询个人身份证信息后,同步读取人才网入库信息
6:个人职称评审加20分
7:个人信誉贷款加10分
8:在国家人才网主办的国家网络招聘大会中纳入资料,供国家高端企业选择人才
→ 【关于价格问题(保证一手价格)
我们所定的价格是非常合理的,而且我们现在做得单子大多数都是代理和回头客户介绍的所以一般现在有新的单子 我给客户的都是第一手的代理价格,因为我想坦诚对待大家 不想跟大家在价格方面浪费时间
对于老客户或者被老客户介绍过来的朋友,我们都会适当给一些优惠。
选择实体注册公司办理,更放心,更安全!我们的承诺:可来公司面谈,可签订合同,会陪同客户一起到教育部认证窗口递交认证材料,客户在教育部官方认证查询网站查询到认证通过结果后付款,不成功不收费!
办理马来西亚世纪大学毕业证学位证【微信:6496090 】外观非常精致,由特殊纸质材料制成,上面印有校徽、校名、毕业生姓名、专业等信息。
办理马来西亚世纪大学毕业证学位证【微信:6496090 】格式相对统一,各专业都有相应的模板。通常包括以下部分:
校徽:象征着学校的荣誉和传承。
校名:学校英文全称
授予学位:本部分将注明获得的具体学位名称。
毕业生姓名:这是最重要的信息之一,标志着该证书是由特定人员获得的。
颁发日期:这是毕业正式生效的时间,也代表着毕业生学业的结束。
其他信息:根据不同的专业和学位,可能会有一些特定的信息或章节。
办理马来西亚世纪大学毕业证学位证【微信:6496090 】价值很高,需要妥善保管。一般来说,应放置在安全、干燥、防潮的地方,避免长时间暴露在阳光下。如需使用,最好使用复印件而不是原件,以免丢失。
综上所述,办理马来西亚世纪大学毕业证学位证【微信:6496090 】是证明身份和学历的高价值文件。外观简单庄重,格式统一,包括重要的个人信息和发布日期。对持有人来说,妥善保管是非常重要的。
一比一原版美国俄勒冈大学毕业证(UO,UofO学位证)如何办理
原件一模一样【微信:WP101A】【美国俄勒冈大学毕业证(UO,UofO学位证)成绩单】【微信:WP101A】(留信学历认证永久存档查询)采用学校原版纸张、特殊工艺完全按照原版一比一制作(包括:隐形水印,阴影底纹,钢印LOGO烫金烫银,LOGO烫金烫银复合重叠,文字图案浮雕,激光镭射,紫外荧光,温感,复印防伪)行业标杆!精益求精,诚心合作,真诚制作!多年品质 ,按需精细制作,24小时接单,全套进口原装设备,十五年致力于帮助留学生解决难题,业务范围有加拿大、英国、澳洲、韩国、美国、新加坡,新西兰等学历材料,包您满意。
【业务选择办理准则】
一、工作未确定,回国需先给父母、亲戚朋友看下文凭的情况,办理一份就读学校的毕业证【微信:WP101A】文凭即可
二、回国进私企、外企、自己做生意的情况,这些单位是不查询毕业证真伪的,而且国内没有渠道去查询国外文凭的真假,也不需要提供真实教育部认证。鉴于此,办理一份毕业证【微信:WP101A】即可
三、进国企,银行,事业单位,考公务员等等,这些单位是必需要提供真实教育部认证的,办理教育部认证所需资料众多且烦琐,所有材料您都必须提供原件,我们凭借丰富的经验,快捷的绿色通道帮您快速整合材料,让您少走弯路。
留信网认证的作用:
1:该专业认证可证明留学生真实身份【微信:WP101A】
2:同时对留学生所学专业登记给予评定
3:国家专业人才认证中心颁发入库证书
4:这个认证书并且可以归档倒地方
5:凡事获得留信网入网的信息将会逐步更新到个人身份内,将在公安局网内查询个人身份证信息后,同步读取人才网入库信息
6:个人职称评审加20分
7:个人信誉贷款加10分
8:在国家人才网主办的国家网络招聘大会中纳入资料,供国家高端企业选择人才
→ 【关于价格问题(保证一手价格)
我们所定的价格是非常合理的,而且我们现在做得单子大多数都是代理和回头客户介绍的所以一般现在有新的单子 我给客户的都是第一手的代理价格,因为我想坦诚对待大家 不想跟大家在价格方面浪费时间
对于老客户或者被老客户介绍过来的朋友,我们都会适当给一些优惠。
选择实体注册公司办理,更放心,更安全!我们的承诺:可来公司面谈,可签订合同,会陪同客户一起到教育部认证窗口递交认证材料,客户在教育部官方认证查询网站查询到认证通过结果后付款,不成功不收费!
办理美国俄勒冈大学毕业证(UO,UofO学位证)学位证【微信:WP101A 】外观非常精致,由特殊纸质材料制成,上面印有校徽、校名、毕业生姓名、专业等信息。
办理美国俄勒冈大学毕业证(UO,UofO学位证)学位证【微信:WP101A 】格式相对统一,各专业都有相应的模板。通常包括以下部分:
校徽:象征着学校的荣誉和传承。
校名:学校英文全称
授予学位:本部分将注明获得的具体学位名称。
毕业生姓名:这是最重要的信息之一,标志着该证书是由特定人员获得的。
颁发日期:这是毕业正式生效的时间,也代表着毕业生学业的结束。
其他信息:根据不同的专业和学位,可能会有一些特定的信息或章节。
办理美国俄勒冈大学毕业证(UO,UofO学位证)学位证【微信:WP101A 】价值很高,需要妥善保管。一般来说,应放置在安全、干燥、防潮的地方,避免长时间暴露在阳光下。如需使用,最好使用复印件而不是原件,以免丢失。
综上所述,办理美国俄勒冈大学毕业证(UO,UofO学位证)学位证【微信:WP101A 】是证明身份和学历的高价值文件。外观简单庄重,格式统一,包括重要的个人信息和发布日期。对持有人来说,妥善保管是非常重要的。
一比一原版(lu毕业证书)英国拉夫堡大学毕业证如何办理
原版一模一样【微信:741003700 】【(lu毕业证书)英国拉夫堡大学毕业证成绩单】【微信:741003700 】学位证,留信认证(真实可查,永久存档)原件一模一样纸张工艺/offer、雅思、外壳等材料/诚信可靠,可直接看成品样本,帮您解决无法毕业带来的各种难题!外壳,原版制作,诚信可靠,可直接看成品样本。行业标杆!精益求精,诚心合作,真诚制作!多年品质 ,按需精细制作,24小时接单,全套进口原装设备。十五年致力于帮助留学生解决难题,包您满意。
本公司拥有海外各大学样板无数,能完美还原。
1:1完美还原海外各大学毕业材料上的工艺:水印,阴影底纹,钢印LOGO烫金烫银,LOGO烫金烫银复合重叠。文字图案浮雕、激光镭射、紫外荧光、温感、复印防伪等防伪工艺。材料咨询办理、认证咨询办理请加学历顾问Q/微741003700
【主营项目】
一.毕业证【q微741003700】成绩单、使馆认证、教育部认证、雅思托福成绩单、学生卡等!
二.真实使馆公证(即留学回国人员证明,不成功不收费)
三.真实教育部学历学位认证(教育部存档!教育部留服网站永久可查)
四.办理各国各大学文凭(一对一专业服务,可全程监控跟踪进度)
如果您处于以下几种情况:
◇在校期间,因各种原因未能顺利毕业……拿不到官方毕业证【q/微741003700】
◇面对父母的压力,希望尽快拿到;
◇不清楚认证流程以及材料该如何准备;
◇回国时间很长,忘记办理;
◇回国马上就要找工作,办给用人单位看;
◇企事业单位必须要求办理的
◇需要报考公务员、购买免税车、落转户口
◇申请留学生创业基金
留信网认证的作用:
1:该专业认证可证明留学生真实身份
2:同时对留学生所学专业登记给予评定
3:国家专业人才认证中心颁发入库证书
4:这个认证书并且可以归档倒地方
5:凡事获得留信网入网的信息将会逐步更新到个人身份内,将在公安局网内查询个人身份证信息后,同步读取人才网入库信息
6:个人职称评审加20分
7:个人信誉贷款加10分
8:在国家人才网主办的国家网络招聘大会中纳入资料,供国家高端企业选择人才
办理(lu毕业证书)英国拉夫堡大学毕业证【微信:741003700 】外观非常简单,由纸质材料制成,上面印有校徽、校名、毕业生姓名、专业等信息。
办理(lu毕业证书)英国拉夫堡大学毕业证【微信:741003700 】格式相对统一,各专业都有相应的模板。通常包括以下部分:
校徽:象征着学校的荣誉和传承。
校名:学校英文全称
授予学位:本部分将注明获得的具体学位名称。
毕业生姓名:这是最重要的信息之一,标志着该证书是由特定人员获得的。
颁发日期:这是毕业正式生效的时间,也代表着毕业生学业的结束。
其他信息:根据不同的专业和学位,可能会有一些特定的信息或章节。
办理(lu毕业证书)英国拉夫堡大学毕业证【微信:741003700 】价值很高,需要妥善保管。一般来说,应放置在安全、干燥、防潮的地方,避免长时间暴露在阳光下。如需使用,最好使用复印件而不是原件,以免丢失。
综上所述,办理(lu毕业证书)英国拉夫堡大学毕业证【微信:741003700 】是证明身份和学历的高价值文件。外观简单庄重,格式统一,包括重要的个人信息和发布日期。对持有人来说,妥善保管是非常重要的。
一比一原版南安普顿索伦特大学毕业证Southampton成绩单一模一样
原件一模一样【微信:6496090】【南安普顿索伦特大学毕业证Southampton学位证成绩单】【微信:6496090】(留信学历认证永久存档查询)采用学校原版纸张、特殊工艺完全按照原版一比一制作(包括:隐形水印,阴影底纹,钢印LOGO烫金烫银,LOGO烫金烫银复合重叠,文字图案浮雕,激光镭射,紫外荧光,温感,复印防伪)行业标杆!精益求精,诚心合作,真诚制作!多年品质 ,按需精细制作,24小时接单,全套进口原装设备,十五年致力于帮助留学生解决难题,业务范围有加拿大、英国、澳洲、韩国、美国、新加坡,新西兰等学历材料,包您满意。
【业务选择办理准则】
一、工作未确定,回国需先给父母、亲戚朋友看下文凭的情况,办理一份就读学校的毕业证【微信:6496090】文凭即可
二、回国进私企、外企、自己做生意的情况,这些单位是不查询毕业证真伪的,而且国内没有渠道去查询国外文凭的真假,也不需要提供真实教育部认证。鉴于此,办理一份毕业证【微信:6496090】即可
三、进国企,银行,事业单位,考公务员等等,这些单位是必需要提供真实教育部认证的,办理教育部认证所需资料众多且烦琐,所有材料您都必须提供原件,我们凭借丰富的经验,快捷的绿色通道帮您快速整合材料,让您少走弯路。
留信网认证的作用:
1:该专业认证可证明留学生真实身份【微信:6496090】
2:同时对留学生所学专业登记给予评定
3:国家专业人才认证中心颁发入库证书
4:这个认证书并且可以归档倒地方
5:凡事获得留信网入网的信息将会逐步更新到个人身份内,将在公安局网内查询个人身份证信息后,同步读取人才网入库信息
6:个人职称评审加20分
7:个人信誉贷款加10分
8:在国家人才网主办的国家网络招聘大会中纳入资料,供国家高端企业选择人才
→ 【关于价格问题(保证一手价格)
我们所定的价格是非常合理的,而且我们现在做得单子大多数都是代理和回头客户介绍的所以一般现在有新的单子 我给客户的都是第一手的代理价格,因为我想坦诚对待大家 不想跟大家在价格方面浪费时间
对于老客户或者被老客户介绍过来的朋友,我们都会适当给一些优惠。
选择实体注册公司办理,更放心,更安全!我们的承诺:可来公司面谈,可签订合同,会陪同客户一起到教育部认证窗口递交认证材料,客户在教育部官方认证查询网站查询到认证通过结果后付款,不成功不收费!
办理南安普顿索伦特大学毕业证Southampton学位证【微信:6496090 】外观非常精致,由特殊纸质材料制成,上面印有校徽、校名、毕业生姓名、专业等信息。
办理南安普顿索伦特大学毕业证Southampton学位证【微信:6496090 】格式相对统一,各专业都有相应的模板。通常包括以下部分:
校徽:象征着学校的荣誉和传承。
校名:学校英文全称
授予学位:本部分将注明获得的具体学位名称。
毕业生姓名:这是最重要的信息之一,标志着该证书是由特定人员获得的。
颁发日期:这是毕业正式生效的时间,也代表着毕业生学业的结束。
其他信息:根据不同的专业和学位,可能会有一些特定的信息或章节。
办理南安普顿索伦特大学毕业证Southampton学位证【微信:6496090 】价值很高,需要妥善保管。一般来说,应放置在安全、干燥、防潮的地方,避免长时间暴露在阳光下。如需使用,最好使用复印件而不是原件,以免丢失。
综上所述,办理南安普顿索伦特大学毕业证Southampton学位证【微信:6496090 】是证明身份和学历的高价值文件。外观简单庄重,格式统一,包括重要的个人信息和发布日期。对持有人来说,妥善保管是非常重要的。
一比一原版英国伦敦政治经济学院毕业证(LSE学位证)如何办理
原件一模一样【微信:WP101A】【英国伦敦政治经济学院毕业证(LSE学位证)学位证)成绩单】【微信:WP101A】(留信学历认证永久存档查询)采用学校原版纸张、特殊工艺完全按照原版一比一制作(包括:隐形水印,阴影底纹,钢印LOGO烫金烫银,LOGO烫金烫银复合重叠,文字图案浮雕,激光镭射,紫外荧光,温感,复印防伪)行业标杆!精益求精,诚心合作,真诚制作!多年品质 ,按需精细制作,24小时接单,全套进口原装设备,十五年致力于帮助留学生解决难题,业务范围有加拿大、英国、澳洲、韩国、美国、新加坡,新西兰等学历材料,包您满意。
【业务选择办理准则】
一、工作未确定,回国需先给父母、亲戚朋友看下文凭的情况,办理一份就读学校的毕业证【微信:WP101A】文凭即可
二、回国进私企、外企、自己做生意的情况,这些单位是不查询毕业证真伪的,而且国内没有渠道去查询国外文凭的真假,也不需要提供真实教育部认证。鉴于此,办理一份毕业证【微信:WP101A】即可
三、进国企,银行,事业单位,考公务员等等,这些单位是必需要提供真实教育部认证的,办理教育部认证所需资料众多且烦琐,所有材料您都必须提供原件,我们凭借丰富的经验,快捷的绿色通道帮您快速整合材料,让您少走弯路。
留信网认证的作用:
1:该专业认证可证明留学生真实身份【微信:WP101A】
2:同时对留学生所学专业登记给予评定
3:国家专业人才认证中心颁发入库证书
4:这个认证书并且可以归档倒地方
5:凡事获得留信网入网的信息将会逐步更新到个人身份内,将在公安局网内查询个人身份证信息后,同步读取人才网入库信息
6:个人职称评审加20分
7:个人信誉贷款加10分
8:在国家人才网主办的国家网络招聘大会中纳入资料,供国家高端企业选择人才
→ 【关于价格问题(保证一手价格)
我们所定的价格是非常合理的,而且我们现在做得单子大多数都是代理和回头客户介绍的所以一般现在有新的单子 我给客户的都是第一手的代理价格,因为我想坦诚对待大家 不想跟大家在价格方面浪费时间
对于老客户或者被老客户介绍过来的朋友,我们都会适当给一些优惠。
选择实体注册公司办理,更放心,更安全!我们的承诺:可来公司面谈,可签订合同,会陪同客户一起到教育部认证窗口递交认证材料,客户在教育部官方认证查询网站查询到认证通过结果后付款,不成功不收费!
办理英国伦敦政治经济学院毕业证(LSE学位证)学位证)学位证【微信:WP101A 】外观非常精致,由特殊纸质材料制成,上面印有校徽、校名、毕业生姓名、专业等信息。
办理英国伦敦政治经济学院毕业证(LSE学位证)学位证)学位证【微信:WP101A 】格式相对统一,各专业都有相应的模板。通常包括以下部分:
校徽:象征着学校的荣誉和传承。
校名:学校英文全称
授予学位:本部分将注明获得的具体学位名称。
毕业生姓名:这是最重要的信息之一,标志着该证书是由特定人员获得的。
颁发日期:这是毕业正式生效的时间,也代表着毕业生学业的结束。
其他信息:根据不同的专业和学位,可能会有一些特定的信息或章节。
办理英国伦敦政治经济学院毕业证(LSE学位证)学位证)学位证【微信:WP101A 】价值很高,需要妥善保管。一般来说,应放置在安全、干燥、防潮的地方,避免长时间暴露在阳光下。如需使用,最好使用复印件而不是原件,以免丢失。
综上所述,办理英国伦敦政治经济学院毕业证(LSE学位证)学位证)学位证【微信:WP101A 】是证明身份和学历的高价值文件。外观简单庄重,格式统一,包括重要的个人信息和发布日期。对持有人来说,妥善保管是非常重要的。
一比一原版(UWS毕业证)澳洲西悉尼大学毕业证如何办理
原件一模一样【微信:WP101A】【(UWS毕业证)澳洲西悉尼大学毕业证学位证成绩单】【微信:WP101A】(留信学历认证永久存档查询)采用学校原版纸张、特殊工艺完全按照原版一比一制作(包括:隐形水印,阴影底纹,钢印LOGO烫金烫银,LOGO烫金烫银复合重叠,文字图案浮雕,激光镭射,紫外荧光,温感,复印防伪)行业标杆!精益求精,诚心合作,真诚制作!多年品质 ,按需精细制作,24小时接单,全套进口原装设备,十五年致力于帮助留学生解决难题,业务范围有加拿大、英国、澳洲、韩国、美国、新加坡,新西兰等学历材料,包您满意。
【业务选择办理准则】
一、工作未确定,回国需先给父母、亲戚朋友看下文凭的情况,办理一份就读学校的毕业证【微信:WP101A】文凭即可
二、回国进私企、外企、自己做生意的情况,这些单位是不查询毕业证真伪的,而且国内没有渠道去查询国外文凭的真假,也不需要提供真实教育部认证。鉴于此,办理一份毕业证【微信:WP101A】即可
三、进国企,银行,事业单位,考公务员等等,这些单位是必需要提供真实教育部认证的,办理教育部认证所需资料众多且烦琐,所有材料您都必须提供原件,我们凭借丰富的经验,快捷的绿色通道帮您快速整合材料,让您少走弯路。
留信网认证的作用:
1:该专业认证可证明留学生真实身份【微信:WP101A】
2:同时对留学生所学专业登记给予评定
3:国家专业人才认证中心颁发入库证书
4:这个认证书并且可以归档倒地方
5:凡事获得留信网入网的信息将会逐步更新到个人身份内,将在公安局网内查询个人身份证信息后,同步读取人才网入库信息
6:个人职称评审加20分
7:个人信誉贷款加10分
8:在国家人才网主办的国家网络招聘大会中纳入资料,供国家高端企业选择人才
→ 【关于价格问题(保证一手价格)
我们所定的价格是非常合理的,而且我们现在做得单子大多数都是代理和回头客户介绍的所以一般现在有新的单子 我给客户的都是第一手的代理价格,因为我想坦诚对待大家 不想跟大家在价格方面浪费时间
对于老客户或者被老客户介绍过来的朋友,我们都会适当给一些优惠。
选择实体注册公司办理,更放心,更安全!我们的承诺:可来公司面谈,可签订合同,会陪同客户一起到教育部认证窗口递交认证材料,客户在教育部官方认证查询网站查询到认证通过结果后付款,不成功不收费!
办理(UWS毕业证)澳洲西悉尼大学毕业证学位证【微信:WP101A 】外观非常精致,由特殊纸质材料制成,上面印有校徽、校名、毕业生姓名、专业等信息。
办理(UWS毕业证)澳洲西悉尼大学毕业证学位证【微信:WP101A 】格式相对统一,各专业都有相应的模板。通常包括以下部分:
校徽:象征着学校的荣誉和传承。
校名:学校英文全称
授予学位:本部分将注明获得的具体学位名称。
毕业生姓名:这是最重要的信息之一,标志着该证书是由特定人员获得的。
颁发日期:这是毕业正式生效的时间,也代表着毕业生学业的结束。
其他信息:根据不同的专业和学位,可能会有一些特定的信息或章节。
办理(UWS毕业证)澳洲西悉尼大学毕业证学位证【微信:WP101A 】价值很高,需要妥善保管。一般来说,应放置在安全、干燥、防潮的地方,避免长时间暴露在阳光下。如需使用,最好使用复印件而不是原件,以免丢失。
综上所述,办理(UWS毕业证)澳洲西悉尼大学毕业证学位证【微信:WP101A 】是证明身份和学历的高价值文件。外观简单庄重,格式统一,包括重要的个人信息和发布日期。对持有人来说,妥善保管是非常重要的。
Recently uploaded (20)
Designing infographics
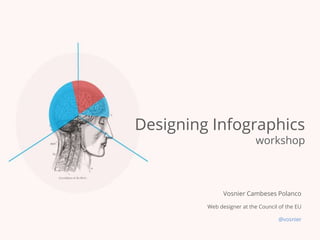
- 1. Designing Infographics workshop Vosnier Cambeses Polanco Web designer at the Council of the EU @vosnier
- 2. Let’s break the ice! # Who are you? # Where do you work? # Any concrete experience with infographics?
- 3. Summary #01 — What’s an Infographic #02 — Use cases #03 — What makes an effective infographic? #05 — Steps for creating an infographic #06 — Exercises #07 — Additional considerations #08 — Main takeaways
- 5. Infographics compile symbols and data visualisation with short-form text to tell a cohesive story “ Amy Balliet “
- 6. Data visualisation vs Infographics ISOTYPE 'The Great War' by Otto Neurath
- 8. Use cases # Explain a complex process # Illustrate a flow or relationship # Reinforce key points # Highlight an achievement # Support decision making
- 11. What makes an effective infographic?
- 13. An effective infographic... # tells a story # sends a key message # is visually appealing (Just like any other piece of communication)
- 14. An effective infographic tells story
- 15. Your brain on facts Human beings prefer narrative Your brain on stories Source: Digital Storytelling At Minneapolis Institute of Art
- 17. An effective infographic sends a key message Communicate from inside out Ask yourself: # WHY are you making this infographic? # WHY are you telling this to your audience? # WHY should anyone care? The Golden Circle, Simon Sinek
- 19. almost 50% of your brain is involved in visual processing An effective infographic is visual appealing
- 21. Steps for creating an infographic
- 22. Start with a briefing questionnaire # Who is your AUDIENCE? # What is your GOAL # What is your MESSAGE?
- 23. # Exercise: Instinctive critical evaluations Spend max. 30 sec assessing this infographic. What one word describes how you initially feel about it?
- 24. Define the tone and mood # The right tone of voice get you on board # Colour, typefaces and feeling is what they will see first, then the data.
- 25. The layout –make your key point stand out The attention filter (www.gapminder.org)
- 26. Create a visual hierarchy and a focal point
- 27. Keep it simple and use contrast to draw attention
- 28. Stick to common conventions and metaphors @xocasgv #DistractedBoyfriend
- 31. .. And use colour wisely The importance of colour (www.stephenwildish.co.uk)
- 32. # Exercise: Instinctive visual representations 3,2,1…
- 33. Exercise 2 – Infographics thinking Based on the information you’ve received: ➯ Define the audience and a call-to-action ➯ Define your core message and the mood ➯ Focus on what story you want to convey and what data will engage your audience. ➯ Create a rough sketch.
- 34. Gapminder Foundation - Will saving poor children lead to overpopulation?
- 35. Design for inclusion # Think about how users with specific accessibility needs will view it Source: cruxcollaborative.com
- 36. Test it! # User testing # Analytics # Heat maps # Google reverse search
- 37. Leave room for iterations # Information often need to be edited down to its most essential components # Collaboration between a content expert and a visual designer is key
- 38. # Variations that support the whole outreach # Print-friendly versions # Requests from users for a high-resolution version to be included in publications # Translations to other language Expect follow up requests:
- 39. Main takeaways # An infographic is a type of data visualization with specific goals. # An effective infographic tells a story, have a clear key message and is visually appealing # Know your audience and goals to get the right tone and mood # Start with a briefing questionnaire when planning for a infographic # Test it!
Editor's Notes
- https://www.gapminder.org/answers/will-saving-poor-children-lead-to-overpopulation/