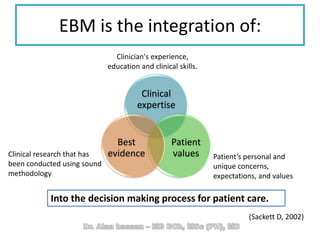
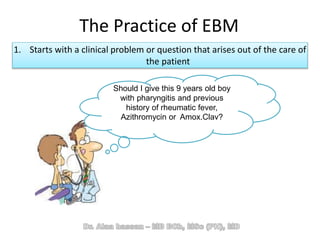
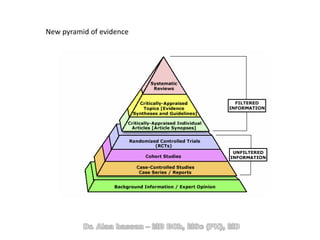
• Clinicians have been using the literature to
guide their decisions for a long time.
• The new focus on EBM "formalizes" that "old
hat" process and filters the literature so that
decisions are made based on "strong"
evidence
• EBM should be only one part of the decision
making process.
EBM is the integration of:
Clinical
expertise
Patient
values
Best
evidence
Into the decision making process for patient care.
Clinician's experience,
education and clinical skills.
Patient’s personal and
unique concerns,
expectations, and values
Clinical research that has
been conducted using sound
methodology
(Sackett D, 2002)
The Practice of EBM
1. Starts with a clinical problem or question that arises out of the care of
the patient
Should I give this 9 years old boy
with pharyngitis and previous
history of rheumatic fever,
Azithromycin or Amox.Clav?
2. Construct a well built clinical question derived from the case
Efficacy and safety of azithromycin versus Amox.
Clav. In treatment of Pharyngitis in children with
previous history of Rheumatic fever
3. Select the appropriate resource(s) and conduct a search
Pyramid of Evidence
Case Control Studies
Children with Congenital anomalies
Healthy Children
Thalidomide intake by mother
during Pregnancy
PresentPast
Observer
Cohort Study: Osteoporosis and Steroid Therapy
Steroid Users
Non- Steroid Users
(Osteoporosis)
Present Future
Observer
Give Drug (A) to a group of
patients and Drug (B) to
another group and Measure
Cure Rate in Each Group
Cure Rate
(A)
Cure Rate
(B)
80 %90 %
Select a Sample of patients
Fulfilling Inclusion/Exclusion
criteria
Allocate patients to two
comparison groups
Follow up patients in 2
groups
Compare cure rates in the 2
comparison groups
Inclusion / Exclusion criteria
Clinical Trials
(experimental)
4. Evaluate that evidence for its validity (closeness to the truth) and
applicability (usefulness in clinical practice)
•Is the study valid? Are those results for real?
•Can apply those results to my patient?
Randomized controlled trial states that Amox. Clav. Is as effective
as Azithromycin in treatment of Pharyngitis in children with
previous history of Rheumatic fever.
Title, Authors & Abstract
1. Introduction
2. Methods
3. Results
4. Discussion
The of the research report follows the Model.
This acronym stands for the major parts of the research report:
Conclusion , Recommendations
Strength and Weakness
of different parts of a clinical trial
1.Title&
Abstract
2.Introduction3.Methods4.Results5.Discussion6.Conclusion
1.Title&
Abstract
2.Introduction3.Methods4.Results5.Discussion6.Conclusion
, i.e. People who participated in
any of the following:
• Developing the idea
• Planning
• Conduction
• Reporting (Writing this paper)
of Each is given after his
name.
of each Investigator (Author) is
also Cited
1.Title&
Abstract
2.Introduction3.Methods4.Results5.Discussion6.Conclusion
• A of the whole study
• Follows the structure
• Read the abstract to Check of the
study to your work (Same patient type?, clinical
situation?)
• Use the abstract as a to guide you while
reading the whole paper and summarize main
results
1.Title&
Abstract
2.Introduction3.Methods4.Results5.Discussion6.Conclusion
1.Title&
Abstract
2.Introduction3.Methods4.Results5.Discussion6.Conclusion
Clearly stated objective: treatment, comparison, patient group
“What other research has been done addressing the same problem till now?”
“What is the Problem that the research will help to solve and why is it important”
1.Title&
Abstract
2.Introduction3.Methods4.Results5.Discussion6.Conclusion
1.Title&
Abstract
2.Introduction3.Methods4.Results5.Discussion6.Conclusion
• Present information concerning:
1.Title&
Abstract
2.Introduction3.Methods4.Results5.Discussion6.Conclusion
1.Title&
Abstract
2.Introduction3.Methods4.Results5.Discussion6.Conclusion
Sampling
A Sample is a portion, piece,
or segment regarded as
representative of a
whole.
Sample C
Sample A
Sample B
Sampling Frame
(Population)
Element
Issues with study sample:
Method of SelectionSample Size Study Sample
Inclusion & Exclusion
Criteria
Doubt
(p value)Power
Confidence
Sample Size
Inclusion and Exclusion Criteria
Who should keep out?
Exclusion Criteria
Who gets in?
Inclusion Criteria
•Children (5-12
years)
•Pahryngitis
diagnosed by
throat swab
•History of
Rheumatic
Fever
• Inclusion and exclusion criteria specifically
Describes the population that will be
represented in the study
• Any results cannot be extrapolated to other
populations
One Center
(Multicenter trials)
Hospitals (Centers)
Selected centers Recruited patients
Representative Sample
We can apply the results from our study to population
(all children with pharyngitis and previous history of rheumatic fever)
1.Title&
Abstract
2.Introduction3.Methods4.Results5.Discussion6.Conclusion
Need for controls
Controlled
Historical Controls Concurrent controls
Unmatched
Matched
(Paired)
Uncontrolled
Cases serve as their own
control
Compare pre # post
Alternative treatment To Controls
Alternative
treatment
to controls
Best
Available
Treatment
Placebo
No
Treatment
Allocation of Participants to treatment groups
Allocation
Random Allocation
(Randomization)
Simple
Randomization
(Completely Random
Design)
Block (Restricted)
Randomization
(Randomized Block
Design)
Stratified
Randomization
Cluster
Randomization
Non Random
Allocation
Minimization
Give treatment A Give Treatment B
Head Tail
2. Will he get treatment A or B cannot be predicted until the coin has been tossed.
For each patient recruited to the study a
coin is tossed
.1Patient has an equal chance of getting either treatment (Probability is
known (50/50)
Heads = Treatment A
Tails = Treatment B
1. Patients are randomized in groups of 4
2. Each 4 patients will be assigned to groups
according to one of the following arrangements
1. AABB
2. ABAB
3. ABBA
4. BBAA
5. BABA
6. BAAB
At a certain point both treatment groups may not be equal
In Simple Randomization
But , they will Eventually equalize at the end
In Block Randomization
The number of subjects in groups is closely balanced at all times
Blinding
Single
Blind
Double
Blind
Triple
Blind ???
Patient Patient + Doctor Patient + Doctor + Statistician
Parallel Design
Control Treatment
Test Treatment
Cross Over Design
Control Treatment Test Treatment
Control TreatmentTest Treatment
1.Title&
Abstract
2.Introduction3.Methods4.Results5.Discussion6.Conclusion
• Authors should clearly state what will be the study
end point.
• What will be the measure used to indicate response
to treatment,
1.Title&
Abstract
2.Introduction3.Methods4.Results5.Discussion6.Conclusion
e.g. Cure is a vague term, it should be clearly explained ..e.g.
Clinical or bacteriological..
If clinical cure is the end point, what are the criteria of clinical cure
If bacteriological cure is the end point, what will be the method used to
demonstrate it, Microscopic examination, Culture or immunologic
testing.
• The index of accomplishment determines
whether the results of the study are applicable to
the physician practice:
Bacteriological cure # Clinical cure
1.Title&
Abstract
2.Introduction3.Methods4.Results5.Discussion6.Conclusion
1.Title&
Abstract
2.Introduction3.Methods4.Results5.Discussion6.Conclusion
1.Title&
Abstract
2.Introduction3.Methods4.Results5.Discussion6.Conclusion
Statistical tests that were used
(α) level of significance
Power or its complement (β)
1.Title&
Abstract
2.Introduction3.Methods4.Results5.Discussion6.Conclusion
Cure Rate
(A)
Cure Rate
(B)
80 %90 %
The probability that the difference is due to chance (not real) is 4%
The percent of Doubt is 4%
Measure outcome
Calculate a statistical test of significance
(Chi square, t test)
Interpret P value
P value
0.04
•The Maximum Level of DOUBT you are willing to accept
•Should be set BEFORE conducting the study
•Level of significance
•The actual amount of DOUBT associated with the experiment
•The probability that the difference between treatment groups is DUE TO CHANCE
•Calculated AFTER conducting the study
P > α
Not Significant Significant
P < αMore doubt than Could be accepted Acceptable level of doubt
The difference is statistically
significant
The difference is not
statistically significant
•In clinical research we search for facts
•At best , we can ESTIMATE facts but we can also
quantify the doubt in our estimates
•Only god knows absolute facts
How do we calculate cure rates?
Intent-to-treat
Per protocol analysis
Per treatment received
Patients are considered as group A or B according to the group to which they have
been assigned by randomization
Only patients who comply with either treatment till end of study are counted
Patients are considered as group A or B according to the actual treatment they
received, even if they cross over from one group to another.
Univariate # Multivariate
analysis
Variable 1
Age
Variable 2
Systolic blood
Pressure
We analyze the association
between 2 variables
BP
Group 1
BP
Group 2
We compare one variable in 2
Different groups
We analyze the association between:
Several variables Called Independent variables (Age, Weight, BP, Blood Glucose and
gender)
CHDAge
Weight
Blood
Pressure
Blood
Glucose
Gender
And a single outcome variable called dependent Variable (CHD)
• Multivariate analysis allows controlling for
confounding variables
• Multivariate analysis techniques include:
– Multiple linear regression
– Logistic regression
Confidence Limits (CL)
Studied value
Confidence
intervalConfidence Level
You are 95% sure
that the actual
percent lies within
the range
Population true
Mean
Study
1
Study
2
Study
3
Study
4
Study
5
Narrow CL = More Precise Estimate
Wide CL = Less Precise Estimate
Incidence # Prevalence
Incidence rate =
The number of Newly occurring cases of a disease X 10n
Total population at risk of getting the disease
•Incidence rate is a measure of the risk of getting the disease
•If the incidence of influenza in a population is 10/1000 in a given year Then
each individual is at a 0.01 (10/1000) risk of getting influenza
•To measure the risk , the population should be followed for a period of time and
all cases occurring during that period of time recorded
•This can be done through a longitudinal prospective cohort study and hence the
name Incidence study
Prevalence rate=
The number of all old+ new cases of certain disease at a given point of time x 10n
The total number of population at the same point of time
Prevalence can be measured through an observational cross sectional study and
hence the name Prevalence study
Period of Observation
Healthy
Diseased
Person 1
Person 2
Person 3
Person 4
Person 5
Incidence Rate during the period of observation = 1 new case/ all population (5) X 100 =20%
Prevalence Rate During period of observation = 1new case + 2 old cases / all population (5) X
100 = 60%
Risk Ratio # Odds Ratio
analysis
• In a clinical trial to evaluate the efficacy and
safety of Azithromycin versus Amox. Clav. In
the treatment of pharyngitis, 70% of Amox.
Clav. Patients developed gastrointestinal
manifestations, while only 7% of Azithromycin
group developed those manifestations.
Incidence (risk) of GI symptoms among Azithromycin group= 70%
Incidence (risk) of GI symptoms among non Amox. Clav. group= 7%
70%
7%
The risk ratio of Acute bronchitis among smokers versus non smokers=
Risk Among Azithromycin group
Risk Among Amox. Clav. group
70
7
RR = 10
A Risk Ratio of 10 indicates that the risk of
developing GI symptoms among Amox.Clav group
is 10 times the risk among Azithromycin group.
RR= one:
•There is no relation between the exposure and the disease.
•The risk among exposed = Risk among non Exposed
RR > one :
•The risk among exposed > risk among non Exposed
R < one:
•There is a decrease risk among those exposed to the factor.
•The risk among exposed < risk among non exposed
7% 7%
10%
7%
7%
10%
• Odds Ratio is an ESTIMATE of Risk Ratio
• It is calculated in Case control, Cross sectional
Studies and clinical trials.
• In those types of studies , it is not possible to
calculate the risk directly and hence not
possible to calculate the risk ratio.
• It is interpreted as the risk ratio.
1.Title&
Abstract
2.Introduction3.Methods4.Results5.Discussion6.Conclusion
1. Interpret the results by stating the relationships between
the facts discovered and relating them to prior studies
2. Explain their clinical importance - Statistical significance
dismisses possibility that results could have occurred by
chance alone, It implies nothing about actual clinical
importance or significance of the results
3. Discuss study’s limitations in one of the last few
paragraphs prior to the conclusion. All studies potentially
have design flaws or other threats to validity of the
results.
4. Finally State the conclusions –Last paragraph of
Discussion - these must be justified by results and be
consistent with the study objectives.
5. Return to the patient -- integrate that evidence with clinical
expertise, patient preferences and apply it to practice
Once daily dose , 3 days course of
Azithromycin is preferred by patient
I will prescribe
Azithromycin
New pyramid of evidence

Evidence based medicine in clinical Practice

  • 2.
    • Clinicians havebeen using the literature to guide their decisions for a long time. • The new focus on EBM "formalizes" that "old hat" process and filters the literature so that decisions are made based on "strong" evidence • EBM should be only one part of the decision making process.
  • 3.
    EBM is theintegration of: Clinical expertise Patient values Best evidence Into the decision making process for patient care. Clinician's experience, education and clinical skills. Patient’s personal and unique concerns, expectations, and values Clinical research that has been conducted using sound methodology (Sackett D, 2002)
  • 4.
    The Practice ofEBM 1. Starts with a clinical problem or question that arises out of the care of the patient Should I give this 9 years old boy with pharyngitis and previous history of rheumatic fever, Azithromycin or Amox.Clav?
  • 5.
    2. Construct awell built clinical question derived from the case Efficacy and safety of azithromycin versus Amox. Clav. In treatment of Pharyngitis in children with previous history of Rheumatic fever
  • 6.
    3. Select theappropriate resource(s) and conduct a search
  • 7.
  • 8.
    Case Control Studies Childrenwith Congenital anomalies Healthy Children Thalidomide intake by mother during Pregnancy PresentPast Observer
  • 9.
    Cohort Study: Osteoporosisand Steroid Therapy Steroid Users Non- Steroid Users (Osteoporosis) Present Future Observer
  • 10.
    Give Drug (A)to a group of patients and Drug (B) to another group and Measure Cure Rate in Each Group Cure Rate (A) Cure Rate (B) 80 %90 % Select a Sample of patients Fulfilling Inclusion/Exclusion criteria Allocate patients to two comparison groups Follow up patients in 2 groups Compare cure rates in the 2 comparison groups Inclusion / Exclusion criteria Clinical Trials (experimental)
  • 11.
    4. Evaluate thatevidence for its validity (closeness to the truth) and applicability (usefulness in clinical practice) •Is the study valid? Are those results for real? •Can apply those results to my patient? Randomized controlled trial states that Amox. Clav. Is as effective as Azithromycin in treatment of Pharyngitis in children with previous history of Rheumatic fever.
  • 12.
    Title, Authors &Abstract 1. Introduction 2. Methods 3. Results 4. Discussion The of the research report follows the Model. This acronym stands for the major parts of the research report: Conclusion , Recommendations
  • 13.
    Strength and Weakness ofdifferent parts of a clinical trial
  • 14.
  • 15.
  • 16.
    , i.e. Peoplewho participated in any of the following: • Developing the idea • Planning • Conduction • Reporting (Writing this paper) of Each is given after his name. of each Investigator (Author) is also Cited 1.Title& Abstract 2.Introduction3.Methods4.Results5.Discussion6.Conclusion
  • 17.
    • A ofthe whole study • Follows the structure • Read the abstract to Check of the study to your work (Same patient type?, clinical situation?) • Use the abstract as a to guide you while reading the whole paper and summarize main results 1.Title& Abstract 2.Introduction3.Methods4.Results5.Discussion6.Conclusion
  • 18.
  • 19.
    Clearly stated objective:treatment, comparison, patient group “What other research has been done addressing the same problem till now?” “What is the Problem that the research will help to solve and why is it important” 1.Title& Abstract 2.Introduction3.Methods4.Results5.Discussion6.Conclusion
  • 20.
  • 21.
    • Present informationconcerning: 1.Title& Abstract 2.Introduction3.Methods4.Results5.Discussion6.Conclusion
  • 22.
  • 23.
    Sampling A Sample isa portion, piece, or segment regarded as representative of a whole.
  • 24.
    Sample C Sample A SampleB Sampling Frame (Population) Element
  • 25.
    Issues with studysample: Method of SelectionSample Size Study Sample Inclusion & Exclusion Criteria
  • 27.
  • 29.
    Inclusion and ExclusionCriteria Who should keep out? Exclusion Criteria Who gets in? Inclusion Criteria •Children (5-12 years) •Pahryngitis diagnosed by throat swab •History of Rheumatic Fever
  • 30.
    • Inclusion andexclusion criteria specifically Describes the population that will be represented in the study • Any results cannot be extrapolated to other populations
  • 34.
  • 35.
  • 36.
    Representative Sample We canapply the results from our study to population (all children with pharyngitis and previous history of rheumatic fever)
  • 37.
  • 38.
    Need for controls Controlled HistoricalControls Concurrent controls Unmatched Matched (Paired) Uncontrolled Cases serve as their own control Compare pre # post
  • 39.
    Alternative treatment ToControls Alternative treatment to controls Best Available Treatment Placebo No Treatment
  • 40.
    Allocation of Participantsto treatment groups Allocation Random Allocation (Randomization) Simple Randomization (Completely Random Design) Block (Restricted) Randomization (Randomized Block Design) Stratified Randomization Cluster Randomization Non Random Allocation Minimization
  • 41.
    Give treatment AGive Treatment B Head Tail 2. Will he get treatment A or B cannot be predicted until the coin has been tossed. For each patient recruited to the study a coin is tossed .1Patient has an equal chance of getting either treatment (Probability is known (50/50) Heads = Treatment A Tails = Treatment B
  • 42.
    1. Patients arerandomized in groups of 4 2. Each 4 patients will be assigned to groups according to one of the following arrangements 1. AABB 2. ABAB 3. ABBA 4. BBAA 5. BABA 6. BAAB
  • 43.
    At a certainpoint both treatment groups may not be equal In Simple Randomization But , they will Eventually equalize at the end
  • 44.
    In Block Randomization Thenumber of subjects in groups is closely balanced at all times
  • 45.
  • 46.
  • 47.
    Cross Over Design ControlTreatment Test Treatment Control TreatmentTest Treatment
  • 48.
  • 49.
    • Authors shouldclearly state what will be the study end point. • What will be the measure used to indicate response to treatment, 1.Title& Abstract 2.Introduction3.Methods4.Results5.Discussion6.Conclusion e.g. Cure is a vague term, it should be clearly explained ..e.g. Clinical or bacteriological.. If clinical cure is the end point, what are the criteria of clinical cure If bacteriological cure is the end point, what will be the method used to demonstrate it, Microscopic examination, Culture or immunologic testing.
  • 50.
    • The indexof accomplishment determines whether the results of the study are applicable to the physician practice: Bacteriological cure # Clinical cure 1.Title& Abstract 2.Introduction3.Methods4.Results5.Discussion6.Conclusion
  • 51.
  • 52.
    1.Title& Abstract 2.Introduction3.Methods4.Results5.Discussion6.Conclusion Statistical tests thatwere used (α) level of significance Power or its complement (β)
  • 53.
  • 54.
    Cure Rate (A) Cure Rate (B) 80%90 % The probability that the difference is due to chance (not real) is 4% The percent of Doubt is 4% Measure outcome Calculate a statistical test of significance (Chi square, t test) Interpret P value P value 0.04
  • 55.
    •The Maximum Levelof DOUBT you are willing to accept •Should be set BEFORE conducting the study •Level of significance •The actual amount of DOUBT associated with the experiment •The probability that the difference between treatment groups is DUE TO CHANCE •Calculated AFTER conducting the study
  • 56.
    P > α NotSignificant Significant P < αMore doubt than Could be accepted Acceptable level of doubt The difference is statistically significant The difference is not statistically significant
  • 57.
    •In clinical researchwe search for facts •At best , we can ESTIMATE facts but we can also quantify the doubt in our estimates •Only god knows absolute facts
  • 58.
    How do wecalculate cure rates? Intent-to-treat Per protocol analysis Per treatment received Patients are considered as group A or B according to the group to which they have been assigned by randomization Only patients who comply with either treatment till end of study are counted Patients are considered as group A or B according to the actual treatment they received, even if they cross over from one group to another.
  • 59.
  • 60.
    Variable 1 Age Variable 2 Systolicblood Pressure We analyze the association between 2 variables
  • 61.
    BP Group 1 BP Group 2 Wecompare one variable in 2 Different groups
  • 62.
    We analyze theassociation between: Several variables Called Independent variables (Age, Weight, BP, Blood Glucose and gender) CHDAge Weight Blood Pressure Blood Glucose Gender And a single outcome variable called dependent Variable (CHD)
  • 63.
    • Multivariate analysisallows controlling for confounding variables • Multivariate analysis techniques include: – Multiple linear regression – Logistic regression
  • 64.
  • 65.
    Studied value Confidence intervalConfidence Level Youare 95% sure that the actual percent lies within the range
  • 66.
    Population true Mean Study 1 Study 2 Study 3 Study 4 Study 5 Narrow CL= More Precise Estimate Wide CL = Less Precise Estimate
  • 67.
  • 68.
    Incidence rate = Thenumber of Newly occurring cases of a disease X 10n Total population at risk of getting the disease •Incidence rate is a measure of the risk of getting the disease •If the incidence of influenza in a population is 10/1000 in a given year Then each individual is at a 0.01 (10/1000) risk of getting influenza •To measure the risk , the population should be followed for a period of time and all cases occurring during that period of time recorded •This can be done through a longitudinal prospective cohort study and hence the name Incidence study
  • 69.
    Prevalence rate= The numberof all old+ new cases of certain disease at a given point of time x 10n The total number of population at the same point of time Prevalence can be measured through an observational cross sectional study and hence the name Prevalence study
  • 70.
    Period of Observation Healthy Diseased Person1 Person 2 Person 3 Person 4 Person 5 Incidence Rate during the period of observation = 1 new case/ all population (5) X 100 =20% Prevalence Rate During period of observation = 1new case + 2 old cases / all population (5) X 100 = 60%
  • 71.
    Risk Ratio #Odds Ratio analysis
  • 73.
    • In aclinical trial to evaluate the efficacy and safety of Azithromycin versus Amox. Clav. In the treatment of pharyngitis, 70% of Amox. Clav. Patients developed gastrointestinal manifestations, while only 7% of Azithromycin group developed those manifestations.
  • 74.
    Incidence (risk) ofGI symptoms among Azithromycin group= 70% Incidence (risk) of GI symptoms among non Amox. Clav. group= 7% 70% 7% The risk ratio of Acute bronchitis among smokers versus non smokers= Risk Among Azithromycin group Risk Among Amox. Clav. group 70 7 RR = 10 A Risk Ratio of 10 indicates that the risk of developing GI symptoms among Amox.Clav group is 10 times the risk among Azithromycin group.
  • 75.
    RR= one: •There isno relation between the exposure and the disease. •The risk among exposed = Risk among non Exposed RR > one : •The risk among exposed > risk among non Exposed R < one: •There is a decrease risk among those exposed to the factor. •The risk among exposed < risk among non exposed 7% 7% 10% 7% 7% 10%
  • 76.
    • Odds Ratiois an ESTIMATE of Risk Ratio • It is calculated in Case control, Cross sectional Studies and clinical trials. • In those types of studies , it is not possible to calculate the risk directly and hence not possible to calculate the risk ratio. • It is interpreted as the risk ratio.
  • 78.
  • 79.
    1. Interpret theresults by stating the relationships between the facts discovered and relating them to prior studies 2. Explain their clinical importance - Statistical significance dismisses possibility that results could have occurred by chance alone, It implies nothing about actual clinical importance or significance of the results 3. Discuss study’s limitations in one of the last few paragraphs prior to the conclusion. All studies potentially have design flaws or other threats to validity of the results. 4. Finally State the conclusions –Last paragraph of Discussion - these must be justified by results and be consistent with the study objectives.
  • 80.
    5. Return tothe patient -- integrate that evidence with clinical expertise, patient preferences and apply it to practice Once daily dose , 3 days course of Azithromycin is preferred by patient I will prescribe Azithromycin
  • 81.