Download to read offline
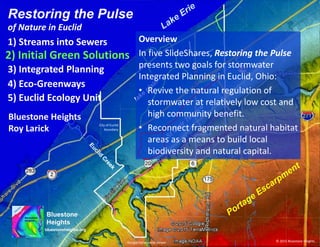


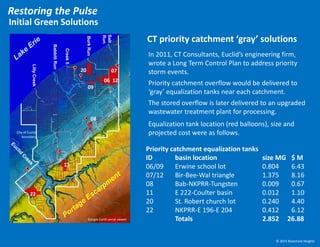


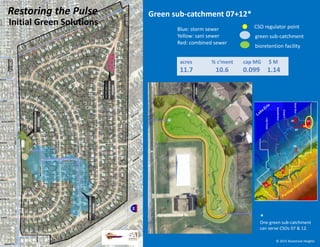
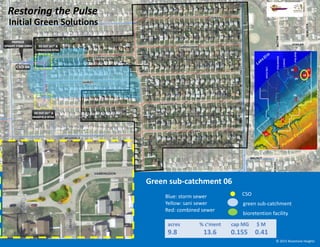
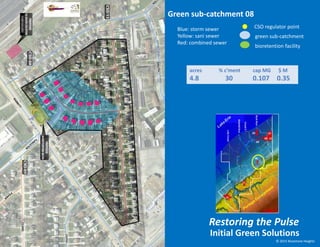
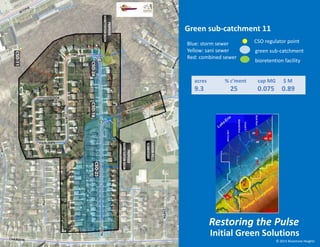
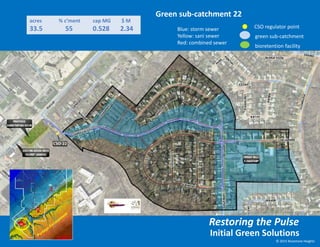
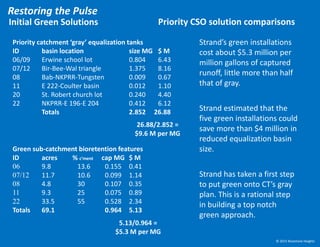


The document outlines the stormwater integrated planning initiatives in Euclid, Ohio, focusing on reviving natural stormwater regulation and enhancing local biodiversity. It details the existing combined sewer systems, the volume of stormwater overflow, and a proposed shift towards green infrastructure solutions, such as bio-retention basins, which are cost-effective alternatives to traditional gray solutions. The plan aims to meet EPA regulations by targeting priority catchments while improving neighborhood quality of life.


