The International Journal of Engineering & Science is aimed at providing a platform for researchers, engineers, scientists, or educators to publish their original research results, to exchange new ideas, to disseminate information in innovative designs, engineering experiences and technological skills. It is also the Journal's objective to promote engineering and technology education. All papers submitted to the Journal will be blind peer-reviewed. Only original articles will be published.
The papers for publication in The International Journal of Engineering& Science are selected through rigorous peer reviews to ensure originality, timeliness, relevance, and readability.
Theoretical work submitted to the Journal should be original in its motivation or modeling structure. Empirical analysis should be based on a theoretical framework and should be capable of replication. It is expected that all materials required for replication (including computer programs and data sets) should be available upon request to the authors.
The International Journal of Engineering & Science would take much care in making your article published without much delay with your kind cooperation.
Azure Monitor & Application Insight to monitor Infrastructure & Application
Â
A New Temperature-Based Model for Estimating Global Solar Radiation in Port-Harcourt, South-South Nigeria.
1. The International Journal Of Engineering And Science (IJES)
|| Volume || 4 || Issue || 1|| January - 2015 || Pages || 63-73||
ISSN (e): 2319 – 1813 ISSN (p): 2319 – 1805
www.theijes.com The IJES Page 63
A New Temperature-Based Model for Estimating Global Solar
Radiation in Port-Harcourt, South-South Nigeria.
D. O. Akpootu and Y. A. Sanusi.
Department of Physics, Usmanu Danfodiyo University, Sokoto, Nigeria.
-----------------------------------------------------ABSTRACT-----------------------------------------------------
In this paper, multiple linear temperature-based regression models were developed to estimate the monthly
mean daily global solar radiation on horizontal surfaces using maximum and minimum temperature parameters
over a period of twenty one years (1990-2010) for Port-Harcourt, Nigeria (Latitude 04.510
N, Longitude 07.010
E
and Altitude 19.5m above sea level). The values of the estimated global solar radiation by the models and that
of the measured were tested using the Mean Bias Error (MBE), Root Mean Square Error (RMSE), Mean
Percentage Error (MPE), t-test and the Nash-Sutcliffe equation (NSE) statistical techniques. The values of the
correlation coefficient ( ) and coefficient of determination ( ) were also determined for each of the models.
Based on the MPE results, good agreement was obtained between the estimated and measured
global solar radiation by all the developed models which suggest that the models could be employed in
estimating global solar radiation in the study site. The t-test also shows perfect model performance at and
confidence level for all the developed models. The equation with the highest values of , and NSE and
least value of RMSE which is reported to be recommended is given as
The developed model can be used for estimating global solar radiation in Port-Harcourt and other regions with
similar climatological information.
KEY WORDS: Global Solar Radiation, Coefficient of determination, Temperature, Developed models and
Port-Harcourt.
--------------------------------------------------------------------------------------------------------------------------------------
Date of Submission: 4 January 2015 Date of Accepted: 20 January 2015
-------------------------------------------------------------------------------------------------------------------------------------
I. INTRODUCTION
The energy transferred from the sun in the form of radiant to the earth’s surface is normally referred as
the global solar radiation. Solar radiation is the most important parameter in the design and evaluation of solar
energy devices. An accurate knowledge of solar radiation distribution at a particular geographical location is of
vital importance for surveys in agronomy, hydrology, meteorology, soil physics science, ecology and sizing of
the photovoltaic or thermal solar systems and estimates of their performances.The traditional way of knowing
the amount of global solar radiation (GSR) in a particular region is to install global solar radiation measuring
device (pyranometers) at as many locations as possible in this region thus requiring daily maintenance and data
recording, which increases the cost of GSR data collection. Therefore, it is rather more economical to develop
methods to estimate the GSR using climatological parameters (Kassem et al., 2009; Falayi et al., 2008; El-
Sebaii and Trabea, 2005).
Obviously, the best and most reliable solar radiation information is that obtained from daily
experimental measurements of the global and diffuse components of the solar insolation at the location in
question. Unfortunately, there are few meteorological stations conducting such measurements in developing
countries such as Nigeria, due to inability to afford the measuring equipment due to the cost or lack of trained
personnel to handle the measurement. Therefore, it is rather important to develop models to estimate the solar
radiation using the available weather parameters. Several empirical models have been developed to estimate the
global solar radiation using various meteorological parameters. Such models include that of Akpabio et al.
(2004), Gana and Akpootu (2013), Augustine and Nnabuchi (2009), Majnooni-Heris et al. (2014), Ituen et al.
(2012), Akpootu and Momoh (2014), Muzathik et al. (2011), Okonkwo and Nwokoye (2014), Ekwe et al.
(2014), Mfon et al. (2013), El- sabaii et al. (2005), and Ugwu and Ugwuanyi (2011) to mention but a few.
2. A New Temperature-Based Model For Estimating…
www.theijes.com The IJES Page 64
Basically, models developed to estimate global solar radiation based on different available meteorological data
are broadly categorized as cloud-based, sunshine duration-based (Angstrom, 1924, Prescott, 1940) and air
temperature-based (Bristow and Campbell, 1984).
The main goal of this study was the development of temperature based models for estimation of the
global solar radiation and selection of the best accurate model at Port-Harcourt station.
II. METHODOLOGY
The measured monthly average daily global solar radiation, maximum and minimum temperatures of
the study area were obtained from Nigeria Meteorological Agency (NIMET), Oshodi, Lagos, Nigeria. The data
covered a period of twenty one years (1990-2010) for Port-Harcourt located at Latitude 04.510
N, Longitude
07.010
E and Altitude 19.5m above sea level. Monthly averages over the twenty one years of the data in
preparation for correlation are presented in Table 1.
Extraterrestrial radiation is the maximum amount of solar radiation available to the Earth at the top of the
atmosphere. The monthly average daily extraterrestrial radiation on a horizontal surface ( ) can be calculated
for days giving average of each month (Iqbal, 1983; Zekai, 2008; Saidur et al., 2009) from the following
equation (Iqbal, 1983; Zekai, 2008):
(1)
where is the solar constant (=1367 Wm-2
), is the latitude of the site, is the solar declination and is the
mean sunrise hour angle for the given month and is the number of days of the year starting from of
January to of December.
The solar declination, and the mean sunrise hour angle, can be calculated using the following equation
(Iqbal, 1983; Zekai, 2008):
(2)
(3)
For a given month, the maximum possible sunshine duration (monthly average day length ( ) ) in hours can be
computed (Iqbal, 1983; Zekai, 2008) by
(4)
The clearness index ( ) is defined as the ratio of the observed/measured horizontal terrestrial solar
radiation , to the calculated/predicted/estimated horizontal extraterrestrial solar radiation . The clearness
index ( ) gives the percentage deflection by the sky of the incoming global solar radiation and therefore
indicates both level of availability of solar radiation and changes in atmospheric conditions in a given locality
(Falayi et al., 2011)
(5)
In this study, and were computed for each month using equations (1) and (4) respectively.
Hargreaves and Samani (1982) developed an empirical model that took the form of a linear regression between
the relative incoming solar radiation and the square root of the temperature difference as
(6)
where is the monthly average daily global solar radiation on a horizontal surface (MJ/m2
/day), is the
difference between the monthly average daily maximum and minimum temperatures, i.e., and
and are empirical coefficients to be determined by regression techniques.
The Garcia (1994) model is the only attempt made to estimate incoming solar radiation in Peru. The model is an
adaptation of the Angstrom-Prescott model given as
(7)
The Hargreaves and Samani (1982) and the Garcia (1994) models are both temperature based models as they
employ maximum and minimum temperatures (temperature range) as the required meteorological data.
The proposed models for this study in form of mathematical equations that relate the clearness index as the
dependent variable with the maximum and minimum temperatures as the independent variables are
3. A New Temperature-Based Model For Estimating…
www.theijes.com The IJES Page 65
(8)
(9)
Where is the monthly average daily temperature ratio, and is given as
(10)
Where is the mean temperature, and is given as
(11)
(12)
(13)
where , ……… , , ……… and …. are the regression coefficients and the other terms are the
correlated parameters. In this study, equations (6)…….equation (13) are models (1)………..model (8), where
equation (6) (model 1) and equation (7) (model 2) are the Hargreaves and Samani and Garcia models
respectively, while the developed models are equations (8)-(13) which implies models (3)-(8)
SPSS 16.0 Software Program was used in evaluating the model parameters. The values of the regression
coefficients obtained for Port-Harcourt were used to estimate the global solar radiation and compared with the
measured global solar radiation.
The accuracy of the estimated values was tested by computing the Mean Bias Error (MBE), Root Mean Square
Error (RMSE), Mean Percentage Error (MPE), t-test and the Nash-Sutcliffe equation (NSE). The expressions for
the MBE, RMSE and MPE as stated according to El-Sebaii and Trabea (2005) and are given as follows.
(14)
(15)
(16)
The t-test defined by student (Bevington, 1969) in one of the tests for mean values, the random variable t with n-
1 degrees of freedom may be written as follows.
(17)
The Nash-Sutcliffe equation (NSE) is given by the expression
(18)
From equations (14), (15), (16), (17) and (18) above , and are respectively the measured and
calculated values of daily global solar radiation and the total number of observations, while is the
mean measured global radiation. Iqbal (1983), Halouani et al. (1993), Almorox et al. (2005) and Che et al.
(2004) have recommended that a zero value for MBE is ideal and a low RMSE is desirable. Furthermore, the
smaller the value of the MBE and RMSE the better is the model’s performance. The RMSE test provides
information on the short-term performance of the studied model as it allows a term – by – term comparison of
the actual deviation between the calculated values and the measured values. The MPE test gives long term
performance of the examined regression equations, a positive MPE and MBE values provide the averages
amount of overestimation in the calculated values, while the negative values gives underestimation. For a better
model performance, a low value of MPE is desirable and the percentage error between and is
considered acceptable (Merges et al., 2006). The smaller the value of the better is the performance. To
determine whether a model’s estimates are statistically significant, one simply has to determine, from standard
statistical tables, the critical value, i.e., at level of significance and degrees of freedom. For the
model’s estimates to be judged statistically significant at the confidence level, the computed value
must be less than the critical value. A model is more efficient when is closer to 1 (Chen et al., 2004).
Similarly, for better data modelling, the coefficient of correlation and coefficient of determination should
approach 1 as closely as possible.
4. A New Temperature-Based Model For Estimating…
www.theijes.com The IJES Page 66
III. RESULTS AND DISCUSSION
Table 1: Meteorological Data and Global Solar Radiation for Port-Harcourt, Nigeria (1990-2010)
Month Tmax (0
C) Tmin (0
C) Hmea/Ho So (hrs)
Jan 32.9667 21.1571 0.5502 11.7703
Feb 33.6476 22.8714 0.5787 11.8569
Mar 33.2333 23.8810 0.5394 11.9748
Apr 32.7381 23.5381 0.5180 12.1011
May 31.8143 23.1571 0.5385 12.2055
Jun 30.5143 22.9333 0.5138 12.2568
Jul 28.9095 22.5048 0.4419 12.2328
Aug 28.6571 22.6143 0.4042 12.1428
Sep 29.4381 22.6476 0.4621 12.0211
Oct 30.3238 22.5619 0.5259 11.8950
Nov 31.4619 22.6286 0.6054 11.7916
Dec 32.1524 21.4714 0.5939 11.7430
Model 1 : The correlation of coefficient of 0.827 exists between the clearness index and the square root of the
monthly average daily temperature range also coefficient of determination of 0.684 which connotes 68.4% of
clearness index can be accounted for using the square root of the monthly average daily temperature range.
Therefore the monthly average daily global solar radiation on a horizontal surface for any month of the year in
Port-Harcourt can be predicted using equation (6) as
(19)
Feb Apr Jun Aug Oct Dec
0
2
4
6
8
10
12
14
16
18
20
22
MeasuredSR
PredictedSR
GlobalSolarRadiation(MJm
-2
day
-1
)
Month of the year
Figure 1: Comparison between the measured and predicted global solar radiation for model 1
Figure 1 shows the comparison between the measured and predicted global solar radiation using Hargreaves and
Samani model. It is clear from the figure that a good correlation exists between the measured and predicted
global solar radiation. However, the predicted global solar radiation overestimated the measured in the months
of January, March, April, July, August and September and is underestimated in the months of February, May,
June, October, November and December.
Model 2
The correlation of coefficient of 0.810 exists between the clearness index and the ratio of the monthly average
daily temperature range and the monthly average day length, also coefficient of determination of 0.656 which
connotes 65.6% of clearness index can be accounted for using the ratio of the monthly average daily
temperature range and the monthly average day length. Therefore the monthly average daily global solar
radiation on a horizontal surface for any month of the year in Port-Harcourt can be predicted using equation (7)
as
(20)
5. A New Temperature-Based Model For Estimating…
www.theijes.com The IJES Page 67
Feb Apr Jun Aug Oct Dec
0
2
4
6
8
10
12
14
16
18
20
22
MeasuredSR
PredictedSR
GlobalSolarRadiation(MJm
-2
day
-1
)
Month of the year
Figure 2: Comparison between the measured and predicted global solar radiation for model 2
Figure 2 shows the comparison between the measured and predicted global solar radiation using the Garcia
model. It is clear from the figure that a good correlation exists between the measured and predicted global solar
radiation. However, the predicted global solar radiation overestimated the measured in the months of January,
February, March, April, July, August and September and is underestimated in the months of May, June,
October, November and December.
Model 3 : The correlation of coefficient of 0.846 exists between the clearness index and the natural logarithm of
the monthly average daily temperature range, also coefficient of determination of 0.716 which connotes 71.6%
of clearness index can be accounted for using the natural logarithm of the monthly average daily temperature
range .Therefore the monthly average daily global solar radiation on a horizontal surface for any month of the
year in Port-Harcourt can be predicted using equation (8) as
(21)
Feb Apr Jun Aug Oct Dec
0
2
4
6
8
10
12
14
16
18
20
22
MeasuredSR
PredictedSR
GlobalSolarRadiation(MJm
-2
day
-1
)
Month of the year
Figure 3: Comparison between the measured and predicted global solar radiation for model 3
Figure 3 shows the comparison between the measured and predicted global solar radiation using model 3. It is
clear from the figure that a good correlation exists between the measured and predicted global solar radiation.
However, the predicted global solar radiation overestimated the measured in the months of January, March,
April, July, August and September and is underestimated in the months of February, May, June, October,
November and December.
Model 4 : The correlation of coefficient of 0.785 exists between the clearness index and the natural logarithm of
the monthly average daily temperature ratio, also coefficient of determination of 0.617 which connotes 61.7% of
clearness index can be accounted for using the natural logarithm of the monthly average daily temperature ratio
.Therefore the monthly average daily global solar radiation on a horizontal surface for any month of the year in
Port-Harcourt can be predicted using equation (9) as
(22)
6. A New Temperature-Based Model For Estimating…
www.theijes.com The IJES Page 68
Feb Apr Jun Aug Oct Dec
0
2
4
6
8
10
12
14
16
18
20
22
MeasuredSR
PredictedSR
GlobalSolarRadiation(MJm
-2
day
-1
)
Month of the year
Figure 4: Comparison between the measured and predicted global solar radiation for model 4
Figure 4 shows the comparison between the measured and predicted global solar radiation using model 4. It is
clear from the figure that a good correlation exists between the measured and predicted global solar radiation.
However, the predicted global solar radiation overestimated the measured in the months of January, April, July,
August and September and is underestimated in the months of February, March, May, June, October, November
and December.
Model 5 : The correlation of coefficient of 0.648 exists between the clearness index and the natural logarithm of
the mean temperature, also coefficient of determination of 0.420 which connotes 42.0% of clearness index can
be accounted for using the natural logarithm of the mean temperature .Therefore the monthly average daily
global solar radiation on a horizontal surface for any month of the year in Port-Harcourt can be predicted using
equation (10) as
(23)
Feb Apr Jun Aug Oct Dec
0
2
4
6
8
10
12
14
16
18
20
22
24
MeasuredSR
PredictedSR
GlobalSolarRadiation(MJm
-2
day
-1
)
Month of the year
Figure 5: Comparison between the measured and predicted global solar radiation for model 5
Figure 5 shows the comparison between the measured and predicted global solar radiation using model 5. It is
clear from the figure that a good correlation exists between the measured and predicted global solar radiation.
However, the predicted global solar radiation overestimated the measured in the months of March, April, May,
July, August and September and is underestimated in the months of January, February, June, October,
November and December.
Model 6
The correlation of coefficient of 0.868 exists between the clearness index and the natural logarithm of the
monthly average daily temperature range and the temperature ratio, also coefficient of determination of 0.753
which connotes 75.3% of clearness index can be accounted for using the natural logarithm of the monthly
average daily temperature range and the temperature ratio .Therefore the monthly average daily global solar
radiation on a horizontal surface for any month of the year in Port-Harcourt can be predicted using equation (11)
as
(24)
7. A New Temperature-Based Model For Estimating…
www.theijes.com The IJES Page 69
Feb Apr Jun Aug Oct Dec
0
2
4
6
8
10
12
14
16
18
20
22
MeasuredSR
PredictedSR
GlobalSolarRadiation(MJm
-2
day
-1
)
Month of the year
Figure 6: Comparison between the measured and predicted global solar radiation for model 6
Figure 6 shows the comparison between the measured and predicted global solar radiation using model 6. It is
clear from the figure that a good correlation exists between the measured and predicted global solar radiation.
However, the predicted global solar radiation overestimated the measured in the months of January, February,
March, April, July, August and September and is underestimated in the months of May, June, October,
November and December.
Model 7 : The correlation of coefficient of 0.847 exists between the clearness index and the natural logarithm of
the monthly average daily temperature range and the temperature mean, also coefficient of determination of
0.718 which connotes 71.8% of clearness index can be accounted for using the natural logarithm of the monthly
average daily temperature range and the temperature mean. Therefore the monthly average daily global solar
radiation on a horizontal surface for any month of the year in Port-Harcourt can be predicted using equation (12)
as
(25)
Feb Apr Jun Aug Oct Dec
0
2
4
6
8
10
12
14
16
18
20
22
MeasuredSR
PredictedSR
GlobalSolarRadiation(MJm
-2
day
-1
)
Month of the year
Figure 7: Comparison between the measured and predicted global solar radiation for model 7
Figure 7 shows the comparison between the measured and predicted global solar radiation using model 7. It is
clear from the figure that a good correlation exists between the measured and predicted global solar radiation.
However, the predicted global solar radiation overestimated the measured in the months of January, February,
March, April, July, August and September and is underestimated in the months May, June, October, November
and December.
Model 8 : The correlation of coefficient of 0.822 exists between the clearness index and the natural logarithm of
the monthly average daily temperature ratio and the temperature mean, also coefficient of determination of
0.675 which connotes 67.5% of clearness index can be accounted for using the natural logarithm of the monthly
average daily temperature ratio and the temperature mean. Therefore the monthly average daily global solar
radiation on a horizontal surface for any month of the year in Port-Harcourt can be predicted using equation (13)
as
(26)
8. A New Temperature-Based Model For Estimating…
www.theijes.com The IJES Page 70
Feb Apr Jun Aug Oct Dec
0
2
4
6
8
10
12
14
16
18
20
22
MeasuredSR
PredictedSR
GlobalSolarRadiation(MJm
-2
day
-1
)
Month of the year
Figure 8: Comparison between the measured and predicted global solar radiation for model 8
Figure 8 shows the comparison between the measured and predicted global solar radiation using model 8. It is
clear from the figure that a good correlation exists between the measured and predicted global solar radiation.
However, the predicted global solar radiation overestimated the measured in the months of January, February,
March, April, July, August and September and is underestimated in the months of May, June, October,
November and December.
Equations (19) - (26) are the developed models and are the predicted monthly average daily global solar
radiation.
Feb Apr Jun Aug Oct Dec
0
2
4
6
8
10
12
14
16
18
20
22
24
MeasuredSR Model1
Model2 Model3
Model4 Model5
Model6 Model7
Model8
GlobalSolarRadiation(MJm
-2
day
-1
)
Month of the year
Figure 9: Comparison between the measured and predicted global solar radiation for models (1-8)
Figure 9 shows the comparison between the measured and predicted global solar radiation for the eight (8)
models. The figure shows that all the predicted models underestimated the measured global solar radiation in the
months of June, October, November and December. However, all the predicted models overestimated the
measured in the months of July and August.
9. A New Temperature-Based Model For Estimating…
www.theijes.com The IJES Page 71
Feb Apr Jun Aug Oct Dec
0
2
4
6
8
10
12
14
16
18
20
22 MeasuredSR
GlobalSolarRadiation(MJm
-2
day
-1
)
Month of the year
Figure 10: graph of computed values of the global solar radiation for Port-Harcourt (1990-2010)
Figure 10 shows that high values of global solar radiation for Port-Harcourt was recorded during the dry season
and low values in the wet season. The highest amount of global solar radiation was obtained in the month of
November and the least in August.
Table 2: Comparison of measured and estimated global solar radiation for the different models for Port-
Harcourt (1990-2010)
Table 2 shows the comparison between the measured and estimated global solar radiation for the different
models for Port-Harcourt during the years (1990-2010). It shows that there is a favorable agreement between
them. Though, there are some underestimation and overestimation as depicted in figure 9.
Table 3: Validation of the models under different statistical tests.
Models R R2
MBE(MJm-2
day-1
) RMSE(MJm-2
day-1
) MPE(%) t NSE
1 0.827 0.684 -0.07500 1.15241 0.03579 0.21631 0.62540
2 0.810 0.656 -0.00401 1.20117 -0.39449 0.01106 0.59303
3 0.846 0.716 -0.08324 1.09275 0.12916 0.25339 0.66318
4 0.785 0.617 0.00160 1.26760 -0.49894 0.00419 0.54676
5 0.648 0.420 -0.00721 1.56976 -0.48876 0.01523 0.30494
6 0.868 0.753 0.02205 1.02488 -0.32927 0.07137 0.70372
7 0.847 0.718 -0.01097 1.08796 -0.24127 0.03345 0.66612
8 0.822 0.675 0.02702 1.17121 -0.48818 0.07653 0.61307
10. A New Temperature-Based Model For Estimating…
www.theijes.com The IJES Page 72
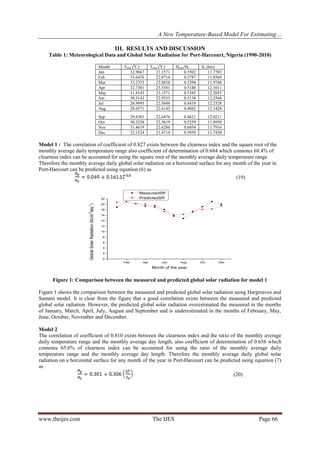
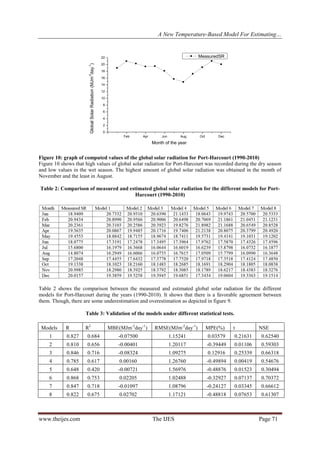
A close examination of table 3 shows the statistical tests adopted in this study to test the performance of the
models. It can seen from the table that the correlation coefficients, is within the range of 0.648 and 0.868
which indicate that a good fit exists between the measured and estimated global solar radiation data.Based on
the coefficient of correlation, coefficient of determination, and model 6 produces the highest value
thereby reported the best correlation and model 5 the least. For the MBE models 1, 2, 3, 5 and 7 indicate
underestimation in the estimated value and models 4 and 6 indicate overestimation in the estimated value.
However, model 4 produces the least value of MBE and is reported the best while model 3 produces the lowest
accuracy correlation model with slightly higher value of MBE.Based on RMSE, model 6 produces the least
value and is reported the best correlation model while model 5 gives the highest RMSE thereby reported the
lowest accuracy correlation model with slightly higher value of RMSE. Based on MPE models 2, 4, 5, 6, 7 and
8 indicate underestimation in the estimated value and model 1 and 3 indicate overestimated in the estimated
value. However, all the models performs better as they are within the acceptable range of and
with model 1 been the lowest and model 4 highest. The study site is statistically tested at the confidence
levels of significance of and . For the critical t-value, i.e., at α level of significance and degree of
freedom, the calculated t-value must be less than the critical value for
and for . It is shown that the values. The test
shows that all models are significant at and confidence levels.
IV. CONCLUSION
Knowledge of global solar radiation is indispensable for the proper and effective design and prediction
of the solar system performance. However, direct measuring is not available in many areas, therefore the need
for empirical equations become effective alternatives to predict global solar radiation through observed data. In
this study, eight temperature-based radiation prediction models were developed and evaluated for Port-Harcourt
station during a period of twenty one years (1990-2010) using observed maximum and minimum temperature
data. Based on the obtained results, model 6 was found the most accurate for the prediction of global solar
radiation in Port-Harcourt when compared to other developed models including the well-known existing
Hargreaves and Samani and Garcia models. Though, based on long time performance, model 4 and the
Hargreaves and Samani (model 1) stands as the best performing models. In this study, good agreement
was confirmed between measured and predicted values of global solar radiation for all the
evaluated models. Similarly, all models shows high significant at and confidence level.Conclusively,
a thorough inspection of the statistical test analysis, we can safely conclude that all the developed models give
reasonably degree of good fitting and correlation between the measured and predicted global solar radiation, as
such, can be use in predicting global solar radiation in Port-Harcourt. Though, slight differences were recorded
starting with model 6 in terms of ranking the best performing model.
III. ACKNOWLEDGEMENT
The authors are grateful to the management and staff of the Nigerian Meteorological Agency (NIMET),
Oshodi, Lagos for providing all the necessary data used in this study.
REFERENCES
[1] Akpabio, L. E., Udo, S. O and Etuk, S. E. (2004). Empirical correlation of Global Solar Radiation with Meteorological Data for
Onne, Nigeria. Turkish Journal of Physics, 28, 222-227.
[2] Akpootu, D. O. and Momoh, M. (2014). Empirical Model for Estimating Global Solar Radiation in Makurdi, Benue State,
North Central Nigeria. A paper presented at the 36th
Annual Nigerian Institute of Physics, National Conference, held at the
Department of Physics, University of Uyo, Nigeria on May 26-29, 2014.
[3] Almorox, J., Benito, M and Hontoria, C. (2005). Estimation of monthly Angstrom-Prescott Equation coefficients from measured
daily data in Toledo, Spain. Renewable Energy., 30, 931-936.
[4] Angstrom, A. (1924). Solar and terrestrial radiation. Quarterly Journal of the Royal Meteorological society., 50, 121-125.
[5] Augustine, C and Nnabuchi, M. N. (2009). Empirical Models for the Correlation of Global Solar Radiation with Meteorological
Data for Enugu, Nigeria. The Pacific Journal of Science and Technology., 10(1), 693-700.
[6] Bevington, P. R. (1969). Data reduction and error analysis for the physical sciences, first ed. McGraw Hill Book Co., New York.
[7] Bristow, K and Cambell, G. (1984). On the relationship between incoming solar radiation and daily maximum and minimum
temperature. Agricultural and Forest Meteorology., 31, 159-166.
[8] Chen, R., Ersi, K., Yang, J., Lu, S and Zhao, W. (2004). Validation of five global radiation Models with measured daily data in
China. Energy Conversion and Management., 45, 1759-1769.
[9] Ekwe, M. C., Joshua, J. K and Igwe, J.E. (2014). Estimation of Daily Global Irradiation at Owerri, Imo State (Nigeria) from
Hours of Sunshine, Minimum and Maximum Temperature and Relative Humidity. International Journal of Applied Research
and Studies., 3(3), 1-15.
[10] El-Sebaii, A and Trabea, A.(2005). Estimation of Global Solar Radiation on Horizontal Surfaces Over Egypt, Egypt. J. Solids,
28(1), 163-175.
11. A New Temperature-Based Model For Estimating…
www.theijes.com The IJES Page 73
[11] Falayi, E., Adepitan, J. and Rabiu, A.B. (2008). Empirical models for the correlation of Global solar radiation with
meteorological data for Iseyin, Nigeria, Physical Sciences, 3(9) 210- 216.
[12] Falayi, E. O., Rabiu, A. B and Teliat, R. O. (2011). Correlations to estimate monthly mean of daily diffuse solar radiation in
some selected cities in Nigeria, Pelagia Research Library., 2(4): 480-490.
[13] Gana, N. N and Akpootu, D. O. (2013). Angstrom Type Empirical Correlation for Estimating Global Solar Radiation in North-
Eastern Nigeria, The international Journal of Engineering And Science., 2(11): 58-78.
[14] Garcia, J. V. (1994). Principios F’isicos de la Climatolog’ia. Ediciones UNALM (Universidad Nacional Agraria La Molina:
Lima, Peru).
[15] Halouani, N., Nguyen, C. T and Vo-Ngoc, D. (1993). Calculation of monthly average solar radiation on horizontal surfaces using
daily hours of bright sunshine. Solar Energy., 50, 247-248.
[16] Hargreaves, G and Samani, Z. (1982). Estimating potential evapotranspiration. Journal of Irrigation and Drainage Engineering.
ASCE., 108, 225-230.
[17] Iqbal, M. (1983). An introduction to solar radiation, first ed. Academic Press, New York.
[18] Ituen, E. E., Esen, N. U., Nwokolo, S. C and Udo, E. G. (2012). Prediction of global solar Radiation using relative humidity,
maximum temperature and sunshine hours in Uyo, in The Niger Delta Region, Nigeria. Pelagia Research Library., 3(4), 1923-
1937.
[19] Kassem, A., Aboukarima, A. and El Ashmawy, N. (2009).Development of Neural Network Model to Estimate Hourly Total and
Diffuse Solar Radiation on Horizontal Surface at Alexandria City (Egypt), Journal of Applied Sciences Research, 5(11), 2006-
2015.
[20] Majnooni-Heris, A., Najafi, V., Bahadori, H and Sadraddini, A. A. (2014). Evaluation and Calibration of Sunshine based solar
radiation models for Tabriz, Iran. International Journal of Biosciences., 4(12), 27-34.
[21] Merges, H. O., Ertekin, C and Sonmete, M. H. (2006). Evaluation of global solar radiation Models for Konya, Turkey. Energy
Conversion and Management., 47, 3149-3173.
[22] Mfon D. U., Sunday, O. U and Ye-obong, N. U. (2013). Solar Radiation on Horizontal Surface Based on Sunshine Hours Over
Owerri, Nigeria. Asian Journal of Science and Technology., 4(10), 116-119.
[23] Muzathik, A. M., Nik, W. B. W., Ibrahim, M. Z., Samo, K. B., Sopian, K and Alghoul, M. A.(2011). Daily Global Solar
Radiation Estimate Based on Sunshine Hours. International Journal of Mechanical and Materials Engineering., 6(1), 75-80.
[24] Okonkwo, G. N and Nwokoye, A. O. C. (2014). Estimating Global Solar Radiation from Temperature Data in Minna Location.
European Scientific Journal., 10(15), 254-264.
[25] Prescott, J. A. (1940). Evaporation from water surface in relation to solar radiation, Transactions of the Royal Society of
Australia, 46: 114-118.
[26] Saidur, R., Masjuki, H. H and Hassanuzzaman, M. (2009). Performance of an Improved Solar car Ventilator,International
Journal of Mechanical and Materials Engineering., 4(1), 24-34.
[27] Ugwu, A. I and Ugwuanyi, J. U. (2011). Performance assessment of Hargreaves model in Estimating solar radiation in Abuja
using minimum climatological data. International Journal of the Physical Sciences., 6(31), 7285-7290.
[28] Zekai, S. (2008). Solar energy fundamentals and modeling techniques: atmosphere, Environment, climate change and renewable
energy, first ed. Springer, London.