Biology GCE O level syllabus: Transport system in Plants
Include: Xylem, Phloem, Entry of water into plant and so forth...
NOTE: PLEASE DOWNLOAD BECAUSE THERE ARE MANY ANIMATIONS THAT HIDE SOME OF THE CONTENTS
AS Level Biology - 1) Biological MoleculesArm Punyathorn
To understand Biology, one must first understand the basic chemistry of it - which is relatively simple as opposed to normal chemistry. All you have to know about is Carbohydrate, Lipid, Protein and Water.
A group of cells which are similar in Origin and function but of more than One type in structure.
Water conducting tissue
Along with phloem make vascular tissue
Provide support to plants
1)Tracheary elements
These are nonliving cells, provide support and conduct water. Two types,
(a)Tracheids: elongate, tube like cell, tapering, rounded or oval ends, hard lignified walls.
(b)Vessels members: long, cylindrical, tube-like structures with lignified walls.
(2)Fibres: thick walls, evolve from tracheids and provide mechanical strength. Two types,
(a)Fibre-tracheids: medium thickness walls, have reduced boardered pits.
(b)Libriform fibres: very thick walls, have reduced simple pits.
Parenchyma cells: living cells, in woody plants, store of food in starch form. Two types:
(a)Axial parenchyma: derived from fusiform initials, have tracheary elements and fibres.
(b)Ray parenchyma: derived from ray initials of cambium, xylem ray cells.
Developmentally, xylem have two types
(1)Primary xylem: derived from procambium, developing from embryo, non-woody plants.
(2)Secondary xylem: from vascular cambium, second stage of plant development, in woody plants.
I really need help drawing each stage of mitosis for the oni.pdfabhiehomeapp2002
I really need help drawing each stage of mitosis for the onion root tip in this. I also need help label
each drawing with these terms: terms: nucleus, nucleolus, chromatin, chromosomes, metaphase
plate, daughter chromosomes, and cell plate. (Not all of these structures will be found in all
stages).
Late prophase Metaphase Anaphase Telophase and cytokinesisLaboratory 14: Mitosis and Cell
Division in onion root tips Cells are the basis for life, and they must reproduce for life to continue.
Cells reproduce by a process called cellular reproduction, or cell division. Cell division occurs in all
living organisms as they grow, repair, and reproduce. Bacteria, the simplest living things,
reproduce by a process called binary fission. In binary fission, the bacterium's single chromosome
is duplicated (replicated), the two chromosomes are separated, and then the plasma membrane
and cell wall grow inward, dividing the cell in two. Higher organisms like animals, plants, and fungi,
have many chromosomes, and have a more complex form of cell division. The chromosomes must
first be replicated (copied) and then they must be divided up into two perfectly identical sets or
groups. Only after production of two identical sets of genetic information can the cell successfully
divide. The formation of two identical sets of genetic information (two separate nuclei) is called
mitosis. The division of the cytoplasm is called cytokinesis. Cell division occurs once during the
"lifetime" of a cell, or what is called the cell cycle. The cell cycle has two phases, which are called
interphase and the mitotic phase. Interphase is a period where little cellular activity can be seen,
and most of a cell's lifetime is spent in this phase. However, in a cell that is preparing to divide,
interphase becomes a time in which the cell's DNA molecules (its chromosomes) are replicated,
the cell increases its supply of proteins, and the number of cellular organelles is increased. The
mitotic phase has two events: mitosis and cytokinesis. Mitosis is the process in which the cell
nucleus and its contents (most importantly the chromosomes) are divided and evenly packaged
into two identical daughter nuclei. During cytokinesis, the cell's cytoplasm is divided in two. When
the mitotic phase ends, there are two identical cells present where only one existed before (pages
179-182, A Guide to the Natural World).The Cell Cycle The term cell cycle is used to describe the
life history of living cells. It consists of interphase and the mitotic phase. Interphase cells that are
going to divide increase their cell contents and replicate their chromosomes. Mitotic cells have
completed interphase and are in the process of forming identical daughter nuclei (mitosis) and
dividing the cell's cytoplasm into two separate cells (cytokinesis). Interphase The cell cycle is
divided into phases, even though it is really a continuous process. Interphase has three phases:
G1, S, and G2. During interphase, DNA, with .
Homecell divisionCell division
Cell division
Miller November 05, 2022
Every living organism depends on the growth and multiplication of its cells for growth and development because a multicellular organism begins as a single cell and undergoes repeated division. The characteristic trait of all living things is an increase in cell size brought on by growth. The cell starts to divide once its growth has reached its maximum. An organism grows vegetatively when its number of cells increases through cell divisions that follow a geometric progression. The three stages of cell division, which is a continuous and dynamic process, are as follows:
Replicating the genome or DNA
Karyokinesis, or nuclear division
Cytokinesis, also known as cell division
Based on the number of genomes present in the daughter cells in comparison to the dividing parent cell, there are two types of cell division: mitosis and meiosis.
1. Mitosis- W. Flemming first used the word mitosis in 1882. Mitosis, also known as somatic division, is the process by which a body cell divides into two daughter cells, each of equal size and with the same number of chromosomes as the parent cell.
2. Meiosis- J. Meiosis was the first to use the term. B. Farmer and J. Smith in 1905 Moore, E. Only the gonads (germ mother cells) undergo meiosis during the development of gametes like sperm and ovum. Meiosis is the process by which chromosomes go from having two copies, or 2N or diploid, to having only one copy, or N or haploid. Additionally known as the reduction process. Every cell that is able to divide undergoes a regular cycle of alterations known as the cell cycle. A cell is diploid when it begins its cycle.
Phases of cell cycle
The cell cycle has two phases: the long interphase, also known as Iphase, and the short mitotic, also known as M-phase, phases. 1. Interphase-
The interphase is the period of time between telophase's conclusion and the start of the following Mphase. The stage is long and complicated, lasting between 10 and 30 hours. The cell develops during this phase by producing biological molecules like lipids, proteins, carbohydrates, and nucleic acids.
First gap, also known as the G1 phase, second gap, also known as the G2 phase, and synthetic phase make up the interphase.
(i) G1 phase- The G1 phase represents the duration between the previous mitosis and the start of DNA synthesis. During this phase, a newly formed cell begins to grow. During this stage, a wide range of biological molecules—including RNAs, proteins, lipids, and some non-histones—are created.
In order to prepare for the DNA replication that will occur next to it, normal metabolism is carried out. This phase does not involve DNA synthesis. (ii) S Phase- Each chromosome is duplicated during this phase by replicating new DNA molecules using the existing DNA as a template. Only in S-phase do histone protein and their mRNA, some non-histone protein, and new nucleosome formation take place. Most eukary
This pdf is about the Schizophrenia.
For more details visit on YouTube; @SELF-EXPLANATORY;
https://www.youtube.com/channel/UCAiarMZDNhe1A3Rnpr_WkzA/videos
Thanks...!
What is greenhouse gasses and how many gasses are there to affect the Earth.moosaasad1975
What are greenhouse gasses how they affect the earth and its environment what is the future of the environment and earth how the weather and the climate effects.
Seminar of U.V. Spectroscopy by SAMIR PANDASAMIR PANDA
Spectroscopy is a branch of science dealing the study of interaction of electromagnetic radiation with matter.
Ultraviolet-visible spectroscopy refers to absorption spectroscopy or reflect spectroscopy in the UV-VIS spectral region.
Ultraviolet-visible spectroscopy is an analytical method that can measure the amount of light received by the analyte.
Observation of Io’s Resurfacing via Plume Deposition Using Ground-based Adapt...Sérgio Sacani
Since volcanic activity was first discovered on Io from Voyager images in 1979, changes
on Io’s surface have been monitored from both spacecraft and ground-based telescopes.
Here, we present the highest spatial resolution images of Io ever obtained from a groundbased telescope. These images, acquired by the SHARK-VIS instrument on the Large
Binocular Telescope, show evidence of a major resurfacing event on Io’s trailing hemisphere. When compared to the most recent spacecraft images, the SHARK-VIS images
show that a plume deposit from a powerful eruption at Pillan Patera has covered part
of the long-lived Pele plume deposit. Although this type of resurfacing event may be common on Io, few have been detected due to the rarity of spacecraft visits and the previously low spatial resolution available from Earth-based telescopes. The SHARK-VIS instrument ushers in a new era of high resolution imaging of Io’s surface using adaptive
optics at visible wavelengths.
Introduction:
RNA interference (RNAi) or Post-Transcriptional Gene Silencing (PTGS) is an important biological process for modulating eukaryotic gene expression.
It is highly conserved process of posttranscriptional gene silencing by which double stranded RNA (dsRNA) causes sequence-specific degradation of mRNA sequences.
dsRNA-induced gene silencing (RNAi) is reported in a wide range of eukaryotes ranging from worms, insects, mammals and plants.
This process mediates resistance to both endogenous parasitic and exogenous pathogenic nucleic acids, and regulates the expression of protein-coding genes.
What are small ncRNAs?
micro RNA (miRNA)
short interfering RNA (siRNA)
Properties of small non-coding RNA:
Involved in silencing mRNA transcripts.
Called “small” because they are usually only about 21-24 nucleotides long.
Synthesized by first cutting up longer precursor sequences (like the 61nt one that Lee discovered).
Silence an mRNA by base pairing with some sequence on the mRNA.
Discovery of siRNA?
The first small RNA:
In 1993 Rosalind Lee (Victor Ambros lab) was studying a non- coding gene in C. elegans, lin-4, that was involved in silencing of another gene, lin-14, at the appropriate time in the
development of the worm C. elegans.
Two small transcripts of lin-4 (22nt and 61nt) were found to be complementary to a sequence in the 3' UTR of lin-14.
Because lin-4 encoded no protein, she deduced that it must be these transcripts that are causing the silencing by RNA-RNA interactions.
Types of RNAi ( non coding RNA)
MiRNA
Length (23-25 nt)
Trans acting
Binds with target MRNA in mismatch
Translation inhibition
Si RNA
Length 21 nt.
Cis acting
Bind with target Mrna in perfect complementary sequence
Piwi-RNA
Length ; 25 to 36 nt.
Expressed in Germ Cells
Regulates trnasposomes activity
MECHANISM OF RNAI:
First the double-stranded RNA teams up with a protein complex named Dicer, which cuts the long RNA into short pieces.
Then another protein complex called RISC (RNA-induced silencing complex) discards one of the two RNA strands.
The RISC-docked, single-stranded RNA then pairs with the homologous mRNA and destroys it.
THE RISC COMPLEX:
RISC is large(>500kD) RNA multi- protein Binding complex which triggers MRNA degradation in response to MRNA
Unwinding of double stranded Si RNA by ATP independent Helicase
Active component of RISC is Ago proteins( ENDONUCLEASE) which cleave target MRNA.
DICER: endonuclease (RNase Family III)
Argonaute: Central Component of the RNA-Induced Silencing Complex (RISC)
One strand of the dsRNA produced by Dicer is retained in the RISC complex in association with Argonaute
ARGONAUTE PROTEIN :
1.PAZ(PIWI/Argonaute/ Zwille)- Recognition of target MRNA
2.PIWI (p-element induced wimpy Testis)- breaks Phosphodiester bond of mRNA.)RNAse H activity.
MiRNA:
The Double-stranded RNAs are naturally produced in eukaryotic cells during development, and they have a key role in regulating gene expression .
(May 29th, 2024) Advancements in Intravital Microscopy- Insights for Preclini...Scintica Instrumentation
Intravital microscopy (IVM) is a powerful tool utilized to study cellular behavior over time and space in vivo. Much of our understanding of cell biology has been accomplished using various in vitro and ex vivo methods; however, these studies do not necessarily reflect the natural dynamics of biological processes. Unlike traditional cell culture or fixed tissue imaging, IVM allows for the ultra-fast high-resolution imaging of cellular processes over time and space and were studied in its natural environment. Real-time visualization of biological processes in the context of an intact organism helps maintain physiological relevance and provide insights into the progression of disease, response to treatments or developmental processes.
In this webinar we give an overview of advanced applications of the IVM system in preclinical research. IVIM technology is a provider of all-in-one intravital microscopy systems and solutions optimized for in vivo imaging of live animal models at sub-micron resolution. The system’s unique features and user-friendly software enables researchers to probe fast dynamic biological processes such as immune cell tracking, cell-cell interaction as well as vascularization and tumor metastasis with exceptional detail. This webinar will also give an overview of IVM being utilized in drug development, offering a view into the intricate interaction between drugs/nanoparticles and tissues in vivo and allows for the evaluation of therapeutic intervention in a variety of tissues and organs. This interdisciplinary collaboration continues to drive the advancements of novel therapeutic strategies.
Cancer cell metabolism: special Reference to Lactate PathwayAADYARAJPANDEY1
Normal Cell Metabolism:
Cellular respiration describes the series of steps that cells use to break down sugar and other chemicals to get the energy we need to function.
Energy is stored in the bonds of glucose and when glucose is broken down, much of that energy is released.
Cell utilize energy in the form of ATP.
The first step of respiration is called glycolysis. In a series of steps, glycolysis breaks glucose into two smaller molecules - a chemical called pyruvate. A small amount of ATP is formed during this process.
Most healthy cells continue the breakdown in a second process, called the Kreb's cycle. The Kreb's cycle allows cells to “burn” the pyruvates made in glycolysis to get more ATP.
The last step in the breakdown of glucose is called oxidative phosphorylation (Ox-Phos).
It takes place in specialized cell structures called mitochondria. This process produces a large amount of ATP. Importantly, cells need oxygen to complete oxidative phosphorylation.
If a cell completes only glycolysis, only 2 molecules of ATP are made per glucose. However, if the cell completes the entire respiration process (glycolysis - Kreb's - oxidative phosphorylation), about 36 molecules of ATP are created, giving it much more energy to use.
IN CANCER CELL:
Unlike healthy cells that "burn" the entire molecule of sugar to capture a large amount of energy as ATP, cancer cells are wasteful.
Cancer cells only partially break down sugar molecules. They overuse the first step of respiration, glycolysis. They frequently do not complete the second step, oxidative phosphorylation.
This results in only 2 molecules of ATP per each glucose molecule instead of the 36 or so ATPs healthy cells gain. As a result, cancer cells need to use a lot more sugar molecules to get enough energy to survive.
introduction to WARBERG PHENOMENA:
WARBURG EFFECT Usually, cancer cells are highly glycolytic (glucose addiction) and take up more glucose than do normal cells from outside.
Otto Heinrich Warburg (; 8 October 1883 – 1 August 1970) In 1931 was awarded the Nobel Prize in Physiology for his "discovery of the nature and mode of action of the respiratory enzyme.
WARNBURG EFFECT : cancer cells under aerobic (well-oxygenated) conditions to metabolize glucose to lactate (aerobic glycolysis) is known as the Warburg effect. Warburg made the observation that tumor slices consume glucose and secrete lactate at a higher rate than normal tissues.
Cancer cell metabolism: special Reference to Lactate Pathway
Estimating the-time-needed-for-mitosis
1. Estimating the Time Needed for Mitosis
INTRODUCTION
In this lab, you will determine the approximate time it takes for plant and animal cells to pass
through each of the four stages of mitosis. You will do this by counting the number of onion root
tip cells and whitefish blastula cells in each of the four phases of mitosis and in interphase.
Many cells in one specific phase indicate that a long period of time is required for completion of
that phase. Few cells in a specific phase indicate a short period of time is required for
completion of that phase.
Mitosis, also called karyokinesis, is division of the nucleus and its chromosomes. It is followed
by division of the cytoplasm known as cytokinesis. Both mitosis and cytokinesis are parts of the
life of a cell called the cell cycle. Most of the life of a cell is spent in a non-dividing phase called
Interphase. Interphase includes G1 stage in which the newly divided cells grow in size, S stage
in which the number of chromosomes is doubled and appears as chromatin, and G2 stage where
the cell makes the enzymes and other cellular materials needed for mitosis.
Mitosis has four major stages – Prophase, Metaphase, Anaphase, and Telophase. When a
living organism needs new cells to repair damage, grow, or develop, cells undergo mitosis.
• During Prophase, the DNA and proteins start to condense. The two centrioles
move toward the opposite end of the cell in animals or microtubules are
assembled in plants to form a spindle. The nuclear envelope and nucleolus also
start to break up.
• During Metaphase, the spindle apparatus attaches to sister chromatids of each
chromosome. All the chromosomes are line up at the equator of the spindle. They
are now in their most tightly condensed form.
• During Anaphase, the spindle fibers attached to the two sister chromatids of each
chromosome contract and separate chromosomes which move to opposite poles of
the cell.
• In Telophase, as the two new cells pinch in half (animal cells) or a cell plate
forms (plant cells), the chromosomes become less condensed again and reappear
as chromatin. New membrane forms nuclear envelopes and the nucleolus is
reformed.
On the next page you can see photograph examples of plant and animal cells in each phase of
mitosis. Notice that some of the phases occur in stages, so there are a couple of different
photographs to show the phase in the “early” stage and also in the “late” phase.
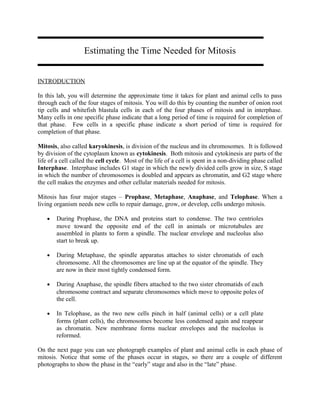
2. Plant Cell Cycle Phases (Onion Root Tip)
PROPHASE METAPHASE EARLY ANAPHASE
LATE ANAPHASE EARLY TELOPHASE LATE TELOPHASE
INTERPHASE
Animal Cell Cycle Phases (Whitefish Blastula)
FIGURE 13-1
3. MATERIALS
microscope
prepared slides of onion root tip (Allium) (longitudinal section)
prepared slide of whitefish blastula
PROCEDURE
1. Place the prepared onion root tip slide on the stage of your microscope. Using the 4X
objective, focus on the cells just above the tip of the root. Switch to the 10X objective and
then to the 40X objective (total magnification = 400X). Count the total number of cells in the
field of view. Record this number in the appropriate place in the data table.
2. Without changing the field of view, count the number of cells in each phase of mitosis:
prophase, metaphase, anaphase and telophase. Record this information in the appropriate
place in the data table.
3. To determine the approximate proportion of time a cell spends in each phase, divide the
number of cells in that phase by the total number of cells in the field of view then multiply by
100. Record this information in the data table.
4. Repeat steps 1 through 3 using the prepared animal mitosis (whitefish blastula) slide. Record
all information in the appropriate places in the data table.
Plant Cell Cycle
Phase
Number of
Cells in Phase
Number of Cells in Phase
Total Number of Cells
Percentage of Time
Spent in Phase
Prophase
Metaphase
Anaphase
Telophase
Total Number of
Cells in Field of View
FIGURE 13-2
TABLE 13-1
4. Animal Cell Cycle
Phase
Number of
Cells in Phase
Number of Cells in Phase
Total Number of Cells
Percentage of Time
Spent in Phase
Prophase
Metaphase
Anaphase
Telophase
Total Number of
Cells in Field of View
Using your data, prepare two pie graphs using Excel or Word which show the amount of time
spent in each part of the cell cycle for a plant cell and an animal cell.
DISCUSSION QUESTIONS
1. In which phase of plant cell mitosis is the most time spent? In which phase of animal cell
mitosis?
2. In which phase of plant cell mitosis is the least time spent? In which phase of animal cell
mitosis?
3. What is the total percentage of time the plant and animal cells spend undergoing mitosis?
4. What percentage of the time are the plant and animal cells not undergoing mitosis?
5. What are the plant and animal cells doing when they are not undergoing mitosis?
TABLE 13-2
5. 6. What important changes are occurring in the nucleus during the longest phase? Does this
justify the amount of time spent in the phase?
7. Where might you look for cells in the human body that are undergoing mitosis?
8. What would happen if the process of mitosis skipped metaphase? telophase?
The following table shows average times required for normal and diseased chicken stomach
cells to complete the cell cycle. Based on the data presented here:
TIME FOR CELL CYCLE OF NORMAL AND CANCEROUS
CHICKEN STOMACH CELLS (IN MINUTES)
NORMAL CHICKEN
STOMACH
CELLS IN MINUTES
CANCEROUS CHICKEN
STOMACH CELLS IN
MINUTES
Interphase 540 380
Prophase 60 45
Metaphas
e
10 10
Anaphase 3 3
Telophase 12 10
10. How do cancer cells differ from normal cells in the total time required for mitosis?
11. How do cancer cells differ from normal cells in time spent for each phase?
Based on the data presented here:
TIMES NEEDED FOR MITOSIS
PROPHASE METAPHASE ANAPHASE TELOPHASE TOTAL
Salamander
kidney cells
60 50 6 70 186
Pea root cells 80 40 4 12 136
12. Which organism, salamander or pea, shows time needed to complete mitosis most like the
data you recorded for the onion root tip?
TABLE 13-3
TABLE 13-4
6. 13. Why might the time required for these two organisms to complete mitosis be similar?
7. 13. Why might the time required for these two organisms to complete mitosis be similar?