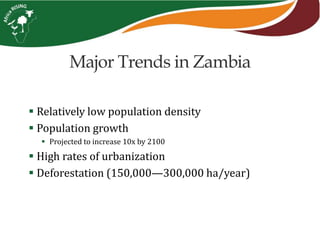
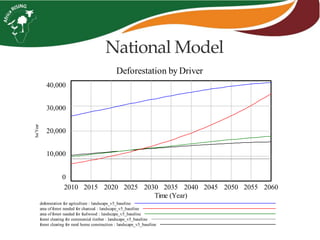
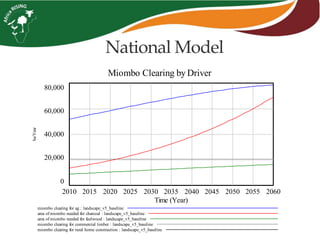
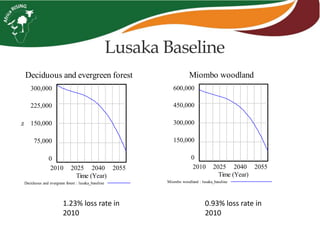
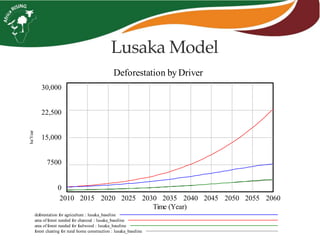
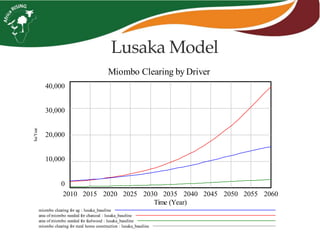
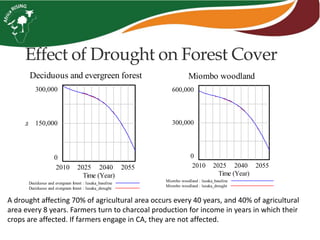
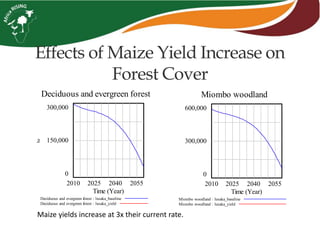
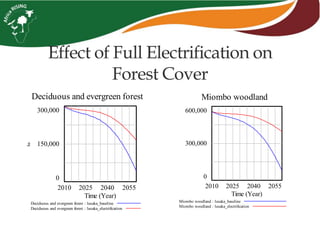
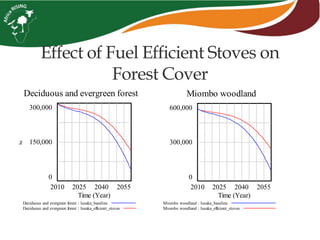
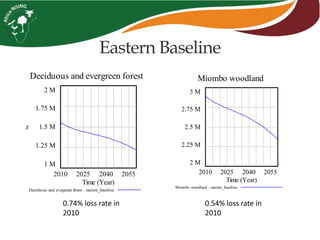
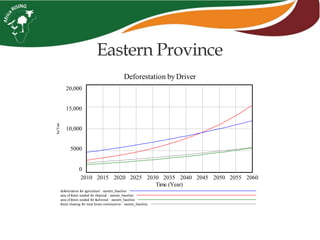
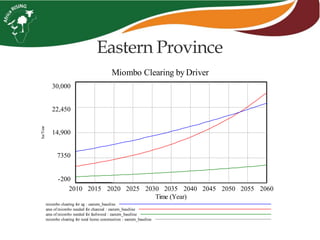
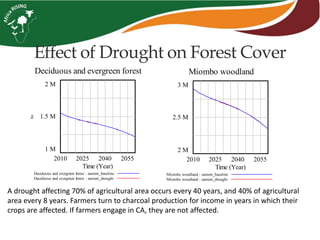
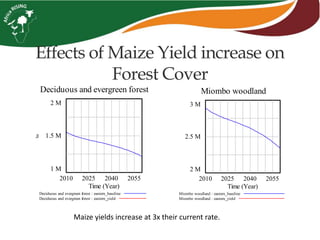
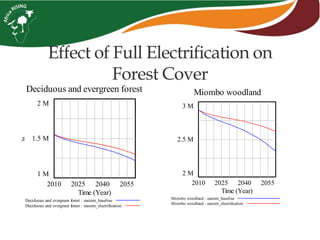
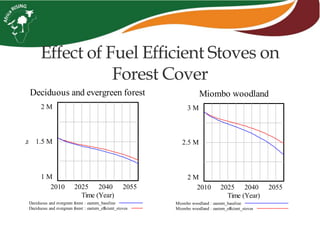
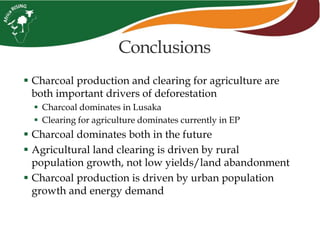
Impact of sustainable intensification on
landscapes and livelihoods (SILL) in Zambia
Africa RISING East and Southern Africa Review and Planning Meeting,
Malawi, 14-16 July 2015
Robert Richardson, Laura Schmitt Olabisi, Kurt Waldman
Michigan State University
SILL Project Objectives
1. Provide an evidence base for linkages between field
and farm-scale sustainable intensification (SI)
interventions and climate change mitigation
2. Provide recommendations to inform the design of an
integrated framework for programming in Zambia
 Pilot sites: Eastern and Lusaka Provinces, Zambia
Sustainable
Intensification
Interventions
Agroforestry
Conservation
Agriculture
Forest
Conservation
Biodiversity /
Wildlife
Conservation
Agricultural-Environmental Linkages
Participatory System Dynamics Modeling
 Introductory workshop – generate causal loop diagrams
 Review literature and data sets
 Build national model in Vensim
 Participatory modeling workshop – refine parameters
 Build provincial-level model (Eastern and Lusaka)
Major Trends in Zambia
 Relatively low population density
 Population growth
 Projected to increase 10x by 2100
 High rates of urbanization
 Deforestation (150,000—300,000 ha/year)
Population
Fuel
Food
Grassland
Forest
Agricultural
Decision-
making
Wildlife
populations
Model Structure
National Level Deforestation
(baseline, 2010-2060)
14% loss18% loss
Deciduous and evergreen forest
20 M
17.5 M
15 M
12.5 M
10 M
2010 2025 2040 2055
Time (Year)
ha
Deciduous and evergreen forest : landscape_v5_baseline
Miombo woodland
40 M
37.5 M
35 M
32.5 M
30 M
2010 2025 2040 2055
Time (Year)
ha
Miombo woodland : landscape_v5_baseline
National Model
Deforestation by Driver
40,000
30,000
20,000
10,000
0
2010 2015 2020 2025 2030 2035 2040 2045 2050 2055 2060
Time (Year)
ha/Year
deforestation for agriculture : landscape_v5_baseline
area of forest needed for charcoal : landscape_v5_baseline
area of forest needed for fuelwood : landscape_v5_baseline
forest clearing for commercial timber : landscape_v5_baseline
forest clearing for rural home construction : landscape_v5_baseline
Miombo Clearing by Driver
80,000
60,000
40,000
20,000
0
2010 2015 2020 2025 2030 2035 2040 2045 2050 2055 2060
Time (Year)
ha/Year
miombo clearing for ag : landscape_v5_baseline
area of miombo needed for charcoal : landscape_v5_baseline
area of miombo needed for fuelwood : landscape_v5_baseline
miombo clearing for commercial timber : landscape_v5_baseline
miombo clearing for rural home construction : landscape_v5_baseline
National Model
1.23% loss rate in
2010
0.93% loss rate in
2010
Deciduous and evergreen forest
300,000
225,000
150,000
75,000
0
2010 2025 2040 2055
Time (Year)
ha
Deciduous and evergreen forest : lusaka_baseline
Miombo woodland
600,000
450,000
300,000
150,000
0
2010 2025 2040 2055
Time (Year)
Miombo woodland : lusaka_baseline
Lusaka Baseline
Deforestation by Driver
30,000
22,500
15,000
7500
0
2010 2015 2020 2025 2030 2035 2040 2045 2050 2055 2060
Time (Year)
ha/Year
deforestation for agriculture : lusaka_baseline
area of forest needed for charcoal : lusaka_baseline
area of forest needed for fuelwood : lusaka_baseline
forest clearing for rural home construction : lusaka_baseline
Lusaka Model
Miombo Clearing by Driver
40,000
30,000
20,000
10,000
0
2010 2015 2020 2025 2030 2035 2040 2045 2050 2055 2060
Time (Year)
ha/Year
miombo clearing for ag : lusaka_baseline
area of miombo needed for charcoal : lusaka_baseline
area of miombo needed for fuelwood : lusaka_baseline
miombo clearing for rural home construction : lusaka_baseline
Lusaka Model
Effect of Drought on Forest Cover
A drought affecting 70% of agricultural area occurs every 40 years, and 40% of agricultural
area every 8 years. Farmers turn to charcoal production for income in years in which their
crops are affected. If farmers engage in CA, they are not affected.
Deciduous and evergreen forest
300,000
150,000
0
2010 2025 2040 2055
Time (Year)
ha
Deciduous and evergreen forest : lusaka_baseline
Deciduous and evergreen forest : lusaka_drought
Miombo woodland
600,000
300,000
0
2010 2025 2040 2055
Time (Year)
Miombo woodland : lusaka_baseline
Miombo woodland : lusaka_drought
Effects of Maize Yield Increase on
Forest Cover
Maize yields increase at 3x their current rate.
Deciduous and evergreen forest
300,000
150,000
0
2010 2025 2040 2055
Time (Year)
ha
Deciduous and evergreen forest : lusaka_baseline
Deciduous and evergreen forest : lusaka_yield
Miombo woodland
600,000
300,000
0
2010 2025 2040 2055
Time (Year)
Miombo woodland : lusaka_baseline
Miombo woodland : lusaka_yield
Effect of Full Electrification on
Forest Cover
Deciduous and evergreen forest
300,000
150,000
0
2010 2025 2040 2055
Time (Year)
ha
Deciduous and evergreen forest : lusaka_baseline
Deciduous and evergreen forest : lusaka_electrification
Miombo woodland
600,000
300,000
0
2010 2025 2040 2055
Time (Year)
Miombo woodland : lusaka_baseline
Miombo woodland : lusaka_electrification
Effect of Fuel Efficient Stoves on
Forest Cover
Deciduous and evergreen forest
300,000
150,000
0
2010 2025 2040 2055
Time (Year)
ha
Deciduous and evergreen forest : lusaka_baseline
Deciduous and evergreen forest : lusaka_efficient_stoves
Miombo woodland
600,000
300,000
0
2010 2025 2040 2055
Time (Year)
Miombo woodland : lusaka_baseline
Miombo woodland : lusaka_efficient_stoves
Eastern Baseline
0.74% loss rate in
2010
0.54% loss rate in
2010
Deciduous and evergreen forest
2 M
1.75 M
1.5 M
1.25 M
1 M
2010 2025 2040 2055
Time (Year)
ha
Deciduous and evergreen forest : eastern_baseline
Miombo woodland
3 M
2.75 M
2.5 M
2.25 M
2 M
2010 2025 2040 2055
Time (Year)
Miombo woodland : eastern_baseline
Eastern Province
Deforestation by Driver
20,000
15,000
10,000
5000
0
2010 2015 2020 2025 2030 2035 2040 2045 2050 2055 2060
Time (Year)
ha/Year
deforestation for agriculture : eastern_baseline
area of forest needed for charcoal : eastern_baseline
area of forest needed for fuelwood : eastern_baseline
forest clearing for rural home construction : eastern_baseline
Eastern Province
Miombo Clearing by Driver
30,000
22,450
14,900
7350
-200
2010 2015 2020 2025 2030 2035 2040 2045 2050 2055 2060
Time (Year)
ha/Year
miombo clearing for ag : eastern_baseline
area of miombo needed for charcoal : eastern_baseline
area of miombo needed for fuelwood : eastern_baseline
miombo clearing for rural home construction : eastern_baseline
Effect of Drought on Forest Cover
A drought affecting 70% of agricultural area occurs every 40 years, and 40% of agricultural
area every 8 years. Farmers turn to charcoal production for income in years in which their
crops are affected. If farmers engage in CA, they are not affected.
Deciduous and evergreen forest
2 M
1.5 M
1 M
2010 2025 2040 2055
Time (Year)
ha
Deciduous and evergreen forest : eastern_baseline
Deciduous and evergreen forest : eastern_drought
Miombo woodland
3 M
2.5 M
2 M
2010 2025 2040 2055
Time (Year)
Miombo woodland : eastern_baseline
Miombo woodland : eastern_drought
Effects of Maize Yield increase on
Forest Cover
Maize yields increase at 3x their current rate.
Deciduous and evergreen forest
2 M
1.5 M
1 M
2010 2025 2040 2055
Time (Year)
ha
Deciduous and evergreen forest : eastern_baseline
Deciduous and evergreen forest : eastern_yield
Miombo woodland
3 M
2.5 M
2 M
2010 2025 2040 2055
Time (Year)
Miombo woodland : eastern_baseline
Miombo woodland : eastern_yield
Effect of Full Electrification on
Forest Cover
Deciduous and evergreen forest
2 M
1.5 M
1 M
2010 2025 2040 2055
Time (Year)
ha
Deciduous and evergreen forest : eastern_baseline
Deciduous and evergreen forest : eastern_electrification
Miombo woodland
3 M
2.5 M
2 M
2010 2025 2040 2055
Time (Year)
Miombo woodland : eastern_baseline
Miombo woodland : eastern_electrification
Effect of Fuel Efficient Stoves on
Forest Cover
Deciduous and evergreen forest
2 M
1.5 M
1 M
2010 2025 2040 2055
Time (Year)
ha
Deciduous and evergreen forest : eastern_baseline
Deciduous and evergreen forest : eastern_efficient_stoves
Miombo woodland
3 M
2.5 M
2 M
2010 2025 2040 2055
Time (Year)
Miombo woodland : eastern_baseline
Miombo woodland : eastern_efficient_stoves
 Charcoal production and clearing for agriculture are
both important drivers of deforestation
 Charcoal dominates in Lusaka
 Clearing for agriculture dominates currently in EP
 Charcoal dominates both in the future
 Agricultural land clearing is driven by rural
population growth, not low yields/land abandonment
 Charcoal production is driven by urban population
growth and energy demand
Conclusions

Impact of sustainable intensification on landscapes and livelihoods (SILL) in Zambia

  • 1.
    Impact of sustainableintensification on landscapes and livelihoods (SILL) in Zambia Africa RISING East and Southern Africa Review and Planning Meeting, Malawi, 14-16 July 2015 Robert Richardson, Laura Schmitt Olabisi, Kurt Waldman Michigan State University
  • 2.
    SILL Project Objectives 1.Provide an evidence base for linkages between field and farm-scale sustainable intensification (SI) interventions and climate change mitigation 2. Provide recommendations to inform the design of an integrated framework for programming in Zambia  Pilot sites: Eastern and Lusaka Provinces, Zambia
  • 3.
  • 4.
    Participatory System DynamicsModeling  Introductory workshop – generate causal loop diagrams  Review literature and data sets  Build national model in Vensim  Participatory modeling workshop – refine parameters  Build provincial-level model (Eastern and Lusaka)
  • 5.
    Major Trends inZambia  Relatively low population density  Population growth  Projected to increase 10x by 2100  High rates of urbanization  Deforestation (150,000—300,000 ha/year)
  • 6.
  • 7.
    National Level Deforestation (baseline,2010-2060) 14% loss18% loss Deciduous and evergreen forest 20 M 17.5 M 15 M 12.5 M 10 M 2010 2025 2040 2055 Time (Year) ha Deciduous and evergreen forest : landscape_v5_baseline Miombo woodland 40 M 37.5 M 35 M 32.5 M 30 M 2010 2025 2040 2055 Time (Year) ha Miombo woodland : landscape_v5_baseline
  • 8.
    National Model Deforestation byDriver 40,000 30,000 20,000 10,000 0 2010 2015 2020 2025 2030 2035 2040 2045 2050 2055 2060 Time (Year) ha/Year deforestation for agriculture : landscape_v5_baseline area of forest needed for charcoal : landscape_v5_baseline area of forest needed for fuelwood : landscape_v5_baseline forest clearing for commercial timber : landscape_v5_baseline forest clearing for rural home construction : landscape_v5_baseline
  • 9.
    Miombo Clearing byDriver 80,000 60,000 40,000 20,000 0 2010 2015 2020 2025 2030 2035 2040 2045 2050 2055 2060 Time (Year) ha/Year miombo clearing for ag : landscape_v5_baseline area of miombo needed for charcoal : landscape_v5_baseline area of miombo needed for fuelwood : landscape_v5_baseline miombo clearing for commercial timber : landscape_v5_baseline miombo clearing for rural home construction : landscape_v5_baseline National Model
  • 10.
    1.23% loss ratein 2010 0.93% loss rate in 2010 Deciduous and evergreen forest 300,000 225,000 150,000 75,000 0 2010 2025 2040 2055 Time (Year) ha Deciduous and evergreen forest : lusaka_baseline Miombo woodland 600,000 450,000 300,000 150,000 0 2010 2025 2040 2055 Time (Year) Miombo woodland : lusaka_baseline Lusaka Baseline
  • 11.
    Deforestation by Driver 30,000 22,500 15,000 7500 0 20102015 2020 2025 2030 2035 2040 2045 2050 2055 2060 Time (Year) ha/Year deforestation for agriculture : lusaka_baseline area of forest needed for charcoal : lusaka_baseline area of forest needed for fuelwood : lusaka_baseline forest clearing for rural home construction : lusaka_baseline Lusaka Model
  • 12.
    Miombo Clearing byDriver 40,000 30,000 20,000 10,000 0 2010 2015 2020 2025 2030 2035 2040 2045 2050 2055 2060 Time (Year) ha/Year miombo clearing for ag : lusaka_baseline area of miombo needed for charcoal : lusaka_baseline area of miombo needed for fuelwood : lusaka_baseline miombo clearing for rural home construction : lusaka_baseline Lusaka Model
  • 13.
    Effect of Droughton Forest Cover A drought affecting 70% of agricultural area occurs every 40 years, and 40% of agricultural area every 8 years. Farmers turn to charcoal production for income in years in which their crops are affected. If farmers engage in CA, they are not affected. Deciduous and evergreen forest 300,000 150,000 0 2010 2025 2040 2055 Time (Year) ha Deciduous and evergreen forest : lusaka_baseline Deciduous and evergreen forest : lusaka_drought Miombo woodland 600,000 300,000 0 2010 2025 2040 2055 Time (Year) Miombo woodland : lusaka_baseline Miombo woodland : lusaka_drought
  • 14.
    Effects of MaizeYield Increase on Forest Cover Maize yields increase at 3x their current rate. Deciduous and evergreen forest 300,000 150,000 0 2010 2025 2040 2055 Time (Year) ha Deciduous and evergreen forest : lusaka_baseline Deciduous and evergreen forest : lusaka_yield Miombo woodland 600,000 300,000 0 2010 2025 2040 2055 Time (Year) Miombo woodland : lusaka_baseline Miombo woodland : lusaka_yield
  • 15.
    Effect of FullElectrification on Forest Cover Deciduous and evergreen forest 300,000 150,000 0 2010 2025 2040 2055 Time (Year) ha Deciduous and evergreen forest : lusaka_baseline Deciduous and evergreen forest : lusaka_electrification Miombo woodland 600,000 300,000 0 2010 2025 2040 2055 Time (Year) Miombo woodland : lusaka_baseline Miombo woodland : lusaka_electrification
  • 16.
    Effect of FuelEfficient Stoves on Forest Cover Deciduous and evergreen forest 300,000 150,000 0 2010 2025 2040 2055 Time (Year) ha Deciduous and evergreen forest : lusaka_baseline Deciduous and evergreen forest : lusaka_efficient_stoves Miombo woodland 600,000 300,000 0 2010 2025 2040 2055 Time (Year) Miombo woodland : lusaka_baseline Miombo woodland : lusaka_efficient_stoves
  • 17.
    Eastern Baseline 0.74% lossrate in 2010 0.54% loss rate in 2010 Deciduous and evergreen forest 2 M 1.75 M 1.5 M 1.25 M 1 M 2010 2025 2040 2055 Time (Year) ha Deciduous and evergreen forest : eastern_baseline Miombo woodland 3 M 2.75 M 2.5 M 2.25 M 2 M 2010 2025 2040 2055 Time (Year) Miombo woodland : eastern_baseline
  • 18.
    Eastern Province Deforestation byDriver 20,000 15,000 10,000 5000 0 2010 2015 2020 2025 2030 2035 2040 2045 2050 2055 2060 Time (Year) ha/Year deforestation for agriculture : eastern_baseline area of forest needed for charcoal : eastern_baseline area of forest needed for fuelwood : eastern_baseline forest clearing for rural home construction : eastern_baseline
  • 19.
    Eastern Province Miombo Clearingby Driver 30,000 22,450 14,900 7350 -200 2010 2015 2020 2025 2030 2035 2040 2045 2050 2055 2060 Time (Year) ha/Year miombo clearing for ag : eastern_baseline area of miombo needed for charcoal : eastern_baseline area of miombo needed for fuelwood : eastern_baseline miombo clearing for rural home construction : eastern_baseline
  • 20.
    Effect of Droughton Forest Cover A drought affecting 70% of agricultural area occurs every 40 years, and 40% of agricultural area every 8 years. Farmers turn to charcoal production for income in years in which their crops are affected. If farmers engage in CA, they are not affected. Deciduous and evergreen forest 2 M 1.5 M 1 M 2010 2025 2040 2055 Time (Year) ha Deciduous and evergreen forest : eastern_baseline Deciduous and evergreen forest : eastern_drought Miombo woodland 3 M 2.5 M 2 M 2010 2025 2040 2055 Time (Year) Miombo woodland : eastern_baseline Miombo woodland : eastern_drought
  • 21.
    Effects of MaizeYield increase on Forest Cover Maize yields increase at 3x their current rate. Deciduous and evergreen forest 2 M 1.5 M 1 M 2010 2025 2040 2055 Time (Year) ha Deciduous and evergreen forest : eastern_baseline Deciduous and evergreen forest : eastern_yield Miombo woodland 3 M 2.5 M 2 M 2010 2025 2040 2055 Time (Year) Miombo woodland : eastern_baseline Miombo woodland : eastern_yield
  • 22.
    Effect of FullElectrification on Forest Cover Deciduous and evergreen forest 2 M 1.5 M 1 M 2010 2025 2040 2055 Time (Year) ha Deciduous and evergreen forest : eastern_baseline Deciduous and evergreen forest : eastern_electrification Miombo woodland 3 M 2.5 M 2 M 2010 2025 2040 2055 Time (Year) Miombo woodland : eastern_baseline Miombo woodland : eastern_electrification
  • 23.
    Effect of FuelEfficient Stoves on Forest Cover Deciduous and evergreen forest 2 M 1.5 M 1 M 2010 2025 2040 2055 Time (Year) ha Deciduous and evergreen forest : eastern_baseline Deciduous and evergreen forest : eastern_efficient_stoves Miombo woodland 3 M 2.5 M 2 M 2010 2025 2040 2055 Time (Year) Miombo woodland : eastern_baseline Miombo woodland : eastern_efficient_stoves
  • 24.
     Charcoal productionand clearing for agriculture are both important drivers of deforestation  Charcoal dominates in Lusaka  Clearing for agriculture dominates currently in EP  Charcoal dominates both in the future  Agricultural land clearing is driven by rural population growth, not low yields/land abandonment  Charcoal production is driven by urban population growth and energy demand Conclusions

Editor's Notes

  • #4 The project explores the links between sustainable intensification (defined for this project as conservation agriculture and agroforestry) and the environment (forest and wildlife conservation)
  • #6 Zambia has a lot of land and forest