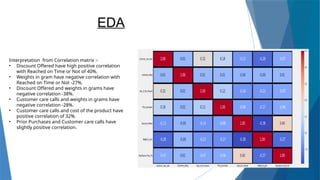
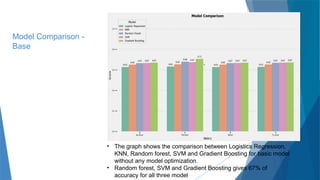
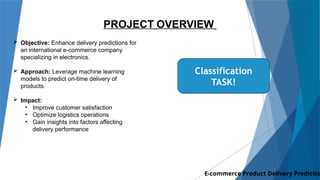
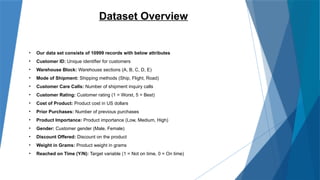
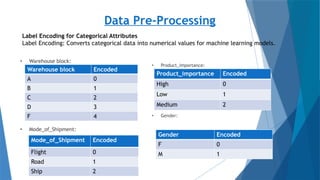
The document outlines a project aimed at enhancing delivery predictions for an international e-commerce company utilizing machine learning. It discusses data preparation, exploratory data analysis, model building, hyperparameter tuning, and data augmentation, demonstrating various factors affecting on-time deliveries. The highest test accuracy achieved was 69% using gradient boosting, with important features identified including product weight, cost, and discount offered.


![Data Pre-Processing
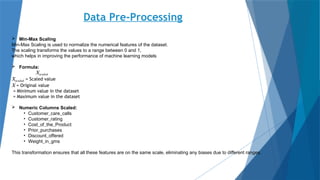
Min-Max Scaling
What is Min-Max Scaling?
A normalization technique that scales
the data to a fixed range, typically [0, 1].
Ensures all features contribute equally
to model performance.
Formula:
Where X is the original feature value,
X_min is the minimum value of the
feature, and X_max is the maximum
value.
Standardization
What is Standardization?
A scaling technique that transforms data
to have a mean of 0 and a standard
deviation of 1.
Ensures that each feature contributes
equally to model performance.
Formula:
Where X is the original feature value, μ is the
mean of the feature, and σ is the standard
deviation.](https://image.slidesharecdn.com/e-commercedeliveryprediction-240917060450-465f9bc8/85/Enhancing-E-Commerce-Efficiency-Predicting-Delivery-Times-with-Machine-Learning-7-320.jpg)