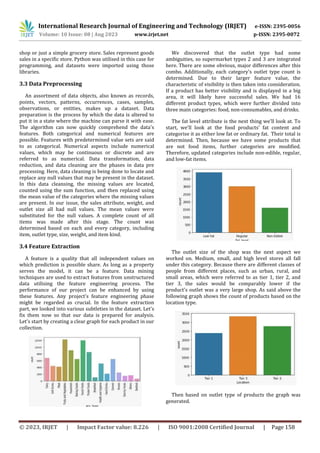
International Research Journal of Engineering and Technology (IRJET) e-ISSN: 2395-0056
Volume: 10 Issue: 08 | Aug 2023 www.irjet.net p-ISSN: 2395-0072
© 2023, IRJET | Impact Factor value: 8.226 | ISO 9001:2008 Certified Journal | Page 156
Big Data Analytics for Predicting Consumer Behaviour
Chandni Jivrajani1, Ghanashyam Vagale2, Ranjith koduri3, Chaithra Channegowda4, Mohammed
Naif5, Matur Rohit Kumar6
---------------------------------------------------------------------***---------------------------------------------------------------------
Abstract - Data mining techniques are particularly
efficient tools for obtaining the hidden knowledge from a
large dataset to improve predicting accuracy and efficiency.
Decision analysis and predictions must be integrated into
intelligent decision analytical systems. The accuracy of sales
forecasts has a significant effect on business. Many
corporate organizations rely heavily on their knowledge
bases to forecast market trends in demand and sales. This
suggested job will involve a thorough investigation and
evaluation of understandable forecasting models in order to
enhance future sales projections. Several data mining
techniques could be used to solve these issues. In this project,
the idea of sales data and sales projection is briefly
examined. The several methods and metrics for sales
forecasting are identified. An appropriate predictive model
is given for the prognosis of the sales trend on the basis of a
performance appraisal.
Key Words: Big Data, Analytics, Random Forest, Linear
Regression, Sales Prediction, Customer Behaviour.
1. INTRODUCTION
In plain English, customer behaviour refers to how
consumers act when shopping. It outlines the procedure
customers use to decide what to buy in order to fulfil their
needs and wants. It is made up of client preferences, which
influence their purchasing behaviour. It is a concept that
spans a number of phases, from the emergence of
requirements to the choice to make a purchase. Each
customer's mental state is different from the others; they
are not all the same. Therefore, it is essential for every
organisation to comprehend its clients. It aids businesses
in satisfying client demands and preferences. Businesses
that use customer relationship management should have
adequate understanding of their customers. It is a
database that compiles additional information about its
clients.
An examination of customer behaviour looks at both the
quality and number of client interactions with your
business. Buyer personas are first created by grouping
customers according to their shared traits. The customer
journey map's stages are then examined for each group to
determine how the personas interact with your business.
An analysis of customer behaviour offers insight into the
various factors that affect an audience. It gives you a
glimpse into the motivations, objectives, and procedures
used for making decisions across the customer experience.
This study enables you to determine whether the
customers' opinion of your business is consistent with
their basic beliefs.
Customer behaviour models are built on the data mining
of customer data, which is the foundation of smart
budgeting. Data mining techniques are particularly
effective in turning high volume of data into valuable
information for cost prediction and sales forecast. Sales
predictions are essential inputs for numerous decision-
making processes at the organisational level across a
variety of functional areas, including operations,
marketing, sales, production, and finance. Predictive sales
data is crucial for firms wanting to raise investment capital
since it can be used to successfully manage internal
resources inside an organisation. The studies move on
from a fresh angle that concentrates on how to pick a
suitable strategy to forecast sales with a high level of
accuracy. The initial dataset utilised for this study
included a lot of entries, but the final dataset that was used
for analysis was significantly smaller than the original
since it was free of useless information, duplicate entries,
and irrelevant sales data.
2. PROPOSED MODEL
In order to estimate how comparable consumers will
behave in similar circumstances, customer behaviour
forecasting is akin to developing a mathematical model to
represent the typical behaviours seen among specific
groups of customers. The current customer behaviour
models rely on data mining methods, and each model is
made to provide a single answer. For instance, this model
can be used to forecast how a certain customer group will
behave in response to a marketing campaign. If the model
was successful, the marketer would use the same
approach to draw in a growing number of clients. But
because the specialists' mathematical methods and tools
were so sophisticated and expensive, the current systems
were more challenging and expensive. Even after
developing an expensive model that was highly expensive
to manipulate and process, marketers still need to know
exactly what to do to attract clients to their business.
However, a lot of models were overly simplistic and
predicative because they omitted important features that
would have complicated them. According to the
aforementioned literature review, Generalised linear
model, Decision tree, and Gradient boost tree were
selected as a combination and used in the process. With
85,000 datasets, their best solution had an accuracy of
about 64%. In the following study, data aggregation and
International Research Journal of Engineering and Technology (IRJET) e-ISSN: 2395-0056
Volume: 10 Issue: 08 | Aug 2023 www.irjet.net p-ISSN: 2395-0072
© 2023, IRJET | Impact Factor value: 8.226 | ISO 9001:2008 Certified Journal | Page 157
mapping were accomplished using a map-reduce model in
conjunction with the C4.5 classification algorithm. Here,
key big data topics like HDFS and Apache Hadoop ruled.
Additionally, they offered a D3.js-based data visualisation
capability. Their scalability and efficiency were both
decently strong. Another study includes association rules
and data mining techniques. By creating association rules,
this is for producing patterns of customer preference. He
worked with a dataset from a grocery store and
discovered the outcomes using support and confidence
values. Their degree of accuracy was up to 80%. He
employed data mining techniques in addition to CRM, or
customer relationship management, approaches in the
other article. They examined the use of data mining
techniques to extract knowledge from huge databases. The
rule induction technique was applied to clustered data
from the customer database depending on their queries in
order to complete this project with CRM. They prioritised
data distillation, data preservation, and queries. Numerous
hypotheses were predicted based on the responses to
those questions. They combined RFM and the k-means
algorithm in their subsequent publication. SAS Enterprise
Miner's cluster node was used for this procedure. With
respect to datasets with unequal variables of various
magnitudes, this technique performs fairly well. Following
these steps, they discovered that monetary value differed
somewhat from recentness and frequency. The next paper
used soft clustering on an e-commerce dataset. To
categorise clients based on categories, they employed the
soft clustering method, which employs a latent mixed class
clustering methodology. The primary distinction was that
it was entirely dependent on the internet. They divided the
data into numerous groups using the Drichlet approach,
and the outcome was superior to that of hard clustering
and the finite mixture model. The model proposed in this
paper is based on the same approach.
3. IMPLEMENTATION
This paper suggests a new combination of algorithms to
provide some variation to the current system. Here, the
random forest technique and linear regression were
mostly used. And in order to determine which
methodology had the highest accuracy, its results were
compared.
The fundamental components of this process are as
follows:
1.Hypothesis Generation
2.Importing dataset
3.Data preprocessing
4.Feature extraction
5.Applying algorithm
6.Result Prediction
7.Build and visualize best model.
3.1 Hypothesis Generation
The problem statement is carefully examined at this
first stage of the project's progression, and several
hypotheses are developed. A hypothesis is a representation
of the relationship between several pieces of data. As a
result, we must generate hypotheses by asking ourselves a
lot of questions, consulting a variety of sources, and then
refining them to come up with a solution. In our situation,
the challenge is to forecast the most effective approach to
comprehending client behaviour and determining how
they would respond in certain situations. At this point, a
number of publications were cited, and with the aid of
numerous sources, we were able to understand the main
issue. Numerous questions were also generated, and they
were all answered. When thinking about our issue, we
must examine some information, such as the sort of city
from which the product is marketed; if it is from an urban
location, then sales will be high. Next, we looked at the
store's capacity because larger stores often generate more
revenue. We may anticipate strong sales if marketing
methods were improved and if there were no rival
businesses. Sales will be high if a company offers appealing
advertising and promotions. These are different
hypotheses that were developed for our project.
3.2 Importing Dataset
The dataset used in this case was one that was gathered
from several stores and contained all of the items
specifically used in home activities, or what we may call a
supermarket dataset. It has approximately 1560 products
from 10 places, and it was gathered in 2013. This dataset
was downloaded from the Kaggle website. That mentioned
the qualities of the things. Product code, which indicates
the item's distinctive identity, weight, fat level, and
product visibility are among the attributes. Product
visibility indicates the proportion of the store's total
display space that has been allotted to that particular item.
Product type designates the category that the product falls
under, whereas MRP provides the product's price. Year
and Outlet display the distinct store ID and the year the
shop was founded, respectively. The size of an outlet is
measured by the area it covers. Location indicates
whether a store is in an urban or rural area of the city. The
outlet type describes whether the outlet is a departmental
International Research Journal of Engineering and Technology (IRJET) e-ISSN: 2395-0056
Volume: 10 Issue: 08 | Aug 2023 www.irjet.net p-ISSN: 2395-0072
© 2023, IRJET | Impact Factor value: 8.226 | ISO 9001:2008 Certified Journal | Page 158
shop or just a simple grocery store. Sales represent goods
sales in a specific store. Python was utilised in this case for
programming, and datasets were imported using those
libraries.
3.3 Data Preprocessing
An assortment of data objects, also known as records,
points, vectors, patterns, occurrences, cases, samples,
observations, or entities, makes up a dataset. Data
preparation is the process by which the data is altered to
put it in a state where the machine can parse it with ease.
The algorithm can now quickly comprehend the data's
features. Both categorical and numerical features are
possible. Features with predetermined value sets are said
to as categorical. Numerical aspects include numerical
values, which may be continuous or discrete and are
referred to as numerical. Data transformation, data
reduction, and data cleaning are the phases in data pre
processing. Here, data cleaning is being done to locate and
replace any null values that may be present in the dataset.
In this data cleansing, the missing values are located,
counted using the sum function, and then replaced using
the mean value of the categories where the missing values
are present. In our issue, the sales attribute, weight, and
outlet size all had null values. The mean values were
substituted for the null values. A complete count of all
items was made after this stage. The count was
determined based on each and every category, including
item, outlet type, size, weight, and item kind.
3.4 Feature Extraction
A feature is a quality that all independent values on
which prediction is possible share. As long as a property
serves the model, it can be a feature. Data mining
techniques are used to extract features from unstructured
data utilising the feature engineering process. The
performance of our project can be enhanced by using
these features. Any project's feature engineering phase
might be regarded as crucial. In the feature extraction
part, we looked into various subtleties in the dataset. Let's
fix them now so that our data is prepared for analysis.
Let's start by creating a clear graph for each product in our
collection.
We discovered that the outlet type had some
ambiguities, so supermarket types 2 and 3 are integrated
here. There are some obvious, major differences after this
combo. Additionally, each category's outlet type count is
determined. Due to their larger feature value, the
characteristic of visibility is then taken into consideration.
If a product has better visibility and is displayed in a big
area, it will likely have successful sales. We had 16
different product types, which were further divided into
three main categories: food, non-consumables, and drinks.
The fat level attribute is the next thing we'll look at. To
start, we'll look at the food products' fat content and
categorise it as either low fat or ordinary fat. Their total is
determined. Then, because we have some products that
are not food items, further categories are modified.
Therefore, updated categories include non-edible, regular,
and low-fat items.
The outlet size of the shop was the next aspect we
worked on. Medium, small, and high level stores all fall
under this category. Because there are different classes of
people from different places, such as urban, rural, and
small areas, which were referred to as tier 1, tier 2, and
tier 3, the sales would be comparably lower if the
product's outlet was a very large shop. As said above the
following graph shows the count of products based on the
location type.
Then based on outlet type of products the graph was
generated.
International Research Journal of Engineering and Technology (IRJET) e-ISSN: 2395-0056
Volume: 10 Issue: 08 | Aug 2023 www.irjet.net p-ISSN: 2395-0072
© 2023, IRJET | Impact Factor value: 8.226 | ISO 9001:2008 Certified Journal | Page 159
Therefore, this feature extraction stage is now finished,
and all of the collected features will be used in the
following algorithm application step. The characteristics of
our data will affect the outcome. With this feature
engineering, we can produce the most accurate data
structures, making it simpler to produce the best model.
By reducing the amount of features in the model through
feature extraction, less memory and processing power are
needed during training, which reduces training times and
lowers the likelihood of overfitting. Making the training
data simpler will make the model easier to understand,
which is critical for defending real-world issues caused by
model outputs.
3.5 Applying Algorithm
Unlike others implementation, we decided to apply
linear regression and random forest algorithm. Many
researchers used several algorithms like Generalized
linear model, Decision tree, Gradient boost, C4.5
classification algorithm and map-reduce model, data
mining technique along with association rule, CRM
technique, rule induction process, RFM technique, K
means algorithm.
Linear Regression: Models for predictive analysis use
linear regression. Using a best fit line, this technique
explains the strength of the link between two or more
variables (multiple regression). When there is only one
independent variable and one dependent variable, simple
linear regression is utilised. In this method, a single line is
fitted using a scatter plot. Simple linear regression with a
single dependent variable and a single independent
variable looks like this: Y = aX + b
This equation, in which Y is the goal variable, X is the input
variable, "a" denotes the slope, and "b" is the intercept, is
known as a linear regression equation. The best fit line is
regarded as the one that best captures the nature of the
relationship. The best fit line, on the other hand, will
return the most accurate value of Y based on X that is
contributing to the smallest discrepancy between the
actual and anticipated value of Y.
This output showed that the cross-variation score is 0.289
and the mean squared error value is roughly 0.287.
Random forest algorithm: The relative value of each and
every feature that we extracted during the feature
engineering process may be determined using the random
forest method, which is a relatively simple technique. This
determines how much the feature will minimise impurity
across all of the forest's trees by measuring how much the
tree nodes will use it. Additionally, after training, a value is
computed for each feature, and the outcome is the sum of
all significant features. By determining the relative
relevance of the elements, we can determine which
aspects are essential and which are extraneous, allowing
us to eliminate any that do not add value. This method
performs the best and is compatible with all data mining
approaches.
After using the random forest algorithm, we could see that
the mean squared value and CV score were, respectively,
0.264 and 0.276.
4. RESULTS AND DISCUSSIONS
We can infer from the aforementioned findings that the
random forest algorithm exhibits a lower mean squared
value and a lower CV score (cross validation score) than
the linear regression approach. Looking at both processes'
feature importance graphs, linear regression concludes
that the grocery store feature is more significant, whereas
random forest concludes that the fat level is more
significant. The Random Forest algorithm only produced
International Research Journal of Engineering and Technology (IRJET) e-ISSN: 2395-0056
Volume: 10 Issue: 08 | Aug 2023 www.irjet.net p-ISSN: 2395-0072
© 2023, IRJET | Impact Factor value: 8.226 | ISO 9001:2008 Certified Journal | Page 160
that result. In the end, the algorithm with a lower mean
squared value and cross validation score is regarded to
have superior accuracy.
5. CONCLUSION
A business can simply boost sales by foreseeing more and
more features in this way, and it can also foresee client
behaviour under various conditions. The ability to forecast
people's behaviour towards a project is a key component
of the technology and methodology used in recent trends.
A business can simply boost sales by foreseeing more and
more features in this way, and it can also foresee client
behaviour under various conditions. This technology and
method has become increasingly important in recent
times as market rivalry keeps growing. A corporation
must focus on this process and invest money in it if it
hopes to last for a number of years. Spending a portion of
their entire capital on a sales forecast is always a good
idea.
REFERENCES
[1] Sunitha cheriyan, ShanibaIbrahim,”Intelligent sales
prediction using machine learning technique”, 978-
15386-4904-6/18/$31.00 © 2018 IEEE.
[2] Anindita AKhade,” Performing Customer Behavior
Analysis using Big Data Analytics”, 7
th
International
Conferenceon Communication, Computing and
Virtualization 2016.
[3] Abhijit Raorane ,R.V.Kulkarni, “Data Mining
Techniques: A Source For Consumer Behavior
Analysis”, International Journal of Database
Management Systems, September 2011.
[4] Abdullah Al- Mudimigh, Farrukh Saleem, Zahid Ullah,
“Efficient Implementation ofData Mining: Improve
Customer's Behaviour “,2019.
[5] Paolo Giudici, Gianluca Passerone, “Data mining of
association structures to model consumer behavior”,
Published on “Computational Statistics &
DataAnalysis”, 2016. www.elsevier.com/locate/csda
[6] Tomoharu Iwata, Shinji Watanabe, Takeshi Yamada,
Naonori Ueda”,Topic Tracking Model for
AnalyzingConsumer Purchase Behavior”,2009.
[7] Patcharin Ponyiam, Somjit Arch- int,“Customer
Behavior Analysis Using Data Mining Techniques”,
International Seminar on Application for Technology
of Information and Communication, 2018.

Big Data Analytics for Predicting Consumer Behaviour

  • 1.
    International Research Journalof Engineering and Technology (IRJET) e-ISSN: 2395-0056 Volume: 10 Issue: 08 | Aug 2023 www.irjet.net p-ISSN: 2395-0072 © 2023, IRJET | Impact Factor value: 8.226 | ISO 9001:2008 Certified Journal | Page 156 Big Data Analytics for Predicting Consumer Behaviour Chandni Jivrajani1, Ghanashyam Vagale2, Ranjith koduri3, Chaithra Channegowda4, Mohammed Naif5, Matur Rohit Kumar6 ---------------------------------------------------------------------***--------------------------------------------------------------------- Abstract - Data mining techniques are particularly efficient tools for obtaining the hidden knowledge from a large dataset to improve predicting accuracy and efficiency. Decision analysis and predictions must be integrated into intelligent decision analytical systems. The accuracy of sales forecasts has a significant effect on business. Many corporate organizations rely heavily on their knowledge bases to forecast market trends in demand and sales. This suggested job will involve a thorough investigation and evaluation of understandable forecasting models in order to enhance future sales projections. Several data mining techniques could be used to solve these issues. In this project, the idea of sales data and sales projection is briefly examined. The several methods and metrics for sales forecasting are identified. An appropriate predictive model is given for the prognosis of the sales trend on the basis of a performance appraisal. Key Words: Big Data, Analytics, Random Forest, Linear Regression, Sales Prediction, Customer Behaviour. 1. INTRODUCTION In plain English, customer behaviour refers to how consumers act when shopping. It outlines the procedure customers use to decide what to buy in order to fulfil their needs and wants. It is made up of client preferences, which influence their purchasing behaviour. It is a concept that spans a number of phases, from the emergence of requirements to the choice to make a purchase. Each customer's mental state is different from the others; they are not all the same. Therefore, it is essential for every organisation to comprehend its clients. It aids businesses in satisfying client demands and preferences. Businesses that use customer relationship management should have adequate understanding of their customers. It is a database that compiles additional information about its clients. An examination of customer behaviour looks at both the quality and number of client interactions with your business. Buyer personas are first created by grouping customers according to their shared traits. The customer journey map's stages are then examined for each group to determine how the personas interact with your business. An analysis of customer behaviour offers insight into the various factors that affect an audience. It gives you a glimpse into the motivations, objectives, and procedures used for making decisions across the customer experience. This study enables you to determine whether the customers' opinion of your business is consistent with their basic beliefs. Customer behaviour models are built on the data mining of customer data, which is the foundation of smart budgeting. Data mining techniques are particularly effective in turning high volume of data into valuable information for cost prediction and sales forecast. Sales predictions are essential inputs for numerous decision- making processes at the organisational level across a variety of functional areas, including operations, marketing, sales, production, and finance. Predictive sales data is crucial for firms wanting to raise investment capital since it can be used to successfully manage internal resources inside an organisation. The studies move on from a fresh angle that concentrates on how to pick a suitable strategy to forecast sales with a high level of accuracy. The initial dataset utilised for this study included a lot of entries, but the final dataset that was used for analysis was significantly smaller than the original since it was free of useless information, duplicate entries, and irrelevant sales data. 2. PROPOSED MODEL In order to estimate how comparable consumers will behave in similar circumstances, customer behaviour forecasting is akin to developing a mathematical model to represent the typical behaviours seen among specific groups of customers. The current customer behaviour models rely on data mining methods, and each model is made to provide a single answer. For instance, this model can be used to forecast how a certain customer group will behave in response to a marketing campaign. If the model was successful, the marketer would use the same approach to draw in a growing number of clients. But because the specialists' mathematical methods and tools were so sophisticated and expensive, the current systems were more challenging and expensive. Even after developing an expensive model that was highly expensive to manipulate and process, marketers still need to know exactly what to do to attract clients to their business. However, a lot of models were overly simplistic and predicative because they omitted important features that would have complicated them. According to the aforementioned literature review, Generalised linear model, Decision tree, and Gradient boost tree were selected as a combination and used in the process. With 85,000 datasets, their best solution had an accuracy of about 64%. In the following study, data aggregation and
  • 2.
    International Research Journalof Engineering and Technology (IRJET) e-ISSN: 2395-0056 Volume: 10 Issue: 08 | Aug 2023 www.irjet.net p-ISSN: 2395-0072 © 2023, IRJET | Impact Factor value: 8.226 | ISO 9001:2008 Certified Journal | Page 157 mapping were accomplished using a map-reduce model in conjunction with the C4.5 classification algorithm. Here, key big data topics like HDFS and Apache Hadoop ruled. Additionally, they offered a D3.js-based data visualisation capability. Their scalability and efficiency were both decently strong. Another study includes association rules and data mining techniques. By creating association rules, this is for producing patterns of customer preference. He worked with a dataset from a grocery store and discovered the outcomes using support and confidence values. Their degree of accuracy was up to 80%. He employed data mining techniques in addition to CRM, or customer relationship management, approaches in the other article. They examined the use of data mining techniques to extract knowledge from huge databases. The rule induction technique was applied to clustered data from the customer database depending on their queries in order to complete this project with CRM. They prioritised data distillation, data preservation, and queries. Numerous hypotheses were predicted based on the responses to those questions. They combined RFM and the k-means algorithm in their subsequent publication. SAS Enterprise Miner's cluster node was used for this procedure. With respect to datasets with unequal variables of various magnitudes, this technique performs fairly well. Following these steps, they discovered that monetary value differed somewhat from recentness and frequency. The next paper used soft clustering on an e-commerce dataset. To categorise clients based on categories, they employed the soft clustering method, which employs a latent mixed class clustering methodology. The primary distinction was that it was entirely dependent on the internet. They divided the data into numerous groups using the Drichlet approach, and the outcome was superior to that of hard clustering and the finite mixture model. The model proposed in this paper is based on the same approach. 3. IMPLEMENTATION This paper suggests a new combination of algorithms to provide some variation to the current system. Here, the random forest technique and linear regression were mostly used. And in order to determine which methodology had the highest accuracy, its results were compared. The fundamental components of this process are as follows: 1.Hypothesis Generation 2.Importing dataset 3.Data preprocessing 4.Feature extraction 5.Applying algorithm 6.Result Prediction 7.Build and visualize best model. 3.1 Hypothesis Generation The problem statement is carefully examined at this first stage of the project's progression, and several hypotheses are developed. A hypothesis is a representation of the relationship between several pieces of data. As a result, we must generate hypotheses by asking ourselves a lot of questions, consulting a variety of sources, and then refining them to come up with a solution. In our situation, the challenge is to forecast the most effective approach to comprehending client behaviour and determining how they would respond in certain situations. At this point, a number of publications were cited, and with the aid of numerous sources, we were able to understand the main issue. Numerous questions were also generated, and they were all answered. When thinking about our issue, we must examine some information, such as the sort of city from which the product is marketed; if it is from an urban location, then sales will be high. Next, we looked at the store's capacity because larger stores often generate more revenue. We may anticipate strong sales if marketing methods were improved and if there were no rival businesses. Sales will be high if a company offers appealing advertising and promotions. These are different hypotheses that were developed for our project. 3.2 Importing Dataset The dataset used in this case was one that was gathered from several stores and contained all of the items specifically used in home activities, or what we may call a supermarket dataset. It has approximately 1560 products from 10 places, and it was gathered in 2013. This dataset was downloaded from the Kaggle website. That mentioned the qualities of the things. Product code, which indicates the item's distinctive identity, weight, fat level, and product visibility are among the attributes. Product visibility indicates the proportion of the store's total display space that has been allotted to that particular item. Product type designates the category that the product falls under, whereas MRP provides the product's price. Year and Outlet display the distinct store ID and the year the shop was founded, respectively. The size of an outlet is measured by the area it covers. Location indicates whether a store is in an urban or rural area of the city. The outlet type describes whether the outlet is a departmental
  • 3.
    International Research Journalof Engineering and Technology (IRJET) e-ISSN: 2395-0056 Volume: 10 Issue: 08 | Aug 2023 www.irjet.net p-ISSN: 2395-0072 © 2023, IRJET | Impact Factor value: 8.226 | ISO 9001:2008 Certified Journal | Page 158 shop or just a simple grocery store. Sales represent goods sales in a specific store. Python was utilised in this case for programming, and datasets were imported using those libraries. 3.3 Data Preprocessing An assortment of data objects, also known as records, points, vectors, patterns, occurrences, cases, samples, observations, or entities, makes up a dataset. Data preparation is the process by which the data is altered to put it in a state where the machine can parse it with ease. The algorithm can now quickly comprehend the data's features. Both categorical and numerical features are possible. Features with predetermined value sets are said to as categorical. Numerical aspects include numerical values, which may be continuous or discrete and are referred to as numerical. Data transformation, data reduction, and data cleaning are the phases in data pre processing. Here, data cleaning is being done to locate and replace any null values that may be present in the dataset. In this data cleansing, the missing values are located, counted using the sum function, and then replaced using the mean value of the categories where the missing values are present. In our issue, the sales attribute, weight, and outlet size all had null values. The mean values were substituted for the null values. A complete count of all items was made after this stage. The count was determined based on each and every category, including item, outlet type, size, weight, and item kind. 3.4 Feature Extraction A feature is a quality that all independent values on which prediction is possible share. As long as a property serves the model, it can be a feature. Data mining techniques are used to extract features from unstructured data utilising the feature engineering process. The performance of our project can be enhanced by using these features. Any project's feature engineering phase might be regarded as crucial. In the feature extraction part, we looked into various subtleties in the dataset. Let's fix them now so that our data is prepared for analysis. Let's start by creating a clear graph for each product in our collection. We discovered that the outlet type had some ambiguities, so supermarket types 2 and 3 are integrated here. There are some obvious, major differences after this combo. Additionally, each category's outlet type count is determined. Due to their larger feature value, the characteristic of visibility is then taken into consideration. If a product has better visibility and is displayed in a big area, it will likely have successful sales. We had 16 different product types, which were further divided into three main categories: food, non-consumables, and drinks. The fat level attribute is the next thing we'll look at. To start, we'll look at the food products' fat content and categorise it as either low fat or ordinary fat. Their total is determined. Then, because we have some products that are not food items, further categories are modified. Therefore, updated categories include non-edible, regular, and low-fat items. The outlet size of the shop was the next aspect we worked on. Medium, small, and high level stores all fall under this category. Because there are different classes of people from different places, such as urban, rural, and small areas, which were referred to as tier 1, tier 2, and tier 3, the sales would be comparably lower if the product's outlet was a very large shop. As said above the following graph shows the count of products based on the location type. Then based on outlet type of products the graph was generated.
  • 4.
    International Research Journalof Engineering and Technology (IRJET) e-ISSN: 2395-0056 Volume: 10 Issue: 08 | Aug 2023 www.irjet.net p-ISSN: 2395-0072 © 2023, IRJET | Impact Factor value: 8.226 | ISO 9001:2008 Certified Journal | Page 159 Therefore, this feature extraction stage is now finished, and all of the collected features will be used in the following algorithm application step. The characteristics of our data will affect the outcome. With this feature engineering, we can produce the most accurate data structures, making it simpler to produce the best model. By reducing the amount of features in the model through feature extraction, less memory and processing power are needed during training, which reduces training times and lowers the likelihood of overfitting. Making the training data simpler will make the model easier to understand, which is critical for defending real-world issues caused by model outputs. 3.5 Applying Algorithm Unlike others implementation, we decided to apply linear regression and random forest algorithm. Many researchers used several algorithms like Generalized linear model, Decision tree, Gradient boost, C4.5 classification algorithm and map-reduce model, data mining technique along with association rule, CRM technique, rule induction process, RFM technique, K means algorithm. Linear Regression: Models for predictive analysis use linear regression. Using a best fit line, this technique explains the strength of the link between two or more variables (multiple regression). When there is only one independent variable and one dependent variable, simple linear regression is utilised. In this method, a single line is fitted using a scatter plot. Simple linear regression with a single dependent variable and a single independent variable looks like this: Y = aX + b This equation, in which Y is the goal variable, X is the input variable, "a" denotes the slope, and "b" is the intercept, is known as a linear regression equation. The best fit line is regarded as the one that best captures the nature of the relationship. The best fit line, on the other hand, will return the most accurate value of Y based on X that is contributing to the smallest discrepancy between the actual and anticipated value of Y. This output showed that the cross-variation score is 0.289 and the mean squared error value is roughly 0.287. Random forest algorithm: The relative value of each and every feature that we extracted during the feature engineering process may be determined using the random forest method, which is a relatively simple technique. This determines how much the feature will minimise impurity across all of the forest's trees by measuring how much the tree nodes will use it. Additionally, after training, a value is computed for each feature, and the outcome is the sum of all significant features. By determining the relative relevance of the elements, we can determine which aspects are essential and which are extraneous, allowing us to eliminate any that do not add value. This method performs the best and is compatible with all data mining approaches. After using the random forest algorithm, we could see that the mean squared value and CV score were, respectively, 0.264 and 0.276. 4. RESULTS AND DISCUSSIONS We can infer from the aforementioned findings that the random forest algorithm exhibits a lower mean squared value and a lower CV score (cross validation score) than the linear regression approach. Looking at both processes' feature importance graphs, linear regression concludes that the grocery store feature is more significant, whereas random forest concludes that the fat level is more significant. The Random Forest algorithm only produced
  • 5.
    International Research Journalof Engineering and Technology (IRJET) e-ISSN: 2395-0056 Volume: 10 Issue: 08 | Aug 2023 www.irjet.net p-ISSN: 2395-0072 © 2023, IRJET | Impact Factor value: 8.226 | ISO 9001:2008 Certified Journal | Page 160 that result. In the end, the algorithm with a lower mean squared value and cross validation score is regarded to have superior accuracy. 5. CONCLUSION A business can simply boost sales by foreseeing more and more features in this way, and it can also foresee client behaviour under various conditions. The ability to forecast people's behaviour towards a project is a key component of the technology and methodology used in recent trends. A business can simply boost sales by foreseeing more and more features in this way, and it can also foresee client behaviour under various conditions. This technology and method has become increasingly important in recent times as market rivalry keeps growing. A corporation must focus on this process and invest money in it if it hopes to last for a number of years. Spending a portion of their entire capital on a sales forecast is always a good idea. REFERENCES [1] Sunitha cheriyan, ShanibaIbrahim,”Intelligent sales prediction using machine learning technique”, 978- 15386-4904-6/18/$31.00 © 2018 IEEE. [2] Anindita AKhade,” Performing Customer Behavior Analysis using Big Data Analytics”, 7 th International Conferenceon Communication, Computing and Virtualization 2016. [3] Abhijit Raorane ,R.V.Kulkarni, “Data Mining Techniques: A Source For Consumer Behavior Analysis”, International Journal of Database Management Systems, September 2011. [4] Abdullah Al- Mudimigh, Farrukh Saleem, Zahid Ullah, “Efficient Implementation ofData Mining: Improve Customer's Behaviour “,2019. [5] Paolo Giudici, Gianluca Passerone, “Data mining of association structures to model consumer behavior”, Published on “Computational Statistics & DataAnalysis”, 2016. www.elsevier.com/locate/csda [6] Tomoharu Iwata, Shinji Watanabe, Takeshi Yamada, Naonori Ueda”,Topic Tracking Model for AnalyzingConsumer Purchase Behavior”,2009. [7] Patcharin Ponyiam, Somjit Arch- int,“Customer Behavior Analysis Using Data Mining Techniques”, International Seminar on Application for Technology of Information and Communication, 2018.