Downloaded 214 times


![ The international community has agreed that a priority in
Agenda 21 should be promoting sustainable agriculture
and rural development (SARD) and one of the programme
areas [Chapter 14k in Agenda 21] is to encourage a rural
energy transition in order to enhance productivity (UNCED,
1992).
The objectives of this programme area include initiating
the required transition by making available new and
renewable sources of energy and increasing the energy
inputs available for rural household and agro-industrial
needs.
Rural programmes favouring sustainable development of
renewable energy sources and improved energy efficiency
are also called for in Agenda 21 in the programme area
dealing with protection of the atmosphere [Chapter 9b in
Agenda 21].](https://image.slidesharecdn.com/energymanagementinagriculturelecturenotes-161118073551/85/Energy-management-in-agriculture-revised-lecture-notes-85-320.jpg)


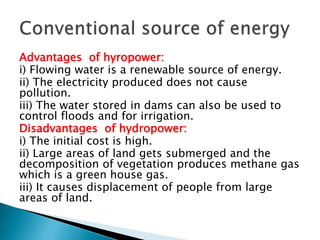
The document discusses energy management as a vital component for sustainable growth and improved living conditions, emphasizing the need for conservation and efficient utilization of both conventional (fossil fuels) and non-conventional (renewable) energy sources. It highlights various energy sources such as hydro, biomass, wind, solar, tidal, and nuclear energy, detailing their advantages, disadvantages, and applications, particularly in agriculture. The role of energy in rural development and food security is underscored, with an analysis of energy needs based on household income and agricultural practices.


