Download to read offline
![Data Integration
SAIL – Sample Availability System
12
• Overview of data – what is available
• Plan studies, investigate data available for subset of patients/samples
across data archives such as biobanks
O. Spjuth et al.
“Enabling integrative cross-
biobank research: the SAIL
method for harmonizing
and linking biomedical and
clinical data across
disparate data archives”
Eur J Hum Genet. 2015
Aug 26. [Epub ahead of
print]
Data
Availability](https://image.slidesharecdn.com/ecpcescience-academy2015-161207230838/85/Enabling-Translational-Medicine-with-e-Science-12-320.jpg)
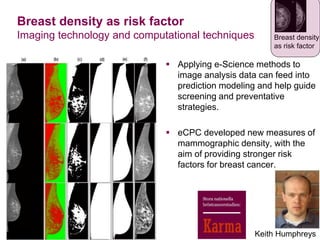
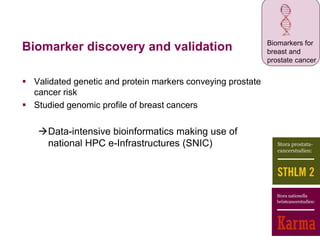
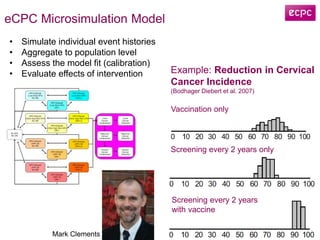
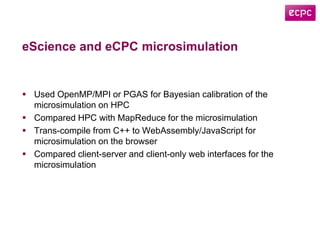
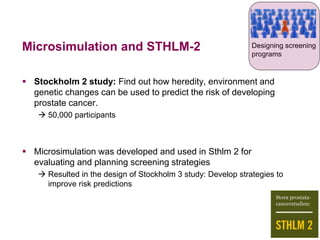
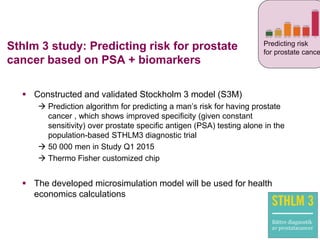
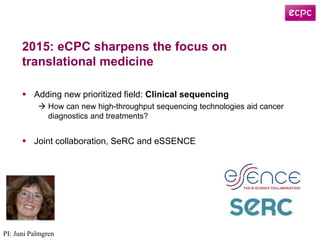
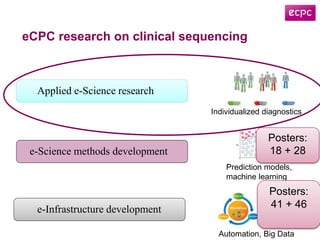
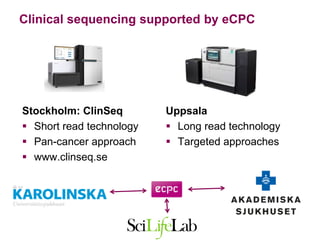
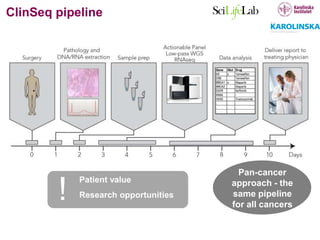
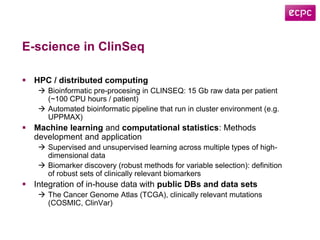
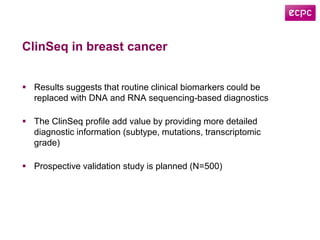
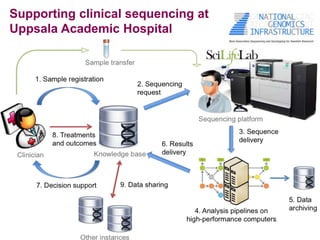
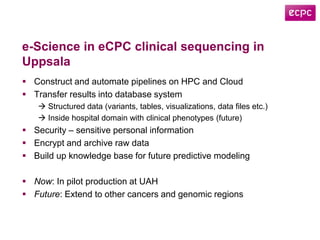

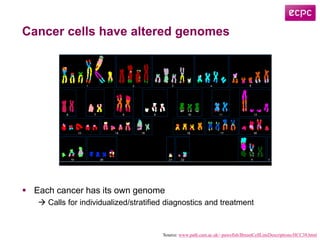
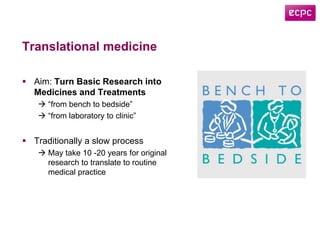
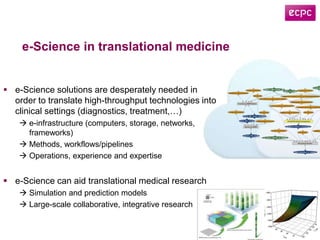
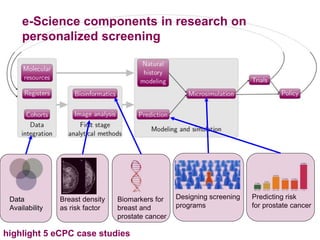
This document discusses how e-science can enable translational medicine and support cancer research. It highlights several projects using e-science approaches: 1) The SAIL method integrates data across biobanks to enable cross-archive research. 2) eCPC uses imaging analysis, biomarkers, and microsimulation modeling on high-performance computing to develop more accurate risk prediction and screening strategies. 3) The ClinSeq project applies clinical sequencing, machine learning, and data integration to develop individualized cancer diagnostics and define clinically relevant biomarkers.