This chapter discusses rapid learning health care as an approach to enable customized radiotherapy. It describes a 4-phase methodology: 1) collecting diverse patient, treatment and outcome data, 2) developing prediction models using machine learning to analyze the data, 3) applying the models in clinical practice via decision support systems, and 4) evaluating predicted vs actual outcomes. The goal is to improve treatment predictability and ensure patients receive optimal therapy while efficiently using resources. Next steps involve including patient preferences in decision making for personalized cancer care.


![CHAPTER 1
8
INTRODUCTION
World Health Organization positions cancer, with an estimated 8.2 million of annual
deaths (in 2012), and expected to increase by 70% in the next two decades, as a leading
cause of death [1]. In Oncology, disease’s exponential spread and fast development
dictates that depending exclusively on clinical trial evidences is becoming a non-
sustainable nor efficient way to deal with poor outcomes, thereupon rapid-learning
methodologies have been gaining increasing attention [2]. Rapid-learning health care
models are designed to routinely and iteratively learn from the continuously in grow
databases, that in return are renovated and improved. The “learning” phase encom-
passes high-quality data collection and analysis, aimed to generate evidences – clinical
prognostic tools, then to be implemented and evaluated in clinical practice (Figure 1),
further to generate new hypothesis, to be investigated by combination of old and newly
available data leading to a complete cycle repetition [3]. As a result, quality controlled
data collection routines are to be performed, as to improve robustness on clinical prog-
nostic tools development, correct validation procedures, studies replication and possi-
ble extensions (Figure 1) [4].
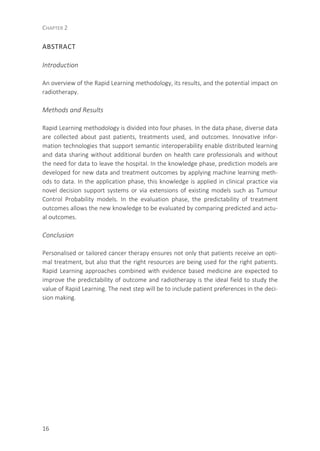
Figure 1 – From data to clinical prognostic tools: application-
specific prediction models or knowledge bases are generated,
based on institutional data (from [4]).](https://image.slidesharecdn.com/0e20c58a-e59d-4f72-b721-87c0da20639d-160804091812/85/E-book-Thesis-Sara-Carvalho-8-320.jpg)
![GENERAL INTRODUCTION AND OUTLINE OF THE THESIS
9
The ever-growing information availability is aimed to provide clinicians with means to
perform a deeper informed decision, aligned with the promise of an individualized and
personalized prognostication [2, 5]. However, the great increase and synergetic combi-
nation of diagnostic tools and treatment modalities, standard and pathologic factors,
biological, genetic, and other molecular characteristics of both patient and tumour’s,
are becoming unbearable to the limited human cognitive capacity, aggravating optimal
decisions for the individual patient [3, 6]. Clinical prognostic tools, generating evidence
through retrospective analysis of existing data as well as from data of prospective stud-
ies, are expected to actively contribute to a superior personalized medicine, implying a
good study design and analysis approaches for development and particularly validation
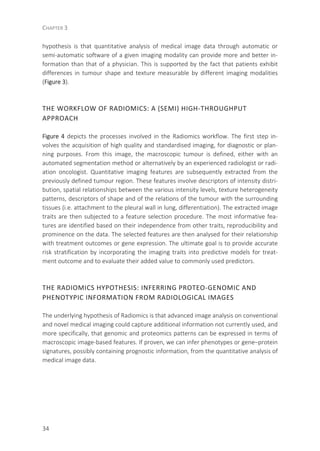
is followed [5].
OBJECTIVE OF THE THESIS
With 1.59 million reported deaths in 2012, lung cancer is the most common cause of
cancer death, being the most common cancer type among men and third most prevalent
in women (after breast and colorectal cancer). Two distinct forms of lung cancer are
identifiable: small cell (SCLC) and non-small cell lung cancer (NSCLC), with the latter ac-
counting for about 85% of the total number of cases, and being the focus of this thesis.
Clinical prognostic tools for an individualized and personalized medicine are a prima-
ry goal in lung cancer. For this purpose, identification of tumour traits to be incorpo-
rated into clinical prognostic tools resumes the main motivation of this work. However,
tissue sampling represents an extra burden for lung cancer patients and often, biopsies
are not possible to perform. Therefore, and accounting for this limitation, this thesis
aimed to identify and validate non-invasive sources of information, able to provide with
prognostic and predictive information, based on:
1. Imaging biomarkers: derived from 18
F-fluorodeoxyglucose (FDG) patterns of me-
tabolism assessed by positron emission tomography (PET) imaging of primary tu-
mour and metastatic lymph nodes, before radiotherapy delivery, and extended with
early variation of these metrics during treatment.
2. Blood-biomarkers: circulating oncoproteins related to hypoxia, inflammation, tu-
mour load and immune response.](https://image.slidesharecdn.com/0e20c58a-e59d-4f72-b721-87c0da20639d-160804091812/85/E-book-Thesis-Sara-Carvalho-9-320.jpg)
![GENERAL INTRODUCTION AND OUTLINE OF THE THESIS
11
Where I is the original image, I(x) represent the SUV of voxel x, and ID is the resulting
discretized image [7].
In Chapter 5 a stability analysis of all the imaging biomarkers analysed is presented.
These imaging biomarkers, often mentioned as Radiomics features along this thesis,
include first order statistic, shape and size descriptors, texture descriptors (including
grey-level co-occurrence – GLCM, grey-level run-length – RLGL and grey-level size zone
matrices – GLSZM) and intensity-volume histograms (IVH). Stability analysis comprised
the investigation of the robustness of these features in a test-retest scenario conducted
in 11 NSCLC patients, and across independent and manual delineations of five radiation
oncologists blinded to each other’s segmentations on pre-radiotherapy PET-CT scans of
23 NSCLC patients. Results and main conclusions presented in this chapter were used in
the next two for stable and robust features identification prior to further analysis. An
appendix to this chapter presents with mathematical formulations for the analysed
Radiomics features.
Chapter 6 resumes the hypothesis that early percentage variation of Radiomics fea-
tures derived from the primary lesion are predictive factors for overall survival assess-
ment of NSCLC. For this purpose, a multivariable model was derived on a dataset (n=54)
including a PET scan acquired prior to radiotherapy delivery and repeated early during
treatment. Findings were validated in two independent datasets (n=32 and 26) with
similar imaging acquisition protocol.
Lung cancer cells can enter lymphatic vessels and grow in lymph nodes around the
bronchi and in the mediastinum. The nodal stage is highly related to disease progression
and capability to metastasize and therefore determines treatment choice. In Chapter 7
the imaging analysis that so far was conducted solely for the primary tumour is extend-
ed to the metastatic lymph nodes, following the hypothesis that these may enclose
additional prognostic value. A multivariable model is developed based on the pre-
radiotherapy PET signal of a large dataset of nodal positive patients (n=262) and further
validated in an independent dataset of NSCLC patients (n=50).
3. Blood-biomarkers
Chapter 8 presents the work conducted in blood-biomarkers and the extension of a
clinical model comprising World Health Organization performance-status, forced expira-
tory volume in 1 second, number of positive lymph node stations, and gross tumour
volume (and sequent validation), by selecting amongst hypoxia [osteopontin (OPN) and
carbonic anhydrase IX (CA-IX)], inflammation [interleukin 6 (IL-6), IL-8, and C-reactive
protein (CRP)], and tumour load markers [carcinoembryonic antigen (CEA) and cy-
tokeratin fragment (CYFRA 21-1)]. This chapter was finalized with an extension of this
validated model by selecting amongst new markers, including immunological ones:
alpha-2-macroglobulin (α2M), serum IL-2 receptor (sIL2R), toll-like receptor 4 (TLR4),
and vascular endothelial growth factor (VEGF).](https://image.slidesharecdn.com/0e20c58a-e59d-4f72-b721-87c0da20639d-160804091812/85/E-book-Thesis-Sara-Carvalho-11-320.jpg)

![GENERAL INTRODUCTION AND OUTLINE OF THE THESIS
13
REFERENCES
[1] Stewart BW, Wild CP. World Cancer Report 2014. IARC.
[2] Lambin P, Zindler J, Vanneste B, van de Voorde L, Jacobs M, Eekers D, et al. Modern clinical research:
How rapid learning health care and cohort multiple randomised clinical trials complement traditional
evidence based medicine. Acta oncologica (Stockholm, Sweden). 2015 Oct;54(9):1289-1300.
[3] Abernethy AP, Etheredge LM, Ganz PA, Wallace P, German RR, Neti C, et al. Rapid-learning system for
cancer care. Journal of clinical oncology : official journal of the American Society of Clinical Oncology.
2010 Sep 20;28(27):4268-4274.
[4] Skripcak T, Belka C, Bosch W, Brink C, Brunner T, Budach V, et al. Creating a data exchange strategy for
radiotherapy research: towards federated databases and anonymised public datasets. Radiotherapy and
oncology : journal of the European Society for Therapeutic Radiology and Oncology. 2014
Dec;113(3):303-309.
[5] Mahar AL, Compton C, McShane LM, Halabi S, Asamura H, Rami-Porta R, et al. Refining Prognosis in Lung
Cancer: A Report on the Quality and Relevance of Clinical Prognostic Tools. Journal of thoracic oncology :
official publication of the International Association for the Study of Lung Cancer. 2015 Nov;10(11):1576-
1589.
[6] Oberije C, Nalbantov G, Dekker A, Boersma L, Borger J, Reymen B, et al. A prospective study comparing
the predictions of doctors versus models for treatment outcome of lung cancer patients: a step toward
individualized care and shared decision making. Radiotherapy and oncology : journal of the European
Society for Therapeutic Radiology and Oncology. 2014 Jul;112(1):37-43.
[7] Leijenaar RT, Nalbantov G, Carvalho S, van Elmpt WJ, Troost EG, Boellaard R, et al. The effect of SUV
discretization in quantitative FDG-PET Radiomics: the need for standardized methodology in tumour
texture analysis. Scientific reports. 2015;5:11075.](https://image.slidesharecdn.com/0e20c58a-e59d-4f72-b721-87c0da20639d-160804091812/85/E-book-Thesis-Sara-Carvalho-13-320.jpg)


![RAPID LEARNING HEALTH CARE IN ONCOLOGY
17
INTRODUCTION
Tailored cancer therapies, in which specific information about patients and tumours is
taken into account during treatment decisions, are an important step forward from
current population based therapy [1]. However, given the developments outlined be-
low, it is becoming increasingly difficult to identify the best treatment for an individual
cancer patient:
• Tumours and patients seem to be even less homogeneous than previously assumed,
meaning the same treatments can have different outcomes in patients who have
the same type of tumour. For instance, there are at least four molecular subtypes of
breast cancer, each with very different outcomes [2]. Based on gene signatures vari-
ous subgroups of tumours can be identified [3-8].
• The number of treatment options is increasing. For example, early stage prostate
cancer can now be treated with conservative treatment, prostatectomy, external
radiotherapy, stereotactic radiotherapy, LDR or HDR brachytherapy, high-intensity
focused ultrasound, hormone therapy, combination therapies and so on. A different
example is the recent rise of targeted therapies that are rapidly growing in numbers.
Performing classic randomised trials to compare all new treatment options with the
‘‘gold standard’’ is becoming impossible by the current speed of innovation.
• The evidence for the right choice in an individual patient is inadequate. First, ‘evi-
dence-based medicine’ and the ensuing guidelines always lag somewhat behind
practice, particularly in highly technological, innovative and rapidly evolving fields
such as radiotherapy. In addition, translating the results of clinical trials to the gen-
eral patient population and environment is not straightforward, given the higher
quality of care in clinical trials and the known selection bias (trials reach no more
than 3% of cancer patients, in radiotherapy this figure is even lower) [9-11]. Finally,
given the developments mentioned above – more treatment options and less ho-
mogeneous patient groups – the urgency to scaffold our treatment decisions with
robust knowledge and the demand for evidence-based medicine is larger than ever.
• It is becoming more difficult to find the right evidence. Despite – or perhaps due to –
the fact that papers are being published in rapidly increasing numbers (e.g., as a ra-
diation-oncologist specializing in lung cancer, has to read around eight articles per
day to keep up with the literature [12]), it is difficult to match the characteristics of
the individual patient to evidence from the literature and to evaluate the quality of
that evidence](https://image.slidesharecdn.com/0e20c58a-e59d-4f72-b721-87c0da20639d-160804091812/85/E-book-Thesis-Sara-Carvalho-17-320.jpg)
![CHAPTER 2
18
Figure 1 – Current paradigm versus future paradigm (modified from [13]).
The developments illustrated above have given rise to a search for an alternative to the
elaborate consensus- and evidence-based guideline medicine format when it comes to
making treatment decisions. The alternative discussed in this article is rapid learning
[14]. Although it is known under various names, including Knowledge-driven Healthcare,
Computer Assisted Theragnostics and Learning Intelligence Network, the basic idea in
all cases is the (re)use of historical data from routine clinical practice for decisions con-
cerning new patients or to test new hypothesis [15-20] (Figure 1). This has a number of
obvious advantages, such as the large number of readily available patients and less
selection bias compared to clinical trials. However, it also has some important disad-
vantages; for example, the quality of the data in clinical practice is much lower than in
clinical trials [21]. There is a long very successful history of putting genomic data public
and reusing them [3-8]. This paper provides an overview of the methods used in Rapid
Learning, the initial results, and an outlook as to how the techniques involved may in-
fluence clinical radiotherapy.
METHODS AND RESULTS
Rapid Learning involves four phases (Figure 2) [14] which are continually iterated. In the
data phase, data on past patients are collected, including their delivered treatments and
outcomes. In the knowledge phase, knowledge is generated from these data. In the
application phase, this knowledge is applied to clinical practice. In the final evaluation](https://image.slidesharecdn.com/0e20c58a-e59d-4f72-b721-87c0da20639d-160804091812/85/E-book-Thesis-Sara-Carvalho-18-320.jpg)
![RAPID LEARNING HEALTH CARE IN ONCOLOGY
19
phase, the outcomes are evaluated, after which the first phase starts again. In every
phase, external knowledge (e.g., from clinical trials) is used to optimise the phase. The
sections below describe the methods used and examples of typical results for every
phase.
Figure 2 – Four phases of Rapid Learning [14].
Data
Rapid Learning requires both a great deal of data and a large diversity of data. The
amount of data is important (a) to obtain higher quality knowledge (the quality of the
knowledge correlates with the number of patients on which that knowledge is based)
and (b) to be able to generate knowledge concerning smaller, more homogeneous pa-
tient groups and/or use more variables in the knowledge phase. The diversity of the
data (particularly with respect to the treatments used, but also in terms of patient char-
acteristics) is important to ultimately decide which treatment is best for an individual
patient. Obtaining enough data of sufficient quality and diversity is the biggest challenge
in Rapid Learning. This is only possible if data are shared across institutional and nation-
al borders, both academic and community health care systems. Such data sharing is
hampered by a lack of time; differences in language and culture as well as data record-
ing practices; the academic and political value of data; risks to reputation; privacy and
legal aspects and so on. Nonetheless, one project that has made successful use of data
sharing is euroCAT (www.eurocat.info), a collaborative project involving radiotherapy](https://image.slidesharecdn.com/0e20c58a-e59d-4f72-b721-87c0da20639d-160804091812/85/E-book-Thesis-Sara-Carvalho-19-320.jpg)
![CHAPTER 2
20
institutes in the Netherlands, Germany and Belgium. A crucial factor in the success of
this project was the use of innovative information technologies, which made it possible
to learn from each other’s data without the data having to leave the institution (a con-
cept known as distributed learning). Another important factor was the development of
a dataset with semantic interoperability (also known as ‘data with linguistic unity’ or
‘machine-readable data’), in which local terms are converted into concepts from a well-
defined ontology (e.g., NCI Thesaurus, SNOMED). In such an approach, the ontology
terms serve as a common interface to the data at each institutional site, enabling a
common approach to information retrieval and reasoning facilitated through a semantic
portal to the data. This semantic interoperability approach also allows one to add data
from clinical trials to further strengthen the data available to Rapid Learning.
The data collected in routine clinical care are often of lower quality compared to
data from clinical trials. Data captured in routine care are often incorrect, contradictory,
missing and biased.
Although many problems are mitigated by the sheer volume of data, it is important
to include data quality improvement protocols varying from simple logic (e.g. it is im-
possible to be 60 kg and have a BMI of 32) to more probabilistic approaches (e.g. for a
similar patient cohort the median value of the maximal standard uptake value from 18
F-
FDGDG PET scans should be similar between two institutes). A positive effect of such
initiatives is that they give rise to increasing coordination with respect to what data
need to be collected and how (i.e., disease-specific ‘umbrella’ protocols). The end users
of the knowledge, the provider and the patient, not only need to gain insight into ef-
fects of various treatment options, but also in uncertainties, conflicting data, and toxici-
ties and other treatment burden. It should be noted that getting data in the proposed
manner does not mean that there is a need to capture more data, which would be an
unacceptable additional burden to often overloaded professionals. Rather, the data that
are already captured in routine care and in clinical trials are combined and re-used.
There are various prototypes to do this such as in the euroCAT project where a fully
automated, daily synchronisation of the clinical databases into a semantically interoper-
able dataset takes place.
Knowledge
Machine learning is used to extract knowledge from great amounts of data. In machine
learning, models/algorithms are developed that best describe the data but that can also
make predictions for new, unseen data. Models trained on retrospective data may be
used to predict the outcomes (e.g., survival, quality of life, toxicity, etc.) of various
treatments on the basis of data from a new patient. Obviously, it is crucial that such
models are adequately validated [22]; a non-validated model is of very limited value. To
this end, a validation set should always be available, preferably from a different institute
than that from which the data were used to create the model. Examples of radiotherapy](https://image.slidesharecdn.com/0e20c58a-e59d-4f72-b721-87c0da20639d-160804091812/85/E-book-Thesis-Sara-Carvalho-20-320.jpg)
![RAPID LEARNING HEALTH CARE IN ONCOLOGY
21
models (on the basis of both clinical trials and Rapid Learning) are available for non-
small cell lung, rectal and head-and-neck cancer on http://www.predictcancer.org,
breast cancer on http://research.nki.nl/ibr/ and glioblastoma on http://www.eortc.be/
tools/gbmcalculator/.
Application
In this phase, the knowledge generated by Rapid Learning is applied with the help of
decision support systems (DSS). Typically, these are tools and software applications that
can be used to apply knowledge-driven healthcare in practice. Examples include nomo-
grams (as in Figure 3) [15, 16, 23-27] and websites such as those named above, for
radiotherapy models, which help predict the expected treatment outcome of radiother-
apy when they are supplied with the parameters specifically relevant to the clinical
case. Decision support systems are neither intended nor suited as a replacement for the
physician as a healthcare professional. They are designed to support the physician and
the patient in making a more informed decision with respect to a particular treatment.
The use of computer models to support healthcare professionals in their efforts is, of
course, not new in radiation oncology. Physics-based computer models, with which
doses can be better calculated than by hand, as well as radiobiology-based Normal
Tissue Complications Probability (NTCP) and Tumour Control Probability (TCP) models to
correlate the given dose with tumour control and toxicity, are commonplace within
radiotherapy [28, 29]. For example, geometrical models based on tumour volume alone
have shown additional value next to classical TNM classification as well [30]. The new
models emerging from Rapid Learning are a natural extension of this to patient out-
comes. However, a key difference is that the Rapid Learning models are more ‘holistic’
and multifactorial than the current physics- or radiobiology-based models, as they also
take patient, tumour and non-radiotherapy factors into account [31]. For instance, a
Rapid Learning model of radiation-induced oesophagitis shows that the risk for this
toxicity not only depends on the dose to which the oesophagus is exposed, but also
greatly increases if chemotherapy is given concomitantly [32]. Another example is that
the survival of non-metastatic unresectable non-small cell lung cancer is better predict-
ed by a multifactorial model based on clinical and imaging variables, and even more
when blood biomarkers are included [32, 33]. In both cases the models outperform the
prognostic value of TNM classification.
Evaluation
The underlying idea in Rapid Learning is that the application of knowledge acquired
from routine data leads to predictability of treatment outcomes, meaning that these
outcomes can be improved in terms of both effectiveness (achieving the desired result)
and efficiency (the resources needed to achieve the result). Naturally, this needs to be](https://image.slidesharecdn.com/0e20c58a-e59d-4f72-b721-87c0da20639d-160804091812/85/E-book-Thesis-Sara-Carvalho-21-320.jpg)
![CHAPTER 2
22
continually evaluated, focusing on the question ‘Is the outcome of the treatment as
predicted?’ Compared to the consensus- and evidence based guideline knowledge that
is preferably constructed with (meta-analysis of) robust experimental data that are
interpreted by multiple stakeholders including health care economists and patient rep-
resentatives, the prediction models may suffer from confounders and election bias. For
Rapid Learning, having high-quality data with respect to outcomes is crucial. This implies
the use of broadly accepted taxonomies such as RECIST or pathological Complete Re-
sponse for tumour response [34], CTCAE for toxicity [35] and euroQoL for quality of life
& utilities (which allow to calculate Quality Adjusted Life Year (QALY)) [36, 37]. Natural-
ly, keeping thorough records of treatment outcomes is important not only for Rapid
Learning, but also for initiatives such as the quality registration system for lung cancer
patients initiated by the Dutch Society for Radiotherapy and Oncology.
DISCUSSION
Tailored cancer treatment is a necessity, to ensure not only that the individual patient
receives the treatment that best suits his or her wishes, and to avoid under or over-
treatment but also to optimize resources, so that the right resources are being used for
the right patients in healthcare in a broader sense. However, tailored cancer treatment
is also a challenge: the great diversity of cancer patients and treatments implies that it is
by no means always clear which choice leads to which treatment outcome. Especially in
cases where the treatment options under consideration have no clear clinical advantage
in the outcome, a shared decision-making process can be employed in order to make
the most of patient preferences. Tailored therapy is also necessary for radiotherapy.
The radiosensitivity of tumours and normal tissues is often unknown, certainly not ho-
mogeneous within an individual patient, and even less so between patients [38-41]. In
addition, the range of treatment options and thus the number of decisions that need to
be made within radiotherapy have risen sharply, largely due to technological innova-
tions such as IMRT, VMAT, IGRT and particle therapy as well as innovative combinations
with systemic and targeted treatments such as tyrosine inhibitors or monoclonal anti-
bodies (e.g., Cetuximab). Opting for a particular radiation treatment on the basis of
expected outcomes is therefore difficult, and the established guidelines and literature
provide only limited support in this regard.
This article has discussed Rapid Learning as a means of support when deciding on a
tailored radiation treatment. In essence, Rapid Learning involves reusing local, clinical,
routine data to develop knowledge in the form of models that can predict treatment
outcomes, and then clinically applying and carefully evaluating these models by way of
Decision Support Systems. The hypothesis is that treatment outcomes obtained in the
past can be used to predict future results.](https://image.slidesharecdn.com/0e20c58a-e59d-4f72-b721-87c0da20639d-160804091812/85/E-book-Thesis-Sara-Carvalho-22-320.jpg)
![RAPID LEARNING HEALTH CARE IN ONCOLOGY
23
Figure 3 – Example of a nomogram [23].
Earlier attempts to introduce so-called ‘expert systems’ had mixed results. The proposed
Rapid Learning methodology is different from the earlier attempts to deploy expert sys-
tems in several ways: it makes use of larger quantities of relevant data (e.g. the clinical
patient population), as steadily more clinical data become available electronically in the
clinical environment. This also enables validation in one’s local practice which is a pre-
requisite for any expert system to be accepted, similar to commissioning and acceptance
of treatment planning systems in radiotherapy. In contrast with expert systems, Rapid
Learning employs quantitative models in addition to qualitative models. Finally, the de
facto current expert system from “literature and guidelines based on clinical trials” has
limited application to personalised medicine. This will drive the demand for more flexible
and rapidly updated expert systems such as proposed in this review. The Rapid Learning
approach seems to contradict the principles of evidence-based medicine, in which
treatment decisions are based solely on results obtained from controlled clinical trials. In
fact, it does not; both approaches are complementary (Figure 4). This is compounded by
the fact that Rapid Learning is based on results obtained from the less controlled setting
of clinical practice. These different environments yield different insights. Controlled
clinical trials primarily aim to identify small improvements in results between two
treatments in a patient group that is as homogeneous as possible. In contrast, Rapid
Learning will reveal major differences in treatment outcomes that stem from the heter-
ogeneity of the patient group. It will be inferior in detecting minor differences in treat-
ments due to the lower quality of the data recorded in clinical practice as compared to
the same treatment in a clinical trial. In addition, Rapid Learning can be seen as an al-
ternative for situations in which there are insufficient evidence to make decisions in line
with the principles of evidence-based medicine. This is often the case with technological
innovations; for instance, when considering the use of new techniques (e.g., IMRT,](https://image.slidesharecdn.com/0e20c58a-e59d-4f72-b721-87c0da20639d-160804091812/85/E-book-Thesis-Sara-Carvalho-23-320.jpg)
![CHAPTER 2
24
protons) in the field of radiotherapy [42]. Rapid Learning is new and still needs to prove
its value as a supplement to traditional, evidence-based approaches. There are several
developments that might help Rapid Learning change the way scientific evidence is
viewed in medicine: (a) Technological advances will be created by larger and higher
quality databases that link electronic health records with research databases, as well as
the advent of the Semantic Web with increased interoperability and distributed learning
approaches that enable learning from data without the need for data to leave the hos-
pital; (b) The development by domain experts of qualitative criteria to evaluate evi-
dence coming from large databases and rapid learning approaches; (c) The increased
pressure and possible reimbursement from healthcare payers to use Decision Support
Systems, especially for high cost treatments such as proton therapy; and (d) The devel-
opment of ‘‘clinical grade’’ and certified commercial decision support systems.
Radiotherapy seems to be the ideal setting to study the value of Rapid Learning, given
the field’s high degree of computerisation, as well as its long use and acceptance of pre-
dictive models. Within clinical radiotherapy, models and planning systems should become
available that make it possible to not only plan on the basis of physical dose and Dose
Volume Histograms parameters, but also to explain the relationship with the expected
clinical outcomes in individual patients. Translating knowledge to an individual patient is
challenging, particularly in so-called preference-sensitive situations where there are trade-
offs between options with more or less equally desirable outcomes, but in which different
individuals may value differently e.g. in terms of side effects. As access to health-related
information improves, patients have an increased desire to be in charge of their own life
and health. Despite investment in efforts to improve the skills of clinicians, patients con-
tinue to report low levels of involvement [43]. There is indeed evidence level 1 from a
Cochrane systematic review evaluating 86 studies involving 20,209 participants included
in published randomized controlled trials demonstrating that decision aids increase peo-
ple’s involvement, support informed values-based choices in patient practitioner commu-
nication, and improve knowledge and realistic perception of outcomes. We therefore
believe the next step will be to integrate, whenever possible, Shared Decision Making
approaches (see for example www.treatmentchoice.info; www.optiongrid.org) to include
the patient perspective in the choice of best treatment [27].](https://image.slidesharecdn.com/0e20c58a-e59d-4f72-b721-87c0da20639d-160804091812/85/E-book-Thesis-Sara-Carvalho-24-320.jpg)

![CHAPTER 2
26
REFERENCES
[1] Lambin P, Petit SF, Aerts HJ, van Elmpt WJ, Oberije CJ, Starmans MH, et al. The ESTRO Breur Lecture
2009. From population to voxel-based radiotherapy: exploiting intra-tumour and intra-organ
heterogeneity for advanced treatment of non-small cell lung cancer. Radiotherapy and oncology : journal
of the European Society for Therapeutic Radiology and Oncology. 2010 Aug;96(2):145-152.
[2] Koboldt DC, Fulton RS, McLellan MD. Comprehensive molecular portraits of human breast tumours.
Nature. 2012 Oct 4;490(7418):61-70.
[3] Seigneuric R, Starmans MH, Fung G, Krishnapuram B, Nuyten DS, van Erk A, et al. Impact of supervised
gene signatures of early hypoxia on patient survival. Radiotherapy and oncology : journal of the
European Society for Therapeutic Radiology and Oncology. 2007 Jun;83(3):374-382.
[4] Starmans MH, Chu KC, Haider S, Nguyen F, Seigneuric R, Magagnin MG, et al. The prognostic value of
temporal in vitro and in vivo derived hypoxia gene-expression signatures in breast cancer. Radiotherapy
and oncology : journal of the European Society for Therapeutic Radiology and Oncology. 2012
Mar;102(3):436-443.
[5] Starmans MH, Fung G, Steck H, Wouters BG, Lambin P. A simple but highly effective approach to
evaluate the prognostic performance of gene expression signatures. PloS one. 2011;6(12):e28320.
[6] Starmans MH, Lieuwes NG, Span PN, Haider S, Dubois L, Nguyen F, et al. Independent and functional
validation of a multi-tumour-type proliferation signature. British journal of cancer. 2012 Jul
24;107(3):508-515.
[7] Starmans MH, Zips D, Wouters BG, Baumann M, Lambin P. The use of a comprehensive tumour xenograft
dataset to validate gene signatures relevant for radiation response. Radiotherapy and oncology : journal of
the European Society for Therapeutic Radiology and Oncology. 2009 Sep;92(3):417-422.
[8] Voets AM, Oberije C, Struijk RB, Reymen B, De Ruyck K, Thierens H, et al. No association between TGF-
beta1 polymorphisms and radiation-induced lung toxicity in a European cohort of lung cancer patients.
Radiotherapy and oncology : journal of the European Society for Therapeutic Radiology and Oncology.
2012 Dec;105(3):296-298.
[9] Movsas B, Moughan J, Owen J, Coia LR, Zelefsky MJ, Hanks G, et al. Who enrolls onto clinical oncology
trials? A radiation Patterns Of Care Study analysis. International journal of radiation oncology, biology,
physics. 2007 Jul 15;68(4):1145-1150.
[10] Grand MM, O'Brien PC. Obstacles to participation in randomised cancer clinical trials: a systematic
review of the literature. Journal of medical imaging and radiation oncology. 2012 Feb;56(1):31-39.
[11] Murthy VH, Krumholz HM, Gross CP. Participation in cancer clinical trials: race-, sex-, and age-based
disparities. Jama. 2004 Jun 9;291(22):2720-2726.
[12] Bastian H, Glasziou P, Chalmers I. Seventy-five trials and eleven systematic reviews a day: how will we
ever keep up? PLoS medicine. 2010 Sep;7(9):e1000326.
[13] Deasy JO, Bentzen SM, Jackson A, Ten Haken RK, Yorke ED, Constine LS, et al. Improving normal tissue
complication probability models: the need to adopt a "data-pooling" culture. International journal of
radiation oncology, biology, physics. 2010 Mar 1;76(3 Suppl):S151-154.
[14] Abernethy AP, Etheredge LM, Ganz PA, Wallace P, German RR, Neti C, et al. Rapid-learning system for
cancer care. Journal of clinical oncology : official journal of the American Society of Clinical Oncology.
2010 Sep 20;28(27):4268-4274.
[15] Dehing-Oberije C, Yu S, De Ruysscher D, Meersschout S, Van Beek K, Lievens Y, et al. Development and
external validation of prognostic model for 2-year survival of non-small-cell lung cancer patients treated
with chemoradiotherapy. International journal of radiation oncology, biology, physics. 2009 Jun
1;74(2):355-362.
[16] Egelmeer AG, Velazquez ER, de Jong JM, Oberije C, Geussens Y, Nuyts S, et al. Development and
validation of a nomogram for prediction of survival and local control in laryngeal carcinoma patients
treated with radiotherapy alone: a cohort study based on 994 patients. Radiotherapy and oncology :
journal of the European Society for Therapeutic Radiology and Oncology. 2011 Jul;100(1):108-115.](https://image.slidesharecdn.com/0e20c58a-e59d-4f72-b721-87c0da20639d-160804091812/85/E-book-Thesis-Sara-Carvalho-26-320.jpg)
![RAPID LEARNING HEALTH CARE IN ONCOLOGY
27
[17] Jimenez MF, van Baardwijk A, Aerts HJ, De Ruysscher D, Novoa NM, Varela G, et al. Effectiveness of
surgery and individualized high-dose hyperfractionated accelerated radiotherapy on survival in clinical
stage I non-small cell lung cancer. A propensity score matched analysis. Radiotherapy and oncology :
journal of the European Society for Therapeutic Radiology and Oncology. 2010 Dec;97(3):413-417.
[18] Roelofs E, Engelsman M, Rasch C, Persoon L, Qamhiyeh S, de Ruysscher D, et al. Results of a multicentric
in silico clinical trial (ROCOCO): comparing radiotherapy with photons and protons for non-small cell lung
cancer. Journal of thoracic oncology : official publication of the International Association for the Study of
Lung Cancer. 2012 Jan;7(1):165-176.
[19] Lambin P, Rios-Velazquez E, Leijenaar R, Carvalho S, van Stiphout RG, Granton P, et al. Radiomics:
extracting more information from medical images using advanced feature analysis. European journal of
cancer (Oxford, England : 1990). 2012 Mar;48(4):441-446.
[20] Roelofs E, Persoon L, Nijsten S, Wiessler W, Dekker A, Lambin P. Benefits of a clinical data warehouse
with data mining tools to collect data for a radiotherapy trial. Radiotherapy and oncology : journal of the
European Society for Therapeutic Radiology and Oncology. 2013 Jul;108(1):174-179.
[21] van Elmpt W, Nijsten S, Mijnheer B, Dekker A, Lambin P. The next step in patient-specific QA: 3D dose
verification of conformal and intensity-modulated RT based on EPID dosimetry and Monte Carlo dose
calculations. Radiotherapy and oncology : journal of the European Society for Therapeutic Radiology and
Oncology. 2008 Jan;86(1):86-92.
[22] Steyerberg EW, Vickers AJ, Cook NR, Gerds T, Gonen M, Obuchowski N, et al. Assessing the performance
of prediction models: a framework for traditional and novel measures. Epidemiology (Cambridge, Mass).
2010 Jan;21(1):128-138.
[23] Valentini V, van Stiphout RG, Lammering G, Gambacorta MA, Barba MC, Bebenek M, et al. Nomograms
for predicting local recurrence, distant metastases, and overall survival for patients with locally advanced
rectal cancer on the basis of European randomized clinical trials. Journal of clinical oncology : official
journal of the American Society of Clinical Oncology. 2011 Aug 10;29(23):3163-3172.
[24] De Ruysscher D, Dehing C, Yu S, Wanders R, Ollers M, Dingemans AM, et al. Dyspnea evolution after
high-dose radiotherapy in patients with non-small cell lung cancer. Radiotherapy and oncology : journal
of the European Society for Therapeutic Radiology and Oncology. 2009 Jun;91(3):353-359.
[25] De Ruysscher D, Houben A, Aerts HJ, Dehing C, Wanders R, Ollers M, et al. Increased (18)F-deoxyglucose
uptake in the lung during the first weeks of radiotherapy is correlated with subsequent Radiation-
Induced Lung Toxicity (RILT): a prospective pilot study. Radiotherapy and oncology : journal of the
European Society for Therapeutic Radiology and Oncology. 2009 Jun;91(3):415-420.
[26] Dehing-Oberije C, De Ruysscher D, van Baardwijk A, Yu S, Rao B, Lambin P. The importance of patient
characteristics for the prediction of radiation-induced lung toxicity. Radiotherapy and oncology : journal
of the European Society for Therapeutic Radiology and Oncology. 2009 Jun;91(3):421-426.
[27] Stacey D, Bennett CL, Barry MJ, Col NF, Eden KB, Holmes-Rovner M, et al. Decision aids for people facing
health treatment or screening decisions. The Cochrane database of systematic reviews.
2011(10):CD001431.
[28] Bentzen SM, Dorr W, Gahbauer R, Howell RW, Joiner MC, Jones B, et al. Bioeffect modeling and
equieffective dose concepts in radiation oncology--terminology, quantities and units. Radiotherapy and
oncology : journal of the European Society for Therapeutic Radiology and Oncology. 2012
Nov;105(2):266-268.
[29] De Leeuw AA, Van de Kamer JB, Moerland MA, Philippens ME, Jurgenliemk-Schulz IM. The effect of
alternative biological modelling parameters (alpha/beta and half time of repair T (1/2) ) on reported
EQD2 values in the treatment of advanced cervical cancer. Radiotherapy and oncology : journal of the
European Society for Therapeutic Radiology and Oncology. 2011 Nov;101(2):337-342.
[30] Guo R, Sun Y, Yu XL, Yin WJ, Li WF, Chen YY, et al. Is primary tumour volume still a prognostic factor in
intensity modulated radiation therapy for nasopharyngeal carcinoma? Radiotherapy and oncology :
journal of the European Society for Therapeutic Radiology and Oncology. 2012 Sep;104(3):294-299.](https://image.slidesharecdn.com/0e20c58a-e59d-4f72-b721-87c0da20639d-160804091812/85/E-book-Thesis-Sara-Carvalho-27-320.jpg)
![CHAPTER 2
28
[31] Lambin P, van Stiphout RG, Starmans MH, Rios-Velazquez E, Nalbantov G, Aerts HJ, et al. Predicting
outcomes in radiation oncology--multifactorial decision support systems. Nature reviews Clinical
oncology. 2013 Jan;10(1):27-40.
[32] Dehing-Oberije C, De Ruysscher D, Petit S, Van Meerbeeck J, Vandecasteele K, De Neve W, et al.
Development, external validation and clinical usefulness of a practical prediction model for radiation-
induced dysphagia in lung cancer patients. Radiotherapy and oncology : journal of the European Society
for Therapeutic Radiology and Oncology. 2010 Dec;97(3):455-461.
[33] Dehing-Oberije C, Aerts H, Yu S, De Ruysscher D, Menheere P, Hilvo M, et al. Development and validation
of a prognostic model using blood biomarker information for prediction of survival of non-small-cell lung
cancer patients treated with combined chemotherapy and radiation or radiotherapy alone
(NCT00181519, NCT00573040, and NCT00572325). International journal of radiation oncology, biology,
physics. 2011 Oct 1;81(2):360-368.
[34] Eisenhauer EA, Therasse P, Bogaerts J, Schwartz LH, Sargent D, Ford R, et al. New response evaluation
criteria in solid tumours: revised RECIST guideline (version 1.1). European journal of cancer (Oxford,
England : 1990). 2009 Jan;45(2):228-247.
[35] Trotti A, Colevas AD, Setser A, Rusch V, Jaques D, Budach V, et al. CTCAE v3.0: development of a
comprehensive grading system for the adverse effects of cancer treatment. Seminars in radiation
oncology. 2003 Jul;13(3):176-181.
[36] Grutters JP, Kessels AG, Pijls-Johannesma M, De Ruysscher D, Joore MA, Lambin P. Comparison of the
effectiveness of radiotherapy with photons, protons and carbon-ions for non-small cell lung cancer: a
meta-analysis. Radiotherapy and oncology : journal of the European Society for Therapeutic Radiology
and Oncology. 2010 Apr;95(1):32-40.
[37] Peeters A, Grutters JP, Pijls-Johannesma M, Reimoser S, De Ruysscher D, Severens JL, et al. How costly is
particle therapy? Cost analysis of external beam radiotherapy with carbon-ions, protons and photons.
Radiotherapy and oncology : journal of the European Society for Therapeutic Radiology and Oncology.
2010 Apr;95(1):45-53.
[38] Aerts HJ, Bussink J, Oyen WJ, van Elmpt W, Folgering AM, Emans D, et al. Identification of residual
metabolic-active areas within NSCLC tumours using a pre-radiotherapy FDG-PET-CT scan: a prospective
validation. Lung cancer (Amsterdam, Netherlands). 2012 Jan;75(1):73-76.
[39] van Loon J, Janssen MH, Ollers M, Aerts HJ, Dubois L, Hochstenbag M, et al. PET imaging of hypoxia using
[18F]HX4: a phase I trial. European journal of nuclear medicine and molecular imaging. 2010
Aug;37(9):1663-1668.
[40] Mortensen LS, Johansen J, Kallehauge J, Primdahl H, Busk M, Lassen P, et al. FAZA PET/CT hypoxia
imaging in patients with squamous cell carcinoma of the head and neck treated with radiotherapy:
results from the DAHANCA 24 trial. Radiotherapy and oncology : journal of the European Society for
Therapeutic Radiology and Oncology. 2012 Oct;105(1):14-20.
[41] Zips D, Zophel K, Abolmaali N, Perrin R, Abramyuk A, Haase R, et al. Exploratory prospective trial of
hypoxia-specific PET imaging during radiochemotherapy in patients with locally advanced head-and-neck
cancer. Radiotherapy and oncology : journal of the European Society for Therapeutic Radiology and
Oncology. 2012 Oct;105(1):21-28.
[42] Langendijk JA, Lambin P, De Ruysscher D, Widder J, Bos M, Verheij M. Selection of patients for
radiotherapy with protons aiming at reduction of side effects: the model-based approach. Radiotherapy
and oncology : journal of the European Society for Therapeutic Radiology and Oncology. 2013
Jun;107(3):267-273.
[43] Stiggelbout AM, Van der Weijden T, De Wit MP, Frosch D, Legare F, Montori VM, et al. Shared decision
making: really putting patients at the centre of healthcare. BMJ (Clinical research ed). 2012;344:e256.](https://image.slidesharecdn.com/0e20c58a-e59d-4f72-b721-87c0da20639d-160804091812/85/E-book-Thesis-Sara-Carvalho-28-320.jpg)
![RADIOMICS: EXTRACTING MORE INFORMATION FROM MEDICAL IMAGES
31
INTRODUCTION
The use and role of medical imaging technologies in clinical oncology has greatly expand-
ed from primarily a diagnostic tool to include a more central role in the context of indi-
vidualised medicine over the past decade (Figure 1). It is expected that imaging contains
complementary and interchangeable information compared to other sources, e.g. de-
mographics, pathology, blood biomarkers, genomics and that combining these sources of
information will improve individualised treatment selection and monitoring [1].
Cancer can be probed in many ways depending on the non-invasive imaging device
used or the mode by which it operates (Figure 2). Classically, anatomical computed
tomography (CT) imaging is an often used modality, acquiring images of the ‘anatome’
in high resolution (e.g. 1 mm3
). CT imaging is now routinely used and is playing an es-
sential role in all phases of cancer management, including prediction, screening, biopsy
guidance for detection, treatment planning, treatment guidance and treatment re-
sponse evaluation [2, 3]. CT is used in the assessment of structural features of cancer
but it is not perceived to portray functional or molecular details of solid tumours. Func-
tional imaging concerns physiological processes and functions such as diffusion, perfu-
sion and glucose uptake. Here, commonly used methodologies are dynamic contract
enhanced-magnetic resonance imaging (DCE-MRI), assessing tumour perfusion and
fluoro-2-Deoxy-D-glucose (FDG) positron emission tomography (PET) imaging, assessing
tumour metabolism, which both often are found to have prognostic value [4-6]. Finally,
another modality is molecular imaging, visualising at the level of specific pathways or
macro-molecule in vivo. For example, there are molecular markers assessing tumour
hypoxia or labelled antibodies, assessing receptor expression levels of a tumour [1, 7].
Over the past decades, medical imaging has progressed in four distinct ways:
• Innovations in medical devices (hardware): This concerns improvements in imaging
hardware and the development of combined modality machines. For example, in
the last decade we moved from single slice CT to multiple slices CT and CT/PET.
More recent developments are dual-source and dual-energy CT. These techniques
significantly increase the temporal resolution for 4-D CT reconstructions allowing
visualisation of fine structures in tissues, also in several stages in the cardiac or res-
piration phase. Moreover, dual-energy CT can be used to improve identification of
tissue composition and density.
• Innovations in imaging agents: Innovations in imaging agents (or imaging biomarker,
imaging probe, radiotracer), i.e. molecular substances injected in the body and used
as an indicator of a specific biological process occurring in the body. This is achieved
by contrast agents, i.e. an imaging agent using positive emission tomography (radio-
tracer).](https://image.slidesharecdn.com/0e20c58a-e59d-4f72-b721-87c0da20639d-160804091812/85/E-book-Thesis-Sara-Carvalho-31-320.jpg)
![RADIOMICS: EXTRACTING MORE INFORMATION FROM MEDICAL IMAGES
33
available, allowing for more quantification and standardisation. This has been illus-
trated by the development of the computer-assisted detection (CAD systems) that
improves the performance of detecting cancer in mammography or in lung cancer
diseases [8].
Figure 2 – Multilevel imaging: anatomical, functional, and molecular imaging.
A common use is to find indications of pathological processes, e.g. hypoxia markers
using PET imaging.
Radiomics focuses on improvements of image analysis, using an automated high-
throughput extraction of large amounts (200+) of quantitative features of medical im-
ages and belongs to the last category of innovations in medical imaging analysis. The](https://image.slidesharecdn.com/0e20c58a-e59d-4f72-b721-87c0da20639d-160804091812/85/E-book-Thesis-Sara-Carvalho-33-320.jpg)
![RADIOMICS: EXTRACTING MORE INFORMATION FROM MEDICAL IMAGES
35
Figure 3 – (A) Two representative 3-D representations of a round tumour (top) and spiky tumour (bottom)
measured by computed tomography (CT) imaging. (B) Texture differences between non-small cell lung cancer
(NSCLC) tumours measured using CT imaging, more heterogeneous (top) and more homogeneous (bottom).
(C) Differences of FDG-PET uptake, showing heterogeneous uptake.
Figure 4 – The Radiomics workflow. On the medical images, segmentation is performed to define the tumour
region. From this region the features are extracted, e.g. features based on tumour intensity, texture and
shape. Finally, these features are used for analysis, e.g. the features are assessed for their prognostic power,
or linked with stage, or gene expression.
This hypothesis is supported by image-guided biopsies, which demonstrated that tu-
mours show spatial differences in protein expressions [9]. More specifically, it has been
demonstrated that major differences in protein expression patterns within a tumour
can be correlated to radiographic findings (or radiophenotypes) such as contrast-
enhanced and non-enhanced regions based on CT data [10]. The authors suggest that
image-guided proteomics holds promise for characterising tissues prior to treatment
decisions and without imaging there is indeed a risk that the optimum treatment deci-
sion could be neglected (i.e. the use or not of a targeted agent). Also, Kuo et al. report-](https://image.slidesharecdn.com/0e20c58a-e59d-4f72-b721-87c0da20639d-160804091812/85/E-book-Thesis-Sara-Carvalho-35-320.jpg)
![CHAPTER 3
36
ed the association of CT-derived imaging traits with histo-pathologic markers, and sev-
eral pre-defined gene expression modules on liver cancer [11, 12]. In ovarian carcino-
ma, an imaging feature describing the enhancement fraction as proportion of enhanc-
ing tumour tissue on a pre-treatment CT scan, was found predictive for outcome after
first line chemotherapy [13]. In lung cancer, CT derived information has been limited to
pre-treatment assessment of tumour volume and as response evaluation defined as
tumour size reduction [14]. For PET imaging, the maximum and median FDG uptake has
often been investigated, indicating strong prognostic power [6, 15]. However, more
complex descriptions of FDG uptake are only investigated on a limited scale. There was
a study of El Naqa et al. [16], investigating the predictive power of intensity–volume
histogram (IVH) metrics, shape and texture features to assess response to treatment of
a limited set of patients with head and neck and cervix cancers. Tixier et al. also ex-
plored the potential of SUV based, shape and texture features extracted from baseline
FDG-PET, images, to assess response to therapy and prognosis in order to predict re-
sponse to combined chemo-radiation treatment in oesophageal cancer [17]. Also, tex-
tural features in FDG PET images exhibited small variations due to different acquisition
modes and reconstruction parameters [18]. These examples open the question of
whether quantitative extraction of additional imaging features on conventional imaging
improves the ability of currently used parameters to predict or monitor response to
treatment.
Furthermore, Radiomics can be linked with the concept of radio-genomics, which
assumes that imaging features are related to gene signatures. An interesting finding in
recent literature is that tumours with more genomic heterogeneity are more likely to
develop a resistance to treatment and to metastasise [19]. This links to the concept that
more heterogeneous tumours have a worse prognosis. According to the Radiomics
hypothesis, the genomic heterogeneity could translate to an expression in an intra-
tumoural heterogeneity that could be assessed through imaging and that would ulti-
mately exhibit worse prognosis. This hypothesis has been sustained by Jackson et al.
[15] and as well as by Diehn et al. [20] who quite convincingly showed that proliferation
and hypoxia gene expression patterns can be predicted by mass effect and tumour
contrast enhancement, respectively. They also showed that a specific imaging pattern
could predict overexpression of epidermal growth factor receptor (EGFR), a known
therapeutic target. Moreover, in their analysis the presence of certain image features
was highly predictive of outcome. The authors concluded that imaging in this case MR
provided an ‘in vivo portrait’ of genome-wide gene expression in glioblastoma multi-
form. Similar findings have been found in hepatocellular carcinomas by Segal et al. [21],
showing that the combination of only 28 imaging traits was sufficient to reconstruct the
variation of 116 gene expression modules.
These types of studies will need to be extended, by including more patients with
external validation datasets, more tumour types that exhibit phenotypes such as inva-
siveness. This will be the focus of the QuIC-ConCePT consortium, to confirm experimen-](https://image.slidesharecdn.com/0e20c58a-e59d-4f72-b721-87c0da20639d-160804091812/85/E-book-Thesis-Sara-Carvalho-36-320.jpg)
![CHAPTER 3
38
REFERENCES
[1] Lambin P, Petit SF, Aerts HJ, van Elmpt WJ, Oberije CJ, Starmans MH, et al. The ESTRO Breur Lecture
2009. From population to voxel-based radiotherapy: exploiting intra-tumour and intra-organ
heterogeneity for advanced treatment of non-small cell lung cancer. Radiotherapy and oncology : journal
of the European Society for Therapeutic Radiology and Oncology. 2010 Aug;96(2):145-152.
[2] Fass L. Imaging and cancer: a review. Molecular oncology. 2008 Aug;2(2):115-152.
[3] Eisenhauer EA, Therasse P, Bogaerts J, Schwartz LH, Sargent D, Ford R, et al. New response evaluation
criteria in solid tumours: revised RECIST guideline (version 1.1). European journal of cancer (Oxford,
England : 1990). 2009 Jan;45(2):228-247.
[4] van Baardwijk A, Dooms C, van Suylen RJ, Verbeken E, Hochstenbag M, Dehing-Oberije C, et al. The
maximum uptake of (18)F-deoxyglucose on positron emission tomography scan correlates with survival,
hypoxia inducible factor-1alpha and GLUT-1 in non-small cell lung cancer. European journal of cancer
(Oxford, England : 1990). 2007 Jun;43(9):1392-1398.
[5] Berghmans T, Dusart M, Paesmans M, Hossein-Foucher C, Buvat I, Castaigne C, et al. Primary tumour
standardized uptake value (SUVmax) measured on fluorodeoxyglucose positron emission tomography
(FDG-PET) is of prognostic value for survival in non-small cell lung cancer (NSCLC): a systematic review
and meta-analysis (MA) by the European Lung Cancer Working Party for the IASLC Lung Cancer Staging
Project. Journal of thoracic oncology : official publication of the International Association for the Study of
Lung Cancer. 2008 Jan;3(1):6-12.
[6] Paesmans M, Berghmans T, Dusart M, Garcia C, Hossein-Foucher C, Lafitte JJ, et al. Primary tumour
standardized uptake value measured on fluorodeoxyglucose positron emission tomography is of
prognostic value for survival in non-small cell lung cancer: update of a systematic review and meta-
analysis by the European Lung Cancer Working Party for the International Association for the Study of
Lung Cancer Staging Project. Journal of thoracic oncology : official publication of the International
Association for the Study of Lung Cancer. 2010 May;5(5):612-619.
[7] Aerts HJ, Dubois L, Perk L, Vermaelen P, van Dongen GA, Wouters BG, et al. Disparity between in vivo
EGFR expression and 89Zr-labeled cetuximab uptake assessed with PET. Journal of nuclear medicine :
official publication, Society of Nuclear Medicine. 2009 Jan;50(1):123-131.
[8] Li H, Giger ML, Yuan Y, Chen W, Horsch K, Lan L, et al. Evaluation of computer-aided diagnosis on a large
clinical full-field digital mammographic dataset. Academic radiology. 2008 Nov;15(11):1437-1445.
[9] Van Meter T, Dumur C, Hafez N, Garrett C, Fillmore H, Broaddus WC. Microarray analysis of MRI-defined
tissue samples in glioblastoma reveals differences in regional expression of therapeutic targets. Diagnostic
molecular pathology : the American journal of surgical pathology, part B. 2006 Dec;15(4):195-205.
[10] Hobbs SK, Shi G, Homer R, Harsh G, Atlas SW, Bednarski MD. Magnetic resonance image-guided
proteomics of human glioblastoma multiforme. Journal of magnetic resonance imaging : JMRI. 2003
Nov;18(5):530-536.
[11] Kuo MD, Gollub J, Sirlin CB, Ooi C, Chen X. Radiogenomic analysis to identify imaging phenotypes
associated with drug response gene expression programs in hepatocellular carcinoma. Journal of
vascular and interventional radiology : JVIR. 2007 Jul;18(7):821-831.
[12] Rutman AM, Kuo MD. Radiogenomics: creating a link between molecular diagnostics and diagnostic
imaging. European journal of radiology. 2009 May;70(2):232-241.
[13] O'Connor JP, Jayson GC, Jackson A, Ghiorghiu D, Carrington BM, Rose CJ, et al. Enhancing fraction
predicts clinical outcome following first-line chemotherapy in patients with epithelial ovarian carcinoma.
Clinical cancer research : an official journal of the American Association for Cancer Research. 2007 Oct
15;13(20):6130-6135.
[14] Dehing-Oberije C, Aerts H, Yu S, De Ruysscher D, Menheere P, Hilvo M, et al. Development and validation
of a prognostic model using blood biomarker information for prediction of survival of non-small-cell lung
cancer patients treated with combined chemotherapy and radiation or radiotherapy alone](https://image.slidesharecdn.com/0e20c58a-e59d-4f72-b721-87c0da20639d-160804091812/85/E-book-Thesis-Sara-Carvalho-38-320.jpg)
![RADIOMICS: EXTRACTING MORE INFORMATION FROM MEDICAL IMAGES
39
(NCT00181519, NCT00573040, and NCT00572325). International journal of radiation oncology, biology,
physics. 2011 Oct 1;81(2):360-368.
[15] Jackson A, O'Connor JP, Parker GJ, Jayson GC. Imaging tumour vascular heterogeneity and angiogenesis
using dynamic contrast-enhanced magnetic resonance imaging. Clinical cancer research : an official
journal of the American Association for Cancer Research. 2007 Jun 15;13(12):3449-3459.
[16] El Naqa I, Grigsby P, Apte A, Kidd E, Donnelly E, Khullar D, et al. Exploring feature-based approaches in
PET images for predicting cancer treatment outcomes. Pattern recognition. 2009 Jun 1;42(6):1162-1171.
[17] Tixier F, Le Rest CC, Hatt M, Albarghach N, Pradier O, Metges JP, et al. Intratumour heterogeneity
characterized by textural features on baseline 18F-FDG PET images predicts response to concomitant
radiochemotherapy in esophageal cancer. Journal of nuclear medicine : official publication, Society of
Nuclear Medicine. 2011 Mar;52(3):369-378.
[18] Galavis PE, Hollensen C, Jallow N, Paliwal B, Jeraj R. Variability of textural features in FDG PET images due
to different acquisition modes and reconstruction parameters. Acta oncologica (Stockholm, Sweden).
2010 Oct;49(7):1012-1016.
[19] Campbell PJ, Yachida S, Mudie LJ, Stephens PJ, Pleasance ED, Stebbings LA, et al. The patterns and dynamics
of genomic instability in metastatic pancreatic cancer. Nature. 2010 Oct 28;467(7319):1109-1113.
[20] Diehn M, Nardini C, Wang DS, McGovern S, Jayaraman M, Liang Y, et al. Identification of noninvasive
imaging surrogates for brain tumour gene-expression modules. Proceedings of the National Academy of
Sciences of the United States of America. 2008 Apr 1;105(13):5213-5218.
[21] Segal E, Sirlin CB, Ooi C, Adler AS, Gollub J, Chen X, et al. Decoding global gene expression programs in
liver cancer by noninvasive imaging. Nature biotechnology. 2007 Jun;25(6):675-680.](https://image.slidesharecdn.com/0e20c58a-e59d-4f72-b721-87c0da20639d-160804091812/85/E-book-Thesis-Sara-Carvalho-39-320.jpg)

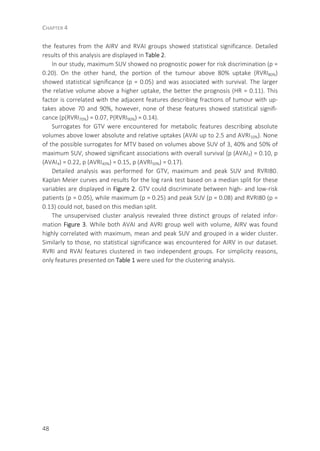
![CHAPTER 4
42
ABSTRACT
introduction
Maximum, mean and peak SUV of primary tumour at baseline FDG-PET scans, have often
been found predictive for overall survival in non-small cell lung cancer (NSCLC) patients.
In this study we further investigated the prognostic power of advanced metabolic met-
rics derived from intensity volume histograms (IVH) extracted from PET imaging.
Methods
A cohort of 220 NSCLC patients (mean age, 66.6 years; 149 men, 71 women), stages I –
IIIB, treated with radiotherapy with curative intent were included (NCT00522639). Each
patient underwent standardized pre-treatment CT-PET imaging. Primary GTV was delin-
eated by an experienced radiation oncologist on CT-PET images. Common PET de-
scriptors such as maximum, mean and peak SUV, and metabolic tumour volume (MTV)
were quantified. Advanced descriptors of metabolic activity were quantified by IVH.
These comprised five groups of features: absolute and relative volume above relative
intensity threshold (AVRI and RVRI), absolute and relative volume above absolute inten-
sity threshold (AVAI and RVAI), and absolute intensity above relative volume threshold
(AIRV). MTV was derived from the IVH curves for volumes with SUV above 2.5, 3 and 4,
and of 40% and 50% maximum SUV. Univariable analysis using Cox Proportional Hazard
Regression was performed for overall survival (OS) assessment.
Results
Relative volume above higher SUV (80%) was an independent predictor of OS (p=0.05).
None of the possible surrogates for MTV based on volumes above SUV of 3, 40% and
50% of maximum SUV showed significant associations with OS [p(AVAI3)=0.10,
p(AVAI4)=0.22, p(AVRI40%)=0.15, p(AVRI50%)=0.17]. Maximum and peak SUV (r=0.99)
revealed no prognostic value for OS [p(maximum SUV)=0.20, p(peak SUV)=0.22].
Conclusions
New methods using more advanced imaging features extracted from PET were ana-
lysed. Best prognostic value for OS of NSCLC patients was found for relative portions of
the tumour above higher uptakes (80% SUV).](https://image.slidesharecdn.com/0e20c58a-e59d-4f72-b721-87c0da20639d-160804091812/85/E-book-Thesis-Sara-Carvalho-42-320.jpg)
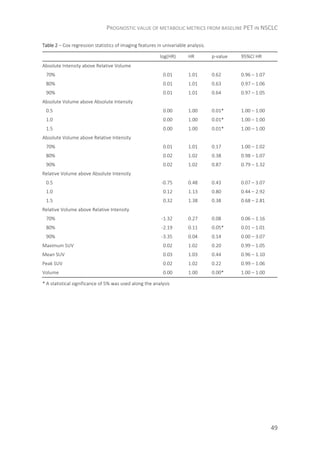
![PROGNOSTIC VALUE OF METABOLIC METRICS FROM BASELINE PET IN NSCLC
43
INTRODUCTION
Lung cancer is the most common cancer type worldwide, accounting for more than 1.1
million deaths annually. Out of the total number of cases, 85% are of the non-small cell
lung cancer (NSCLC) type. The 5-year survival for stages I-II and III is disappointingly low
at respectively 50% and 20%, mainly due to a high rate of loco-regional and distant
progression [1].
Nowadays, much research largely focuses on prediction of treatment outcome
based on patient and tumour characteristics prior to treatment. This would allow indi-
vidualizing treatment and enhancing therapeutic approaches [2]. Here, imaging can play
a crucial role as it allows for a non-invasive identification of the tumour [3]. Indeed,
functional information gathered by Positron Emission Tomography (PET) has already
been shown to be an effective tool in detecting early tumour alterations before any
anatomical change is noticeable and detectable [4]. However, the possibility to predict
response to treatment or overall survival based solely on pre-treatment scans is still
under investigation and so far only a few metrics based on PET imaging have been ex-
plored to this end.
Currently, 18
F-fluoro-2-Deoxy-D-glucose (FDG) is the most commonly used PET trac-
er in oncology. The investigation of prediction of tumour response based on PET fea-
tures is mainly limited to simple measurements of Standard Uptake Value (SUV) such as
maximum, mean and peak (defined within the neighbourhood of maximum SUV) [5].
There is still limited confirmation whether these different SUV descriptors in pre-
treatment scans are predictive [6].
Previous research also describes Metabolic Tumour Volume (MTV) and the Total
Lesion Glycolysis (TLG) calculated for tumour volumes derived from semi-automatic
segmentation methods based on PET imaging. MTV is defined for absolute SUV thresh-
olds of lower value or relative uptakes in regard to the maximum SUV [7]. TLG is then
expressed as the product of MTV by its mean SUV [7-9].
We investigated the prognostic value of metrics based on the metabolic information
of PET imaging. These metrics are based on Intensity Volume Histograms (IVH), which
summarize in a single curve the relation of tumour volume and SUV intensity. We hy-
pothesized that the metabolic information described by these IVH curves could be used
to predict treatment outcome of NSCLC patients.
The aim of this study was to assess the prognostic value of these IVH metrics for
NSCLC patients treated with (chemo)radiotherapy and compare the results against the
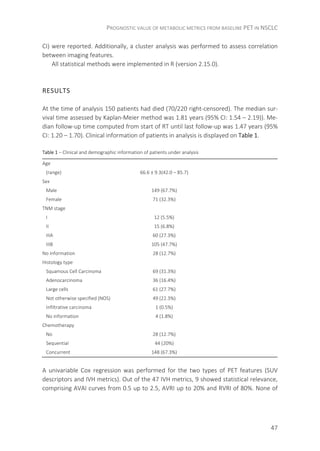
performance of the commonly used metrics based on SUV descriptors.](https://image.slidesharecdn.com/0e20c58a-e59d-4f72-b721-87c0da20639d-160804091812/85/E-book-Thesis-Sara-Carvalho-43-320.jpg)
![CHAPTER 4
44
Figure 1 – Transverse view of CT-PET scan of NSCLC patients. Examples of Intensity-Volume Histograms for the
two patients are shown on the right. Maximum SUV for patients A and B (top and bottom left) are, respective-
ly, 10.1 and 6.3, with corresponding volumes of 70 and 180 cm
3
(derived from AVAI curves). From the RVRI
curves, it can be inferred that the minimum SUV is around 8% (0.80) and 20% (1.25) of the maximum uptake.
AVAI curves confirm that all the tumour volume is above these minimum uptake values for the corresponding
patient.
MATERIALS AND METHODS
Demographic and clinical data
A total of 220 NSCLC (stage I-IIIB) patients referred to our institute between February
2005 and April 2011 were included. The study was approved by the appropriate Institu-
tional Review Board and registered at clinicaltrials.gov (NCT00522639). Patients were
treated with high dose radiotherapy (RT), had no surgery and no previous cancer within
five years prior to diagnosis. Clinical follow-up was performed according to national
guidelines.
Radiotherapy
All patients were treated at our institute with CT-based RT [10]. The XiO/Focal system
(Computerized Medical Systems, St. Louis, MO, USA), based on a convolution-super-](https://image.slidesharecdn.com/0e20c58a-e59d-4f72-b721-87c0da20639d-160804091812/85/E-book-Thesis-Sara-Carvalho-44-320.jpg)
![PROGNOSTIC VALUE OF METABOLIC METRICS FROM BASELINE PET IN NSCLC
45
position algorithm with inhomogeneity corrections and according to ICRU 50 guidelines
[11] was used for the RT planning.
Patients were treated according to three different regimens:
a. 44 patients were treated with the standard protocol for sequential chemo-radiation,
as defined in August 2005 [12]. An individualized radiation dose escalation protocol
(range 45 – 79.2 Gy) was delivered in two daily fractions of 1.8 Gy. Dose escalation
was limited by the mean lung dose or the spinal cord dose constraint. Between frac-
tions, an eight hours interval was respected.
b. 148 patients received concurrent chemo-radiation. Following 2 cycles of car-
boplatin-gemcitabine, a radiation dose of 45 Gy, in fractions of 1.5 Gy delivered
twice a day for the first course, directly followed by an individualized dose ranging
from 6 – 24 Gy and delivered in 2.0 Gy fractions once a day.
c. 28 patients received no chemotherapy treatment. The RT applied was analogous to
the sequential protocol (range 54 – 79.2 Gy).
Imaging data acquisition
All patients underwent a CT-PET scan before RT for treatment planning purposes (medi-
an: 7 days; range: 2 – 48). Patients fasted for at least 6h before scanning. Up to De-
cember 2010, a total dose of (bodyweight x 4 + 20) MBq of FDG was injected intrave-
nously. After January 2011, the NEDPAS protocol was used and the administered dose
was (2.5 x bodyweight) [13]. CT-PET images were acquired 60 minutes post injection.
Data acquired up to December 2006 were gathered on Siemens Biograph 16 CT-PET
scanner. After January 2007 data were acquired on a Siemens Truepoint 40 CT-PET
(Siemens AG, Munich, Germany). An Ordered Subset Expectation Maximization 2D 4
iterations 8 subsets (OSEM2D 4i8s) algorithm was used for PET image reconstruction.
All PET scans were corrected for attenuation using the mid-ventilation phase of the
4DCT or a 3DCT thorax in case the 4DCT was not of sufficient image quality due to ir-
regular breathing of the patient. Model-based methods were applied for scatter correc-
tion. All exams were corrected for random events and decay.
Tumour segmentation
CT-PET images were imported into research treatment planning system Xio/Focal using
the DICOM protocol. The primary Gross Tumour Volume (GTV) was delineated by expe-
rienced radiation oncologists on the fused CT-PET images and used as the region of
interest (ROI) for further analysis.](https://image.slidesharecdn.com/0e20c58a-e59d-4f72-b721-87c0da20639d-160804091812/85/E-book-Thesis-Sara-Carvalho-45-320.jpg)
![CHAPTER 4
46
Image processing and feature extraction
SUV descriptors (maximum, mean and peak SUV), GTV and a set of metabolic features
were extracted from the PET images and analysed. Although it is commonly regarded as
a clinical feature, we computed GTV as an imaging feature and compared it against the
ones in the same category and possible surrogates. Peak SUV was computed by means
of a 3D kernel, representing a 1 cm3
sphere made on the same grid as the scan and
centred on the maximum SUV voxel, as defined on the guidelines of PET Response Cri-
teria in Solid Tumours (PERCIST), version 1.0 [14]. The uptake within this kernel was
then averaged.
Metabolic features were based on the Intensity-Volume Histogram, which are anal-
ogous to the Dose-Volume histograms [15] and summarize in a curve the relation of
tumour volume and SUV intensity. Five different curves can be defined: Absolute and
Relative Volume above Relative Intensity threshold (AVRI and RVRI), Absolute and Rela-
tive Volume above Absolute Intensity threshold (AVAI and RVAI), and Absolute Intensity
above Relative Volume threshold (AIRV). AVAI and RVAI are built in steps of 0.5 (SUV) up
to the maximum uptake. Curves regarding relative quantities are built in steps of 10%.
Graphical representations of these types of curves for two patients are displayed in
Figure 1. A total of 47 features were retrieved for the metabolic features: 9 for each set
of curves based on relative thresholds (AVRI, RVRI and AIRV) and 10 for absolute
thresholds (AVAI and RVAI), corresponding to a maximum absolute threshold of 5. This
threshold was chosen so as 85% of patients under analysis would have a valid feature.
Image analysis was performed in Matlab R2012b (The Mathworks, Natick, MA) using
an adapted version of CERR (the Computational Environment for Radiotherapy Re-
search) [16]. PET images were normalized to SUV before analysis. In-house developed
image analysis software was used for feature extraction.
Survival endpoint
The primary endpoint was overall survival (OS), calculated from the start of RT until date
of death or last follow-up. “Gemeentelijke Basis Administratie” (GBA), a decentralized
population registration system of the Netherlands, was verified to assess survival status.
A patient still alive at the end of the study was considered right-censored.
Statistical analysis
Imaging features based on PET scans were analysed using univariable Cox Proportional
Hazard Regression. The assumption of proportional hazards was assessed by the Scaled
Schoenfeld residuals. Time-dependent variables were constructed by adding interac-
tions with log(time). A statistical significance at the 5% level was used. Estimated log
hazard rations (log(HR)), hazard ratios (HR), p-value and 95% confidence intervals (95%](https://image.slidesharecdn.com/0e20c58a-e59d-4f72-b721-87c0da20639d-160804091812/85/E-book-Thesis-Sara-Carvalho-46-320.jpg)
![PROGNOSTIC VALUE OF METABOLIC METRICS FROM BASELINE PET IN NSCLC
51
DISCUSSION
Until now PET has mainly been used for staging purposes. This results of its sensitivity to
detect distant and loco-regional lymph node metastasis. Some authors also reported
the localization of areas with higher RT resistance based on pre-treatment PET [17].
Studies reported positive findings correlated with overall survival for pre-treatment PET
scans [18], but relied mainly on simplistic metrics [19]. Also, metrics derived for tumour
volume segmented by semi-automatic methods based on PET imaging, as MTV and TLG
have been explored recently [6-9]. In our study a set of PET features was derived, de-
scribed by the metabolic information based on the relation of FDG uptake and volume,
and reported by IVH curves. Preliminary results revealed that these variables derived
from PET imaging provided an added value for survival prediction of NSCLC patients
treated with high dose RT.
There is reported evidence for the prognostic power of maximum SUV in early stage
(I and II) NSCLC. However, there is insufficient evidence to draw the same conclusion for
higher stage NSCLC patients [20-22]. In our cohort of patients, maximum SUV presented
no statistical significant predictor of survival. This might be due to the large proportion
of stage III patients in our cohort (75%). An analysis performed for only stage III patients
showed concordant results (p = 0.19). In fact, the analysis using only stage III patients
showed no statistical power in the univariate analysis for any of the imaging features,
except for volume (p = 0.02).
The tumour response using peak SUV is highly sensitive to the definition of its corre-
sponding region of interest [23]. The non-prognostic power of peak SUV (p = 0.22) can
be inferred from the fact that for such a small region of interest (1cm3 around the max-
imum SUV), there is an overall high correlation with maximum SUV (r = 0.99).
Previous studies have described automatic delineation methods based on PET using
either a fixed SUV or relative threshold. Cut-offs of, for example, 2.5, 3 and 4, and rela-
tive thresholds of 40% and 50% of the maximum SUV were already considered for the
MTV definition [7]. Assuming the maximum uptake voxel is enclosed in the delineated
GTV, AVAI2.5, AVAI3, and AVAI4, AVRI40% and AVRI50% were considered to be a good ap-
proximation of MTV. However, to compute TLG automatic segmentation must be per-
formed as the mean SUV of MTV cannot be retrieved from the IVH curves.
To our knowledge, this is the first study reporting on portions of tumour volume
above a relative uptake, as described by the RVRI and RVAI curves. These metrics en-
sure different volumes to be more comparable in terms of partial distribution of activi-
ty. Researchers have already reported the use of IVH metrics, but they did not include
the relative features [24, 25] and their studies were based on smaller datasets and in-
vestigated other cancer sites. Two datasets of cervix and head and neck cancer treated
with chemotherapy, were analysed using this approach by el Naqa [24]. Similarly, van
Velden [25] analysed three lung cancer patients with dissimilar characteristics (hetero-](https://image.slidesharecdn.com/0e20c58a-e59d-4f72-b721-87c0da20639d-160804091812/85/E-book-Thesis-Sara-Carvalho-51-320.jpg)
![PROGNOSTIC VALUE OF METABOLIC METRICS FROM BASELINE PET IN NSCLC
53
REFERENCES
{1] Travis WD, Brambilla E, Müller-Hermelink HK, Harris CC. World Health Organization Classification of
Tumours: Pathology and Genetics of Tumours of the Lung, Pleura, Thymus and Heart. ed. Lyon, France:
IARC Press, International Agency for Research on Cancer; 2004.
[2] Lambin P, van Stiphout RG, Starmans MH, Rios-Velazquez E, Nalbantov G, Aerts HJ, Roelofs E, van Elmpt
W, Boutros PC, Granone P, Valentini V, Begg AC, De Ruysscher D, Dekker A. Predicting outcomes in radia-
tion oncology--multifactorial decision support systems. Nat Rev Clin Oncol 2013;10: 27-40.
[3] Lambin P, Rios-Velazquez E, Leijenaar R, Carvalho S, van Stiphout RG, Granton P, Zegers CM, Gillies R,
Boellard R, Dekker A, Aerts HJ. Radiomics: extracting more information from medical images using ad-
vanced feature analysis. Eur J Cancer 2012;48: 441-446.
[4] Salminen E, Mac Manus M. Impact of FDG-labelled positron emission tomography imaging on the man-
agement of non-small-cell lung cancer. Ann Med 2001;33: 404-409.
[5] Fuss M. Strategies of assessing and quantifying radiation treatment metabolic tumour response using
F18 FDG Positron Emission Tomography (PET). Acta Oncol 2010;49: 948-955.
[6] Cook GJ, Yip C, Siddique M, Goh V, Chicklore S, Roy A, Marsden P, Ahmad S, Landau D. Are Pretreatment
18F-FDG PET Tumour Textural Features in Non-Small Cell Lung Cancer Associated with Response and
Survival After Chemoradiotherapy? J Nucl Med 2013;54: 19-26.
[7] Van de Wiele C, Kruse V, Smeets P, Sathekge M, Maes A. Predictive and prognostic value of metabolic
tumour volume and total lesion glycolysis in solid tumours. Eur J Nucl Med Mol Imaging 2013;40: 290-
301.
[8] Hyun SH, Choi JY, Kim K, Kim J, Shim YM, Um SW, Kim H, Lee KH, Kim BT. Volume-Based Parameters of
18F-Fluorodeoxyglucose Positron Emission Tomography/Computed Tomography Improve Outcome Pre-
diction in Early-Stage Non-Small Cell Lung Cancer After Surgical Resection. Ann Surg 2013;257: 364-370.
[9] Soussan M, Chouahnia K, Maisonobe JA, Boubaya M, Eder V, Morere JF, Buvat I. Prognostic implications
of volume-based measurements on FDG PET/CT in stage III non-small-cell lung cancer after induction
chemotherapy. Eur J Nucl Med Mol Imaging 2013.
[10] Prescribing, Recording, and Reporting Photon Beam Therapy (Report 50). In: International Commission
on Radiation Units and Measurements, 1993.
[11] ICRU Report 50: Prescribing, Recording, and Reporting Photon Beam Therapy. In. Bethesda, MD: Interna-
tional Commission on Radiation Units and Measurements, 1993.
[12] Oncology MR. Radiotherapy for NSCLC to a Individualized MLD (BRONC MLD). In, 2010.
[13] Boellaard R, Oyen WJ, Hoekstra CJ, Hoekstra OS, Visser EP, Willemsen AT, Arends B, Verzijlbergen FJ,
Zijlstra J, Paans AM, Comans EF, Pruim J. The Netherlands protocol for standardisation and quantification
of FDG whole body PET studies in multi-centre trials. Eur J Nucl Med Mol Imaging 2008;35: 2320-2333.
[14] Wahl RL, Jacene H, Kasamon Y, Lodge MA. From RECIST to PERCIST: Evolving Considerations for PET
response criteria in solid tumours. J Nucl Med 2009;50 Suppl 1: 122S-150S.
[15] Drzymala RE, Mohan R, Brewster L, Chu J, Goitein M, Harms W, Urie M. Dose-volume histograms. Int J
Radiat Oncol Biol Phys 1991;21: 71-78.
[16] Deasy JO, Blanco AI, Clark VH. CERR: a computational environment for radiotherapy research. Medical
Physics 2003;30: 979-985.
[17] Aerts HJ, van Baardwijk AA, Petit SF, Offermann C, Loon J, Houben R, Dingemans AM, Wanders R, Bo-
ersma L, Borger J, Bootsma G, Geraedts W, Pitz C, Simons J, Wouters BG, Oellers M, Lambin P, Bosmans
G, Dekker AL, De Ruysscher D. Identification of residual metabolic-active areas within individual NSCLC
tumours using a pre-radiotherapy (18)Fluorodeoxyglucose-PET-CT scan. Radiother Oncol 2009;91: 386-
392.
[18] Kauppi JT, Oksala N, Salo JA, Helin H, Karhumaki L, Kemppainen J, Sihvo EI, Rasanen JV. Locally advanced
esophageal adenocarcinoma: response to neoadjuvant chemotherapy and survival predicted by
([18F])FDG-PET/CT. Acta Oncol 2012;51: 636-644.](https://image.slidesharecdn.com/0e20c58a-e59d-4f72-b721-87c0da20639d-160804091812/85/E-book-Thesis-Sara-Carvalho-53-320.jpg)
![CHAPTER 4
54
[19] Velazquez ER, Aerts HJ, Oberije C, De Ruysscher D, Lambin P. Prediction of residual metabolic activity
after treatment in NSCLC patients. Acta Oncol 2010;49: 1033-1039.
[20] Abelson JA, Murphy JD, Trakul N, Bazan JG, Maxim PG, Graves EE, Quon A, Le QT, Diehn M, Loo BW, Jr.
Metabolic imaging metrics correlate with survival in early stage lung cancer treated with stereotactic ab-
lative radiotherapy. Lung Cancer 2012;78: 219-224.
[21] Agarwal M, Brahmanday G, Bajaj SK, Ravikrishnan KP, Wong CY. Revisiting the prognostic value of pre-
operative (18)F-fluoro-2-deoxyglucose ( (18)F-FDG) positron emission tomography (PET) in early-stage (I
& II) non-small cell lung cancers (NSCLC). Eur J Nucl Med Mol Imaging 2010;37: 691-698.
[22] Hoang JK, Hoagland LF, Coleman RE, Coan AD, Herndon JE, 2nd, Patz EF, Jr. Prognostic value of fluorine-
18 fluorodeoxyglucose positron emission tomography imaging in patients with advanced-stage non-
small-cell lung carcinoma. J Clin Oncol 2008;26: 1459-1464.
[23] Vanderhoek M, Perlman SB, Jeraj R. Impact of the definition of peak standardized uptake value on quan-
tification of treatment response. J Nucl Med 2012;53: 4-11.
[24] El Naqa I, Grigsby P, Apte A, Kidd E, Donnelly E, Khullar D, Chaudhari S, Yang D, Schmitt M, Laforest R,
Thorstad W, Deasy JO. Exploring feature-based approaches in PET images for predicting cancer treat-
ment outcomes. Pattern Recognit 2009;42: 1162-1171.
[25] van Velden FH, Cheebsumon P, Yaqub M, Smit EF, Hoekstra OS, Lammertsma AA, Boellaard R. Evaluation
of a cumulative SUV-volume histogram method for parameterizing heterogeneous intratumoural FDG
uptake in non-small cell lung cancer PET studies. Eur J Nucl Med Mol Imaging 2011;38: 1636-1647.](https://image.slidesharecdn.com/0e20c58a-e59d-4f72-b721-87c0da20639d-160804091812/85/E-book-Thesis-Sara-Carvalho-54-320.jpg)
![STABILITY OF FDG-PET RADIOMICS FEATURES
57
INTRODUCTION
Positron emission tomography (PET) has been shown to be a valuable tool for the de-
tection and staging of lung cancer [1]. In recent years also PET imaging has also been
increasingly used for treatment planning [2] and response monitoring in radiotherapy
[3]. The most widely used tracer in oncological PET imaging is the glucose analog 18
F-
Fluoro-2-Deoxy-D-glucose (FDG), commonly quantified by the standardized uptake
value (SUV) [4]. Previous research provides evidence of basic and easily derived pre-
treatment PET measurements, such as the maximum (SUVmax) or mean SUV (SU-
Vmean), being predictors for treatment outcome in NSCLC [5-7]. Besides these basic
measurements, more advanced quantitative imaging features are increasingly investi-
gated for treatment monitoring and outcome prediction in lung and other cancer sites
[8-10], or as potential imaging biomarkers [11].
The use of basic and more advanced descriptors derived from PET imaging is within
the scope of “Radiomics” [12-14]: a high throughput approach to extract and mine a
large number of quantitative features from medical images, where it is hypothesized
that it will improve tumour characterization and treatment outcome prediction. How-
ever, with the prospect of using these Radiomics features for future prognostic and
predictive models, knowledge about their reliability and variability is needed. A few
recent studies have investigated these aspects of FDG-PET derived parameters in differ-
ent cancer sites, including the test-retest stability of basic SUV measurements [15], test-
retest stability of a number of basic and textural features [16], or the variability of tex-
tural features due to image acquisition and reconstruction parameters [17]. However,
to our knowledge no previous study has performed an integrated stability analysis of a
large number of PET features in NSCLC, based on both a test-retest and an inter-
observer setup. Therefore, the aim our study is to independently examine the feature’s
test-retest reliability and inter-observer stability between multiple manual tumour de-
lineations. Moreover, we aim to combine the information obtained from both analyses
to assess if imaging features that are more stable in repeated PET imaging are also more
robust against inter-observer variability. Based on literature research, we strived to
include a broad collection of PET based imaging features used in the context of predic-
tive and/or prognostic modelling in cancer, to provide a comprehensive overview.
MATERIALS AND METHODS
This study includes two separate patient cohorts in order to assess both the test-retest
and inter-observer variability of a large number of quantitative imaging features. All
patients signed an informed consent form in accordance with approval by the institu-
tional review board. A schematic representation of the workflow applied in our study is
depicted in Figure 1.](https://image.slidesharecdn.com/0e20c58a-e59d-4f72-b721-87c0da20639d-160804091812/85/E-book-Thesis-Sara-Carvalho-57-320.jpg)
![CHAPTER 5
58
Test-retest cohort
Eleven patients with histology- or cytology-diagnosed non–small cell lung cancer
(NSCLC) were included in this patient cohort, as described in [18]. Patients underwent
two baseline 18
F-FDG-PET scans within a one-day interval, before any treatment was
delivered. PET images were acquired on an ECAT EXACT HR1 scanner (Siemens/CTI) and
iteratively reconstructed using normalization- and attenuation-weighted ordered-
subset expectation maximization with two iterations and sixteen subsets (OSEM 2i16s).
All images had an in-plane resolution of 5.15×5.15 mm/pixel and a slice thickness of
2.43 mm. Further patient and imaging details are described by Frings et al [18]. Lesions
with adequate uptake were first identified and subsequently delineated by applying a
threshold of 50% of the maximum uptake value within the tumour [19], using a semiau-
tomatic delineation tool [18] (Figure 2).
Inter-observer cohort
Twenty-three patients with histologically proven NSCLC were included in this patient
cohort, as described previously in [20]. Patients underwent a diagnostic whole body
PET-CT scan acquired on a SOMATOM Sensation 16 with an ECAT ACCEL PET scanner
(Siemens, Erlangen, Germany). PET images were iteratively reconstructed using normal-
ization- and attenuation-weighted OSEM 4i8s. Images had an in-plane resolution of
5.31×5.31 mm/pixel and a 5 mm slice thickness. Primary tumours and involved lymph
nodes were identified and manually delineated based on fused PET-CT images, using a
standardized clinical delineation protocol. Delineation of the lesions was performed
independently by five observers and all observers were blinded to the contours deline-
ated by the others (Figure 2.C-D). Manual delineations were performed on XiO/Focal
(Computer Medical System, Inc., St. Louis, MO). For further details on the patient co-
hort, imaging and delineation, we refer to the publication of van Baardwijk et al [20].
Image processing and feature extraction
All image analysis was performed in Matlab R2012b (The Mathworks, Natick, MA) using
an adapted version of CERR (the Computational Environment for Radiotherapy Re-
search) [21] extended with in-house developed Radiomics image analysis software to
extract imaging features. PET images and delineated VOIs were first imported into
CERR, where the image intensities were normalized to SUV [4]. First order statistics
consisted of basic SUV measurements and features describing histogram of voxel inten-
sity values contained within the VOI.](https://image.slidesharecdn.com/0e20c58a-e59d-4f72-b721-87c0da20639d-160804091812/85/E-book-Thesis-Sara-Carvalho-58-320.jpg)
![STABILITY OF FDG-PET RADIOMICS FEATURES
59
Figure 1 – Schematic of the workflow applied in our study: (A) Acquisition of PET images (fused CT for illustra-
tive purposes), followed by tumour delineation; (B) Extraction of Radiomics features from the defined volume
of interest; (C) Test-retest and inter-observer stability analysis.
Figure 2 – (A and B) Representative images of repeated imaging of a patient from the test-retest cohort, with
the 50% SUVmax tumour delineation shown outlined in green, for respectively the first and second baseline
PET scan. (C) Representative image of a patient from the inter-observer cohort, where the lesion area is
outlined with the green square (fused CT for illustrative purposes); (D) Enlargement of the lesion area with in
different colours the five independent tumour delineations by multiple observers.
A set of metrics was derived from intensity volume histogram (IVH) representations
[10], which summarize the complex three dimensional data contained in the image into
a single curve, allowing for a simplified interpretation. Three IVH definitions were con-
sidered: the relative volume as a function of the relative intensity (RVRIx), the absolute](https://image.slidesharecdn.com/0e20c58a-e59d-4f72-b721-87c0da20639d-160804091812/85/E-book-Thesis-Sara-Carvalho-59-320.jpg)
![CHAPTER 5
60
volume as a function of the relative intensity (AVRIx) and the intensity threshold as a
function of the relative volume having a maximum intensity lower than the threshold
(AIRVx). Relative steps in volume and intensity (x) were taken in 10% increments, from
10%-90%. Furthermore, three differential IVH metrics were considered: RVRIx-
RVRI(100-x), AVRIx-AVRI(100-x), and AIRVx-AIRV(100-x).
Geometric features were calculated, describing the three-dimensional shape and
size of the lesions. Textural features describing patterns or spatial distribution of voxel
intensities, were calculated from respectively grey level co-occurrence (GLCM) [22],
grey level run-length (GLRLM) [23] and grey level size-zone texture matrices (GLSZM)
[9]. Determining texture matrix representations requires the voxel intensity values with-
in the VOI to be discretized. Voxel intensities were therefore resampled into equally
spaced bins using a bin-width of 0.5 units SUV. This discretization step not only reduces
image noise, but also normalizes intensities across all patients, allowing for a direct
comparison of all calculated textural features between patients. Texture matrices were
determined considering 26-connected voxels (i.e. voxels were considered to be neigh-
bours in all 13 directions in three dimensions) and a distance of one voxel between
consecutive voxels was set for co-occurrence and grey level run-length matrices. Fea-
tures derived from co-occurrence and grey level run-length matrices were calculated by
averaging their value over all 13 considered directions in three dimensions.
Overall, the extracted imaging features comprised 15 first order statistics, 39 de-
scriptors of intensity volume histograms, 8 geometric features and 44 textural features.
Statistical Analysis
The intra-class correlation coefficient (ICC) [24] was calculated to provide an indication
of both the test-retest and inter-observer reliability of feature measurements. The ICC is
a statistical measure between 0 and 1, where 0 indicates no and 1 indicates perfect
reliability. To determine the ICC, variance estimates were obtained through partitioning
the total variance by means of non-parametric analysis of variance (ANOVA) by ranks.
To assess test-retest reliability of imaging features, we used the definition of ICC(1,1),
given by:
(1,1) =
−
+ ( − 1)
Where BMS and WMS are respectively the between-subjects and within-subjects mean
squares, obtained by Kruskal-Wallis one-way ANOVA, and k is the number of repeated
measurements (i.e. PET scans). Inter-observer stability was determined with the defini-
tion of ICC(3,1), with the form:
(3,1) =
−
+ ( − 1)](https://image.slidesharecdn.com/0e20c58a-e59d-4f72-b721-87c0da20639d-160804091812/85/E-book-Thesis-Sara-Carvalho-60-320.jpg)
![STABILITY OF FDG-PET RADIOMICS FEATURES
61
Where BMS and EMS are the between-subjects and residual mean squares acquired
from Friedman’s two-way ANOVA, and k is the number of observers (i.e. delineators).
Absolute variability was estimated as the coefficient of variability (COV), defined as the
value below which the difference between two measurements will be with 95% proba-
bility [25]:
= 1,96 ×
Where SD is the standard deviation for single differences on different subjects (i.e. le-
sions). To provide a basis for evaluating the magnitude of the test-retest and inter-
observer COV values, we normalized them to a percentage of the mean feature value
(COV%mean) as well as the range of feature values (2.5 – 97.5 percentile; COV%range) over
all included lesions. To assess the similarity of the test-retest and inter-observer stability
rankings of features we ranked them, per feature group, in terms of their ICC. The simi-
larity of feature rankings was determined with Spearman’s rank correlation coefficient
(ρS).
All statistical analysis was performed in Matlab R2012b (The Mathworks, Natick, MA).
RESULTS
Lesion identification and delineation resulted in a total number of 18 lesions to be in-
cluded for the test-retest analysis and respectively 27 lesions for the inter-observer
analysis. Test-retest and inter-observer ICC, COV%mean and COV%range values are summa-
rized per feature group in respectively Table 1 and Table 2, where we classified features
into three groups, as having a high (ICC≥0.8), medium (0.8>ICC≥0.5), or low (ICC<0.5)
stability.
AVRIx and RVRIx for x≤50% were excluded from test-retest analysis, since they rep-
resent the entire (relative) tumour volume and therefore provide no additional infor-
mation on test-retest variability. In summary, 71% of all assessed features had high,
18% a medium and 11% a low stability in terms of their test-retest ICC. We found a high
inter-observer stability for 91% of imaging features, whereas 8% and 1% of the features
had a medium or respectively low stability. As expected, SUVmax and SUVpeak showed
perfect inter-observer stability (ICC=1). Because of the same reasoning outlined above,
we also excluded RVRIx and AVRIx for x≤50% from the comparative analysis. Scatter
plots of stability rankings for every feature group are depicted in Figure 3.A-D. Consider-
ing all features, we observed a good overall similarity in feature stability rankings in
terms of test-retest and inter-observer ICCs (ρS =0.67, p<0.01). Comparing stability rank-
ings per feature group, we found a high similarity for both the first order statistics
(ρS=0.88, p<0.01) and the textural features (ρS=0.72, p<0.01).
As can be observed from Figure 3.D, features based on GLSZM have the overall low-
est ranks in both analyses, indicating these features have the highest variability amongst](https://image.slidesharecdn.com/0e20c58a-e59d-4f72-b721-87c0da20639d-160804091812/85/E-book-Thesis-Sara-Carvalho-61-320.jpg)
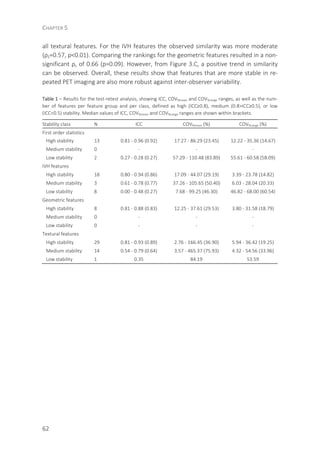
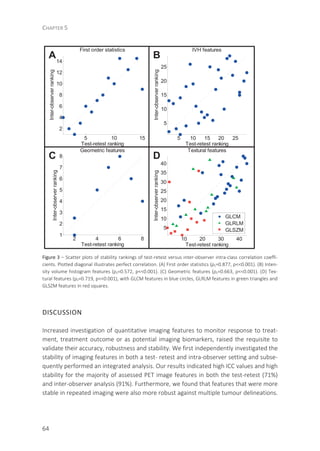
![STABILITY OF FDG-PET RADIOMICS FEATURES
65
These results suggest that, even though there are different sources of feature variabil-
ity, one can define a set of features being overall most reliable.
We focused our results mainly on the ICC. Being a dimensionless statistic, the ICC is
useful when comparing the stability of measures with different units, as is the case with
the PET imaging features assessed in this study. We chose arbitrary ICC thresholds to
define high, medium and low stability. There is however no consensus how high the ICC
should be to for a measure to be considered to have an acceptably high reliability, since
the ICC is a relative measure determined from the between and within subject (i.e.
lesion) variance, which makes it a sample specific measure. This implies that ICC values
obtained from our test-retest analysis were not directly comparable to those from the
inter-observer analysis, since they were independently obtained from two different
patient cohorts (i.e. different lesions and differences in image acquisition and recon-
struction). To overcome this limitation, we ranked features according to their ICC, allow-
ing us to compare stability rankings of features between the two analyses.
In the inter-observer analysis, SUVmax and SUVpeak both had an ICC of 1, indicating
perfect stability. However, we did observe a small COV for these features, which was
unexpected. A detailed look into all delineations revealed that for only one lesion, one
delineator did not include the maximum uptake voxel in the delineated tumour region.
Tixier et al. [16] studied the reliability of a number of basic and textural FDG-PET fea-
tures in a test-retest setting in oesophageal cancer. Although the results presented in
that study are not directly comparable to our test-retest results, it can be observed that
textural features based on grey-level size-zone matrix representations appear to be the
least stable ones, which is also supported by our test-retest, inter-observer and inte-
grated analysis.
While the ICC is a useful tool in assessing the reliability of feature measurements, it
is not directly related to a feature’s clinical usefulness. For a more complete picture,
one would like to know if the inter patient variability or respectively the change in fea-
ture values between a reference time point (e.g. pre-treatment) and a point of interest
(e.g. during or post treatment) is large enough to be considered useful. To assess this
aspect of feature variability, a measure besides the ICC is necessary that provides in-
formation on the variability in terms of the feature’s unit of measurement. In our study
we therefore estimated both the test-retest and inter-observer coefficient of variability
for every feature and normalized them to a percentage of the mean feature value as
well as the range, to provide easy to interpret values regarding the magnitude of the
COV. The larger the COV is compared to inter patient variability or changes in feature
values, the less likely it is that the feature under consideration is a useful predictor or
biomarker. One has to note however, that like the ICC, COV values are sample specific
estimates and typical feature values (i.e. mean and range) are likely to be different
when considering different patient populations. Furthermore, the level of variation of a
feature that is considered acceptable depends on its intended purpose.](https://image.slidesharecdn.com/0e20c58a-e59d-4f72-b721-87c0da20639d-160804091812/85/E-book-Thesis-Sara-Carvalho-65-320.jpg)
![CHAPTER 5
66
A limitation of our study is the small number of patients in both cohorts. Although a
broad range of tumour sizes and levels of tracer uptake were included, external valida-
tion is needed to assess if our results are representative for NSCLC patients in general.
Besides feature variability due to repeated imaging and inconsistency between multiple
manual tumour delineations, there are more sources of variability that can be taken
into consideration. Galavis et al. [17] pointed out that quantitative imaging features are
also subject to vary due to different acquisition modes and reconstruction parameters.
Also the level of image discretization has been shown to impact the variability of certain
textural features, as demonstrated by Tixier et at. [16]. Taking these sources of variabil-
ity into account, it is evident that standardization is desirable with the prospect of FDG-
PET Radiomics features for treatment monitoring, outcome prediction or imaging bi-
omarkers.
CONCLUSION
The aim of this study was to perform an integrated stability analysis of PET Radiomics
features obtained from FDG-PET imaging in NSCLC. Our results showed that the majori-
ty of assessed features had both a high test-retest (71%) as well as inter-observer stabil-
ity (91%) in terms of their intra-class correlation coefficient. Furthermore, it was ob-
served that features more stable in repeated PET imaging were in general also more
robust against inter-observer variability. Results suggest that further research of quanti-
tative imaging features is warranted with respect to more advanced applications of PET
imaging as being used for treatment monitoring, outcome prediction or imaging bi-
omarkers.
ACKNOWLEDGEMENTS
Authors acknowledge the QuIC-ConCePT project, which is partly funded by EFPIA com-
panies and the Innovative Medicine Initiative Joint Undertaking (IMI JU) under Grant
Agreement No. 115151. Authors also acknowledge financial support from the National
Institute of Health (NIH-USA U01 CA 143062-01, Radiomics of NSCLC), the CTMM
framework (AIRFORCE project, grant 030-103), EU 6th and 7th framework program
(EUROXY, METOXIA, EURECA, ARTFORCE), euroCAT (IVA Interreg - www.eurocat.info),
Kankeronderzoekfonds Limburg from the Health Foundation Limburg and the Dutch
Cancer Society (KWF UM 2011-5020, KWF UM 2009-4454).](https://image.slidesharecdn.com/0e20c58a-e59d-4f72-b721-87c0da20639d-160804091812/85/E-book-Thesis-Sara-Carvalho-66-320.jpg)
![STABILITY OF FDG-PET RADIOMICS FEATURES
67
REFERENCES
[1] Lin P, Koh ES, Lin M, Vinod SK, Ho-Shon I, Yap J, et al. Diagnostic and staging impact of radiotherapy
planning FDG-PET-CT in non-small-cell lung cancer. Radiother Oncol 2011;101: 284-290.
[2] De Ruysscher D, Nestle U, Jeraj R, Macmanus M. PET scans in radiotherapy planning of lung cancer. Lung
Cancer 2012;75: 141-145.
[3] Van Elmpt W, Pottgen C, De Ruysscher D. Therapy response assessment in radiotherapy of lung cancer.
Q J Nucl Med Mol Imaging 2011;55: 648-654.
[4] Thie J. Understanding the standardized uptake value, its methods, and implications for usage. Journal of
nuclear medicine 2004;45: 1431-1434.
[5] van Elmpt W, Ollers M, Dingemans AM, Lambin P, De Ruysscher D. Response assessment using 18F-FDG
PET early in the course of radiotherapy correlates with survival in advanced-stage non-small cell lung
cancer. J Nucl Med 2012;53: 1514-1520.
[6] Takeda A, Yokosuka N, Ohashi T, Kunieda E, Fujii H, Aoki Y, et al. The maximum standardized uptake
value (SUVmax) on FDG-PET is a strong predictor of local recurrence for localized non-small-cell lung
cancer after stereotactic body radiotherapy (SBRT). Radiother Oncol 2011;101: 291-297.
[7] Velazquez ER, Aerts HJ, Oberije C, De Ruysscher D, Lambin P. Prediction of residual metabolic activity
after treatment in NSCLC patients. Acta Oncol 2010;49: 1033-1039.
[8] Vaidya M, Creach KM, Frye J, Dehdashti F, Bradley JD, El Naqa I. Combined PET/CT image characteristics
for radiotherapy tumour response in lung cancer. Radiother Oncol 2012;102: 239-245.
[9] Tixier F, Le Rest CC, Hatt M, Albarghach N, Pradier O, Metges JP, et al. Intratumour heterogeneity char-
acterized by textural features on baseline 18F-FDG PET images predicts response to concomitant radi-
ochemotherapy in esophageal cancer. J Nucl Med 2011;52: 369-378.
[10] El Naqa I, Grigsby P, Apte A, Kidd E, Donnelly E, Khullar D, et al. Exploring feature-based approaches in
PET images for predicting cancer treatment outcomes. Pattern Recognit 2009;42: 1162-1171.
[11] Buckler AJ, Bresolin L, Dunnick NR, Sullivan DC. Quantitative imaging test approval and biomarker qualifi-
cation: interrelated but distinct activities. Radiology 2011;259: 875-884.
[12] Lambin P, van Stiphout RG, Starmans MH, Rios-Velazquez E, Nalbantov G, Aerts HJ, et al. Predicting
outcomes in radiation oncology--multifactorial decision support systems. Nat Rev Clin Oncol 2013;10:
27-40.
[13] Lambin P, Rios-Velazquez E, Leijenaar R, Carvalho S, van Stiphout RG, Granton P, et al. Radiomics: ex-
tracting more information from medical images using advanced feature analysis. Eur J Cancer 2012;48:
441-446.
[14] Kumar V, Gu Y, Basu S, Berglund A, Eschrich SA, Schabath MB, et al. Radiomics: the process and the
challenges. Magn Reson Imaging 2012;30: 1234-1248.
[15] de Langen AJ, Vincent A, Velasquez LM, van Tinteren H, Boellaard R, Shankar LK, et al. Repeatability of
18F-FDG uptake measurements in tumours: a metaanalysis. J Nucl Med 2012;53: 701-708.
[16] Tixier F, Hatt M, Le Rest CC, Le Pogam A, Corcos L, Visvikis D. Reproducibility of tumour uptake hetero-
geneity characterization through textural feature analysis in 18F-FDG PET. J Nucl Med 2012;53: 693-700.
[17] Galavis PE, Hollensen C, Jallow N, Paliwal B, Jeraj R. Variability of textural features in FDG PET images due
to different acquisition modes and reconstruction parameters. Acta Oncol 2010;49: 1012-1016.
[18] Frings V, de Langen AJ, Smit EF, van Velden FH, Hoekstra OS, van Tinteren H, et al. Repeatability of
metabolically active volume measurements with 18F-FDG and 18F-FLT PET in non-small cell lung cancer.
J Nucl Med 2010;51: 1870-1877.
[19] Cheebsumon P, Boellaard R, de Ruysscher D, van Elmpt W, van Baardwijk A, Yaqub M, et al. Assessment
of tumour size in PET/CT lung cancer studies: PET- and CT-based methods compared to pathology. EJN-
MMI Res 2012;2: 56.
[20] van Baardwijk A, Bosmans G, Boersma L, Buijsen J, Wanders S, Hochstenbag M, et al. PET-CT-based auto-
contouring in non-small-cell lung cancer correlates with pathology and reduces interobserver variability](https://image.slidesharecdn.com/0e20c58a-e59d-4f72-b721-87c0da20639d-160804091812/85/E-book-Thesis-Sara-Carvalho-67-320.jpg)
![CHAPTER 5
68
in the delineation of the primary tumour and involved nodal volumes. Int J Radiat Oncol Biol Phys
2007;68: 771-778.
[21] Deasy JO, Blanco AI, Clark VH. CERR: a computational environment for radiotherapy research. Med Phys
2003;30: 979-985.
[22] Haralick RM, Shanmugam K, Dinstein I. Textural Features of Image Classification. IEEE T Syst Man Cyb
1973;SMC-3: 610-621.
[23] Galloway M. Texture analysis using gray level run lengths. Comput Vision Graph 1975;4: 172-179.
[24] Shrout PE, Fleiss JL. Intraclass Correlations: Uses in Assessing Rater Reliability. Psychol Bull 1979;86: 420-
428.
[25] Bland J, Altman D. Agreement between methods of measurement with multiple observations per indi-
vidual. J Biopharm Stat 2007;17: 571-582.](https://image.slidesharecdn.com/0e20c58a-e59d-4f72-b721-87c0da20639d-160804091812/85/E-book-Thesis-Sara-Carvalho-68-320.jpg)
![STABILITY OF FDG-PET RADIOMICS FEATURES
69
DEFINITION OF IMAGING FEATURES
1. First-order statistics
Let P define the first order histogram
and P(i) the fraction of voxels with
intensity level i. Ni is the number of
discrete intensity levels.
Energy – the sum of all voxel SUV val-
ues squared.
Entropy
( ) ( )
Kurtosis – the kurtosis of the first order
histogram of voxel intensities.
Mean absolute deviation – the mean of
the absolute deviations of all voxel
intensities around the mean intensity
value.
Median – the median intensity value.
Minimum – the minimum intensity
value.
Range – the range of intensity values.
Root mean square – the quadratic
mean, or the square root of the mean
of squares of all voxel intensities.
Skewness – the skewness of the first
order histogram of voxel SUV values.
Standard deviation – the standard
deviation of all SUV values.
Maximum SUV – the maximum SUV
value.
Mean SUV – the mean SUV value.
Peak SUV – defined as the mean SUV
within a 1 cm3
sphere centred on the
maximum SUV voxel [1].
Uniformity
= ( )
Variance – the variance of all SUV val-
ues.
2. Shape and size descriptors
Geometric features, describing the
shape and size of the volume of inter-
est. Let V be the volume and A the
surface area of the volume of interest.
Compactness 1
√
Compactness 2
36
Maximum 3D diameter – the maximum
three-dimensional tumour diameter.
Spherical disproportion:
4
Where is the radius of a sphere with
the same volume as the tumour.
Sphericity
(6 )
Surface to volume ratio – the surface
area divided by the volume.](https://image.slidesharecdn.com/0e20c58a-e59d-4f72-b721-87c0da20639d-160804091812/85/E-book-Thesis-Sara-Carvalho-69-320.jpg)
![CHAPTER 5
70
3. Gray-Level Co-Occurrence
Matrixes
Gray level co-occurrence matrix based
features, as described by Haralick et al
[2].
Let:
( , ) be the co-occurrence matrix,
be the number of discrete intensity
levels in the image,
be the mean of ( , ),
( ) be the mean of row ,
( ) be the mean of column ,
( ) be the standard deviation of row
,
( ) be the standard deviation of
column ,
( ) = ∑ ( , ),
( ) = ∑ ( , ),
( ) = ∑ ∑ ( , ),
+ = , = 2,3, … ,2 ,
( ) = ∑ ∑ ( , ),
| − | = , = 0,1, … , − 1,
1 =
− ∑ ∑ ( , )log ( ( ) ( )),
2
= − ( ) ( ) log ( ) ( ) .
Autocorrelation:
( , )
Cluster Prominence
+ − ( ) − ( ) ( , )
Cluster Shade
+ − ( ) − ( ) ( , )
Cluster Tendency
+ − ( ) − ( ) ( , )
Contrast
| − | ( , )
Correlation
∑ ∑ ( , ) − ( ) ( )
( ) ( )
Difference entropy
( ) log ( )
Dissimilarity
| − | ( , )
Energy
( , )
Entropy
− ( , ) log ( , )
Homogeneity 1
( , )
1 + | − |](https://image.slidesharecdn.com/0e20c58a-e59d-4f72-b721-87c0da20639d-160804091812/85/E-book-Thesis-Sara-Carvalho-70-320.jpg)
![STABILITY OF FDG-PET RADIOMICS FEATURES
71
Homogeneity 2
( , )
1 + | − |
Informational measure of correlation 1
− 1
,
Where H is the entropy.
Informational measure of correlation 2
1 − ( )
Where H is the entropy.
Inverse Difference Moment Normalized
( , )
1 +
| − |
Inverse Difference Normalized
( , )
1 +
| − |
Inverse variance
( , )
| − |
, ≠
Maximum Probability
( , )
Sum average
( )
Sum entropy
− ( ) log ( )
Sum variance
( − ) ( )
Variance
( − ) ( , )
4. Gray-Level Run-Length matrixes
Gray-level run-length matrix based
features, as described by Galloway et
al. [3].
Let: p(i, j|θ) be the (i, j)th entry in the
given run-length matrix p for a direc-
tion θ,
N the number of discrete intensity
values in the image,
N the number of different run lengths,
N the number of voxels in the image.
Short Run Emphasis
∑ ∑
( , | )
∑ ∑ ( , | )
Long Run Emphasis
∑ ∑ ( , | )
∑ ∑ ( , | )
Gray Leven Non-Uniformity
∑ ∑ ( , | )
∑ ∑ ( , | )
Run Length Non-Uniformity
=
∑ ∑ ( , | )
∑ ∑ ( , | )
Run Percentage
( , | )](https://image.slidesharecdn.com/0e20c58a-e59d-4f72-b721-87c0da20639d-160804091812/85/E-book-Thesis-Sara-Carvalho-71-320.jpg)
![CHAPTER 5
72
Low Gray Level Run Emphasis
∑ ∑
( , | )
∑ ∑ ( , | )
High Gray Level Run Emphasis
∑ ∑ ( , | )
∑ ∑ ( , | )
Short Run Low Gray Level Emphasis
∑ ∑
( , | )
∑ ∑ ( , | )
Short Run High Gray Level Emphasis
∑ ∑
( , | )
∑ ∑ ( , | )
Long Run Low Gray Level Emphasis
∑ ∑
( , | )
∑ ∑ ( , | )
Long Run High Gray Level Emphasis
∑ ∑ ( , | )
∑ ∑ ( , | )
5. Gray-Level size-zone matrixes
Gray-level size-zone matrix based fea-
tures, as described by Tixier et al. [4].
Let:
p(i, j) be the (i, j)th entry in the given
size-zone matrix p,
N the number of discrete intensity
values in the image,
N the size of the largest, homogene-
ous region in the volume of interest,
N the number homogeneous areas in
the image.
Small area Emphasis
∑ ∑
( , )
∑ ∑ ( , )
Large area Emphasis
∑ ∑ ( , )
∑ ∑ ( , )
Intensity variability
∑ ∑ ( , )
∑ ∑ ( , )
Size-zone variability
∑ ∑ ( , )
∑ ∑ ( , )
Zone Percentage
( , )
Low intensity Emphasis
∑ ∑
( , )
∑ ∑ ( , )
High intensity Emphasis
∑ ∑ ( , )
∑ ∑ ( , )
Low intensity small area Emphasis
∑ ∑
( , )
∑ ∑ ( , )](https://image.slidesharecdn.com/0e20c58a-e59d-4f72-b721-87c0da20639d-160804091812/85/E-book-Thesis-Sara-Carvalho-72-320.jpg)
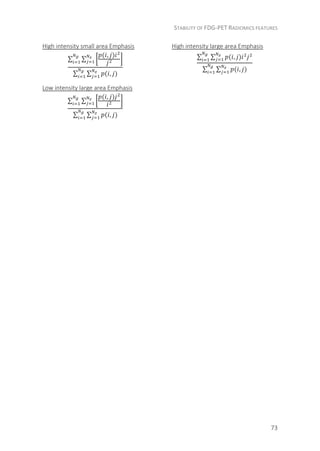
![CHAPTER 5
74
REFERENCES
[1] Wahl RL, Jacene H, Kasamon Y, Lodge MA. From RECIST to PERCIST: Evolving Considerations for PET
response criteria in solid tumours. Journal of nuclear medicine : official publication, Society of Nuclear
Medicine. 2009 May;50 Suppl 1:122S-150S.
[2] Haralick RM, Shanmugam K, Dinstein I. Textural Features of Image Classification. IEEE T Syst Man Cyb.
1973;SMC-3(6):610-621.
[3] Galloway M. Texture analysis using gray level run lengths. Comput Vision Graph. 1975;4:172-179.
[4] Tixier F, Hatt M, Le Rest CC, Le Pogam A, Corcos L, Visvikis D. Reproducibility of tumour uptake hetero-
geneity characterization through textural feature analysis in 18F-FDG PET. J Nucl Med. [Research Sup-
port, Non-U.S. Gov't]. 2012 May;53(5):693-700.](https://image.slidesharecdn.com/0e20c58a-e59d-4f72-b721-87c0da20639d-160804091812/85/E-book-Thesis-Sara-Carvalho-74-320.jpg)
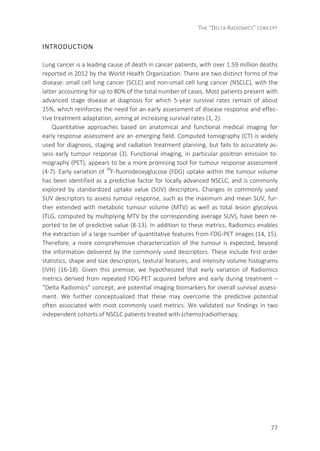
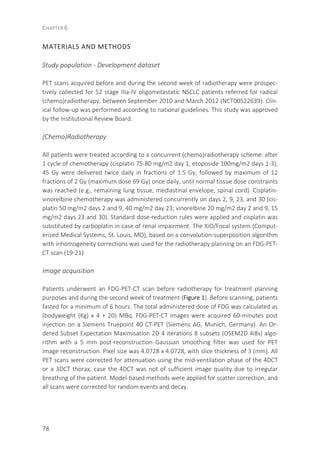
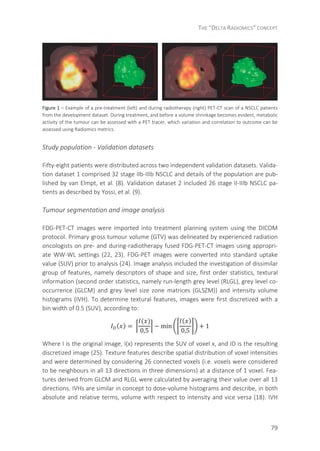
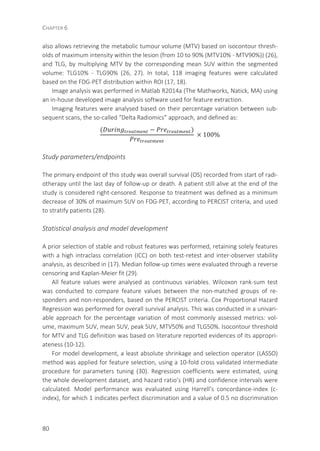
![THE “DELTA RADIOMICS” CONCEPT
81
(no greater than the chance expectation), and was reported both internally as external-
ly, using the two independent validation datasets. The log-linearity assumption was
verified for the selected features in the final models by fitting a penalized smoothing
spline. Features selected for the multivariable model were fitted according to the visual
inspection of the linear intervals. The Cox proportional hazards assumption was graph-
ically inspected on Schoenfeld residuals.
All statistical methods were performed in R (version 2.15.2), using the libraries sur-
vcomp, survival, glmnet and corrplot (31).
RESULTS
Demographic and clinical information from both development and validation datasets is
displayed in Table 1. Median follow-up was 3.92 years (95% CI: 3.70 – 4.12 years), 6.86
years (95% CI: 6.64 – 6.92 years) and 4.04 years (95% CI: 3.39 – NA years) for the devel-
opment and validation datasets 1 and 2, respectively.
Table 1 – Clinical data of patients under analysis in the development and validation datasets.
Development (n=52) Validation 1 (n=32) Validation 2 (n=26)
Age [years]
Range (median) 35 – 86 46 – 82 (64) 41 – 76 (62)
Mean ± SD 62 ± 10 65 ± 9 61 ± 8
Gender
Male 29 (56%) 23 (72%) 24 (92%)
Female 23 (44%) 9 (28%) 2 (8%)
Stage
II - 2 (6%) 4 (15%)
IIIa 18 (35%) 14 (44%) 15* (58%)
IIIb 26 (50%) 16 (50%) 7 (27%)
IV 8 (15%) - -
Histology
Adenocarcinoma 17 (32%) 6 (19%) 11 (42%)
Squamous cell carcinoma 14 (27%) 9 (28%) 13 (50%)
NSCLC Otherwise Specified 19 (37%) 17 (53%) 2 (8%)
Unknown 2 (4%) - -
Radiotherapy (dose)
Range (median) 45 – 95 (69) 46 – 70 (61) 66 – 70 (66)
Mean ± SD 66 ± 7 61 ± 7 68 ± 2](https://image.slidesharecdn.com/0e20c58a-e59d-4f72-b721-87c0da20639d-160804091812/85/E-book-Thesis-Sara-Carvalho-81-320.jpg)
![CHAPTER 6
82
Development (n=52) Validation 1 (n=32) Validation 2 (n=26)
Chemotherapy
Concurrent 52 (100%) 13 (41%) 26 (100%)
Sequential - 18 (56%) -
No - 1 (3%) -
Interval PET – First RT (days)
Range (median) 4 – 16 (7) 2 – 13 (8) 5 – 93 (33)
Mean ± SD 7 ± 2 8 ± 2 40 ± 21
Interval First RT – PET (days)
Range (median) 5 – 20 (15) 6 – 19 (8) 15 – 32 (22)
Mean ± SD 15 ± 2 9 ± 3 21 ± 4
Interval between PET scans (days)
Range (median) 17 – 27 (22) 10 – 24 (16) 21 – 110 (54)
Mean ± SD 22 ± 2 17 ± 3 61 ± 21
* Includes one TXN2M0 patient, for which the merged structure between node and tumour was analysed.
** Solely one patient was acquired with an interval over 30 days after start of radiotherapy.
Identification of stable and robust Radiomics features resulted in the selection of 77
features for analysis. Response to treatment based on a 30% decrease of maximum
SUV, as in the PERCIST criteria, identified a group of 24 responders (maximum SUV
variation from -30% to -79% [-46±13]) and 28 non-responders (maximum SUV variation
from -28% to 300% [18±66]). Out of the 77 analysed features, 58 showed a statistical
mean feature value difference between responders and non-responders. None of the
shape and size metrics showed evidence for early response differentiation, along with
IVH metrics related to absolute tumour volume portions with increasing intensity (MTV)
in the development cohort. On the other hand, first order statistics metrics, including
maximum, peak and mean SUV, were all statistically related to outcome. Both TLG de-
scriptors derived from IVH metrics, as well as all investigated texture metrics, with the
exception of grey level non-uniformity, from the RLGL sub-category could be associated
with early response discrimination as well.](https://image.slidesharecdn.com/0e20c58a-e59d-4f72-b721-87c0da20639d-160804091812/85/E-book-Thesis-Sara-Carvalho-82-320.jpg)
![THE “DELTA RADIOMICS” CONCEPT
83
Table 2 – Cox regression on the percentage variation of the PET imaging descriptors most commonly used,
reporting the univariable hazard ratio (HR), 95% confidence interval (CI) of the HR and corresponding p-value.
Univariable performance is reported in terms of the concordance-index (c-index). Pre and during radiotherapy
(RT) absolute values, and percentage variation between PET acquisitions of the analysed metrics is also pre-
sented (mean ± standard deviation).
Pre-RT During RT Percentage
variation
HR 95% CI p-value c-index
Volume [cm
3
] 79±110 68±108 -21±41 1.00 0.99 – 1.01 0.46 0.53
Maximum SUV 11±6.0 8.3±4.0 -11±59 1.00 1.00 – 1.01 0.90 0.51
Mean SUV 4.7±2.4 3.5±1.5 -0.4±112 1.00 1.00 – 1.00 0.80 0.53
Peak SUV 8.7±5.1 6.3±3.3 -14±56 1.00 0.99 – 1.01 0.98 0.50
MTV50% 22±34 17±27 -18±50 1.00 0.99 – 1.01 0.63 0.51
TLG50% 198±352 105±180 -35±50 1.00 1.00 – 1.00 0.74 0.50
Acronyms: RT – Radiotherapy; HR – hazard ratio; CI – confidence interval; c-index – concordance-index; SUV –
Standard uptake value; MTV50% – Metabolic Tumour Volume defined for an isocontour of 50% maximum SUV
(assessed from absolute volume of relative intensity, from IVH metrics); TLG50% – Total Lesion Glycolysis
defined for an isocontour of 50% maximum SUV.
Univariable analysis of percentage variation of most common metabolic metrics in the
development cohort is presented in Table 2. From this analysis one can appreciate non-
significant hazard ratios (HR) of early percentage variation of volume (HR=0.99, p=0.46),
maximum SUV (HR=1.00, p=0.90), peak SUV (HR=1.00, p=0.98), mean SUV (HR=1.00,
p=0.80), MTV50% (HR=1.00, p=0.63), and TLG50% (HR=1.00, p=0.74). A multivariable fit
of the data with a LASSO feature selection methodology returned a model including the
percentage variation of gross tumour volume (shape), textural information described
from grey level non-uniformity and long run emphasis (RLGL) sum entropy (GLCM), and
high intensity large area emphasis (GLSZM), and MTV derived from the absolute volume
of a relative intensity of 60% - MTV60% (IVH), which detail can be gathered in Table 3.
Pre and during radiotherapy feature values, as well as percentage variation of these are
shown in Table 4, for the three datasets analysed. None of the features from the first
order statistics sub-category nor TLG were selected for the model.
Features not verifying the log-linearity assumption, were entered in the derived
model by means of a piecewise linear approach, which intervals were verified visually on
the fitted smoothing splines (online appendix). All features met the proportional hazards
assumption. After these corrections, internal performance of the model in the derivation
dataset reached a c-index of 0.66 (p<0.01). External validation had a performance of 0.64
(p<0.01) for validation dataset 1 and 0.57 (p=0.27) for validation dataset 2.](https://image.slidesharecdn.com/0e20c58a-e59d-4f72-b721-87c0da20639d-160804091812/85/E-book-Thesis-Sara-Carvalho-83-320.jpg)
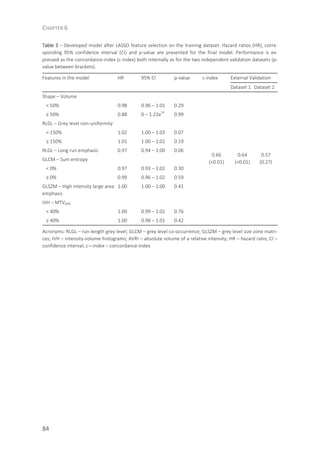
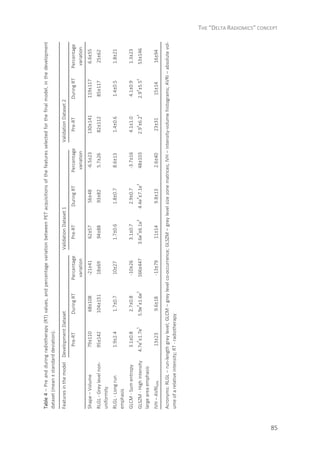
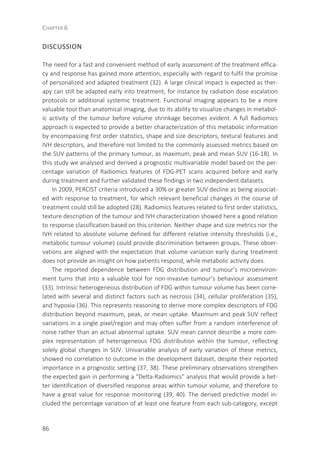
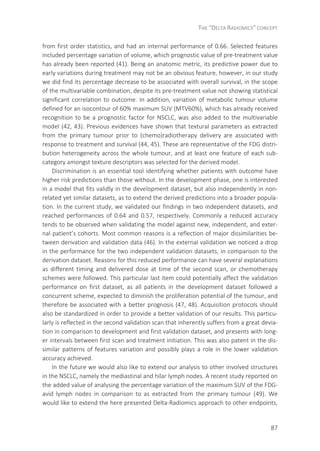
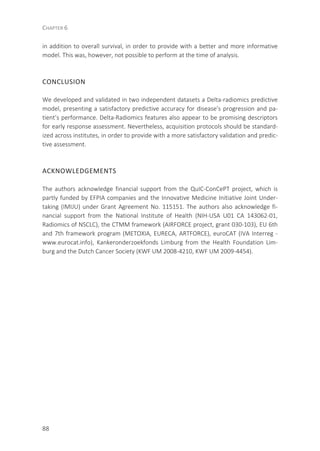
![THE “DELTA RADIOMICS” CONCEPT
89
REFERENCES
[1] Travis WD BE, Müller-Hermelink HK, Harris CC. Classification of Tumours - Pathology and Genetics of
Tumours of the Lung, Pleura,Thymus and Heart. Lyon, France: IARC Press, International Agency for Re-
search on Cancer; 2004.
[2] Crino L, Weder W, van Meerbeeck J, Felip E. Early stage and locally advanced (non-metastatic) non-
small-cell lung cancer: ESMO Clinical Practice Guidelines for diagnosis, treatment and follow-up. Ann On-
col. 2010;21 Suppl 5:v103-115.
[3] Brindle K. New approaches for imaging tumour responses to treatment. Nat Rev Cancer. 2008;8:94-107.
[4] Decoster L, Schallier D, Everaert H, et al. Complete metabolic tumour response, assessed by 18-
fluorodeoxyglucose positron emission tomography (18FDG-PET), after induction chemotherapy predicts
a favourable outcome in patients with locally advanced non-small cell lung cancer (NSCLC). Lung Cancer.
2008;62:55-61.
[5] Storto G, Nicolai E, Salvatore M. [18F]FDG-PET-CT for early monitoring of tumour response: when and
why. Q J Nucl Med Mol Imaging. 2009;53:167-180.
[6] Van Elmpt W, Pottgen C, De Ruysscher D. Therapy response assessment in radiotherapy of lung cancer.
Q J Nucl Med Mol Imaging. 2011;55:648-654.
[7] Grootjans W, de Geus-Oei LF, Troost EG, Visser EP, Oyen WJ, Bussink J. PET in the management of locally
advanced and metastatic NSCLC. Nat Rev Clin Oncol. 2015;12:395-407.
[8] van Elmpt W, Ollers M, Dingemans AM, Lambin P, De Ruysscher D. Response assessment using 18F-FDG
PET early in the course of radiotherapy correlates with survival in advanced-stage non-small cell lung
cancer. J Nucl Med. 2012;53:1514-1520.
[9] Yossi S, Krhili S, Muratet JP, Septans AL, Campion L, Denis F. Early assessment of metabolic response by
18F-FDG PET during concomitant radiochemotherapy of non-small cell lung carcinoma is associated with
survival: a retrospective single-center study. Clin Nucl Med. 2015;40:e215-221.
[10] Usmanij EA, de Geus-Oei LF, Troost EG, et al. 18F-FDG PET early response evaluation of locally advanced
non-small cell lung cancer treated with concomitant chemoradiotherapy. J Nucl Med. 2013;54:1528-
1534.
[11] Huang W, Zhou T, Ma L, et al. Standard uptake value and metabolic tumour volume of (1)(8)F-FDG
PET/CT predict short-term outcome early in the course of chemoradiotherapy in advanced non-small cell
lung cancer. Eur J Nucl Med Mol Imaging. 2011;38:1628-1635.
[12] Massaccesi M, Calcagni ML, Spitilli MG, et al. (1)(8)F-FDG PET-CT during chemo-radiotherapy in patients
with non-small cell lung cancer: the early metabolic response correlates with the delivered radiation
dose. Radiat Oncol. 2012;7:106.
[13] Huang W, Fan M, Liu B, et al. Value of metabolic tumour volume on repeated 18F-FDG PET/CT for early
prediction of survival in locally advanced non-small cell lung cancer treated with concurrent chemoradio-
therapy. J Nucl Med. 2014;55:1584-1590.
[14] Lambin P, Rios-Velazquez E, Leijenaar R, et al. Radiomics: extracting more information from medical
images using advanced feature analysis. Eur J Cancer. 2012;48:441-446.
[15] Gillies RJ, Kinahan PE, Hricak H. Radiomics: Images Are More than Pictures, They Are Data. Radiology.
2015:151169.
[16] Aerts HJ, Velazquez ER, Leijenaar RT, et al. Decoding tumour phenotype by noninvasive imaging using a
quantitative radiomics approach. Nat Commun. 2014;5:4006.
[17] Leijenaar RT, Carvalho S, Velazquez ER, et al. Stability of FDG-PET Radiomics features: an integrated
analysis of test-retest and inter-observer variability. Acta Oncol. 2013;52:1391-1397.
[18] Carvalho S, Leijenaar RT, Velazquez ER, et al. Prognostic value of metabolic metrics extracted from
baseline positron emission tomography images in non-small cell lung cancer. Acta Oncol. 2013;52:1398-
1404.
[19] Oncology MR. Radiotherapy for Stage I-III Non-small Cell Lung Cancer to an Individualized MLD. 2010,
July 20; http://clinicaltrials.gov/show/NCT00573040. Accessed January 8, 2014.](https://image.slidesharecdn.com/0e20c58a-e59d-4f72-b721-87c0da20639d-160804091812/85/E-book-Thesis-Sara-Carvalho-89-320.jpg)
![CHAPTER 6
90
[20] van Baardwijk A, Bosmans G, Boersma L, et al. Individualized radical radiotherapy of non-small-cell lung
cancer based on normal tissue dose constraints: a feasibility study. Int J Radiat Oncol Biol Phys.
2008;71:1394-1401.
[21] van Baardwijk A, Bosmans G, Boersma L, et al. PET-CT-based auto-contouring in non-small-cell lung
cancer correlates with pathology and reduces interobserver variability in the delineation of the primary
tumour and involved nodal volumes. Int J Radiat Oncol Biol Phys. 2007;68:771-778.
[22] De Ruysscher D. PET-CT in radiotherapy for lung cancer. Methods Mol Biol. 2011;727:53-58.
[23] De Ruysscher D, Nestle U, Jeraj R, Macmanus M. PET scans in radiotherapy planning of lung cancer. Lung
Cancer. 2012;75:141-145.
[24] Kinahan PE, Fletcher JW. Positron emission tomography-computed tomography standardized uptake
values in clinical practice and assessing response to therapy. Semin Ultrasound CT MR. 2010;31:496-505.
[25] Leijenaar RT, Nalbantov G, Carvalho S, et al. The effect of SUV discretization in quantitative FDG-PET
Radiomics: the need for standardized methodology in tumour texture analysis. Sci Rep. 2015;5:11075.
[26] Van de Wiele C, Kruse V, Smeets P, Sathekge M, Maes A. Predictive and prognostic value of metabolic
tumour volume and total lesion glycolysis in solid tumours. Eur J Nucl Med Mol Imaging. 2013;40:290-301.
[27] Visser EP, Philippens ME, Kienhorst L, et al. Comparison of tumour volumes derived from glucose meta-
bolic rate maps and SUV maps in dynamic 18F-FDG PET. J Nucl Med. 2008;49:892-898.
[28] Wahl RL, Jacene H, Kasamon Y, Lodge MA. From RECIST to PERCIST: Evolving Considerations for PET
response criteria in solid tumours. J Nucl Med. 2009;50 Suppl 1:122S-150S.
[29] Schemper M, Smith TL. A note on quantifying follow-up in studies of failure time. Control Clin Trials.
1996;17:343-346.
[30] Tibshirani R. The lasso method for variable selection in the Cox model. Stat Med. 1997;16(4):385-395.
[31] R: A language and environment for statistical computing [computer program]. Version 2.15.2; 2015.
[32] Lambin P, Roelofs E, Reymen B, et al. 'Rapid Learning health care in oncology' - An approach towards
decision support systems enabling customised radiotherapy'. Radiother Oncol. 2013.
[33] Pugachev A, Ruan S, Carlin S, et al. Dependence of FDG uptake on tumour microenvironment. Int J Radiat
Oncol Biol Phys. 2005;62:545-553.
[34] Sorensen M, Horsman MR, Cumming P, Munk OL, Keiding S. Effect of intratumoural heterogeneity in
oxygenation status on FMISO PET, autoradiography, and electrode Po2 measurements in murine tu-
mours. Int J Radiat Oncol Biol Phys. 2005;62:854-861.
[35] Avril N, Menzel M, Dose J, et al. Glucose metabolism of breast cancer assessed by 18F-FDG PET: histolog-
ic and immunohistochemical tissue analysis. J Nucl Med. 2001;42:9-16.
[36] Troost EG, Bussink J, Kaanders JH, et al. Comparison of different methods of CAIX quantification in rela-
tion to hypoxia in three human head and neck tumour lines. Radiother Oncol. 2005;76:194-199.
[37] Paesmans M, Garcia C, Wong CY, et al. Primary tumour standardised uptake value is prognostic in nonsmall
cell lung cancer: a multivariate pooled analysis of individual data. Eur Respir J. 2015;46:1751-1761.
[38] Fried DV, Mawlawi O, Zhang L, et al. Stage III Non-Small Cell Lung Cancer: Prognostic Value of FDG PET
Quantitative Imaging Features Combined with Clinical Prognostic Factors. Radiology. 2016;278:214-222.
[39] El Naqa I, Grigsby P, Apte A, et al. Exploring feature-based approaches in PET images for predicting
cancer treatment outcomes. Pattern Recognit. 2009;42:1162-1171.
[40] van Velden FH, Cheebsumon P, Yaqub M, et al. Evaluation of a cumulative SUV-volume histogram meth-
od for parameterizing heterogeneous intratumoural FDG uptake in non-small cell lung cancer PET stud-
ies. Eur J Nucl Med Mol Imaging. 2011;38:1636-1647.
[41] Oberije C, De Ruysscher D, Houben R, et al. A Validated Prediction Model for Overall Survival From Stage
III Non-Small Cell Lung Cancer: Toward Survival Prediction for Individual Patients. Int J Radiat Oncol Biol
Phys. 2015;92:935-944.
[42] Ohri N, Duan F, Machtay M, et al. Pretreatment FDG-PET metrics in stage III non-small cell lung cancer:
ACRIN 6668/RTOG 0235. J Natl Cancer Inst. 2015;107.
[43] Huang W, Liu B, Fan M, et al. The early predictive value of a decrease of metabolic tumour volume in
repeated (18)F-FDG PET/CT for recurrence of locally advanced non-small cell lung cancer with concur-
rent radiochemotherapy. Eur J Radiol. 2015;84:482-488.](https://image.slidesharecdn.com/0e20c58a-e59d-4f72-b721-87c0da20639d-160804091812/85/E-book-Thesis-Sara-Carvalho-90-320.jpg)
![THE “DELTA RADIOMICS” CONCEPT
91
[44] Cook GJ, Yip C, Siddique M, et al. Are pretreatment 18F-FDG PET tumour textural features in non-small
cell lung cancer associated with response and survival after chemoradiotherapy? J Nucl Med.
2013;54:19-26.
[45] Hatt M, Majdoub M, Vallieres M, et al. 18F-FDG PET uptake characterization through texture analysis:
investigating the complementary nature of heterogeneity and functional tumour volume in a multi-
cancer site patient cohort. J Nucl Med. 2015;56:38-44.
[46] Toll DB, Janssen KJ, Vergouwe Y, Moons KG. Validation, updating and impact of clinical prediction rules: a
review. J Clin Epidemiol. 2008;61:1085-1094.
[47] Ozcelik M, Korkmaz T, Odabas H, et al. Comparison of efficacy and safety of three different chemothera-
py regimens delivered with concomitant radiotherapy in inoperable stage III non-small cell lung cancer
patients. Tumour Biol. 2016.
[48] Curran WJ, Jr., Paulus R, Langer CJ, et al. Sequential vs. concurrent chemoradiation for stage III non-small
cell lung cancer: randomized phase III trial RTOG 9410. J Natl Cancer Inst. 2011;103:1452-1460.
[49] Markovina S, Duan F, Snyder BS, Siegel BA, Machtay M, Bradley JD. Regional Lymph Node Uptake of
[(18)F]Fluorodeoxyglucose After Definitive Chemoradiation Therapy Predicts Local-Regional Failure of
Locally Advanced Non-Small Cell Lung Cancer: Results of ACRIN 6668/RTOG 0235.](https://image.slidesharecdn.com/0e20c58a-e59d-4f72-b721-87c0da20639d-160804091812/85/E-book-Thesis-Sara-Carvalho-91-320.jpg)

![FDG-PET RADIOMICS OF METASTATIC LYMPH NODES AND PRIMARY TUMOUR IN NSCLC
95
INTRODUCTION
Non-small cell lung cancer (NSCLC) patients often present with hilar and/or mediastinal
lymph node involvement at diagnosis or during the course of disease. Lymph node stage
prior to treatment is strongly related to disease progression and worse prognosis [1].
Furthermore, it affects treatment selection and target volume definition, for metastatic
lymph nodes in patients eligible for high-dose (chemo)radiotherapy [2]. Apart from the
number of metastatic lymph node stations, lymph node size and corresponding meta-
bolic activity may vary among patients [3]. Diagnosis of metastatic hilar/mediastinal
lymph nodes is commonly performed through 18F–fluorodeoxyglucose positron emis-
sion tomography-computed tomography (FDG-PET-CT) and consecutive endoscopic
ultrasound bronchoscopy/oesophagoscopy (EBUS/EUS) or mediastinoscopy [4-7].
Metabolic imaging of NSCLC is being explored more and more widely for use in
prognostics, based on the patterns of the standard uptake value (SUV) of FDG by the
primary tumour, as an extension of its primary diagnostic function: detection of meta-
static lymph nodes and distant metastasis [8, 9]. SUV patterns in FDG-PET can be ana-
lysed by means of a Radiomics-based approach, comprising the extraction of a large set
of imaging descriptors [10]. The underlying hypothesis based on radiomics is that bi-
omarkers of imaging phenotypes deliver complementary and clinically relevant infor-
mation, which could be incorporated into individualised radiation oncology approaches
and shared decision-making tools [11-14].
In this study we hypothesised that the local selection of more aggressive cancer cells
in the metastatic hilar/mediastinal lymph nodes, is more likely to determine prognosis,
and therefore provide an additional and valuable source of information to the primary
tumour for NSCLC patients. To demonstrate this we performed a combined PET-
Radiomics analysis of metabolic activity as measured with FDG uptake in both primary
tumour and metastatic lymph nodes, and further validated these results in an inde-
pendent dataset.
PATIENTS AND METHODS
Development cohort
Patient population
The prospective data collection was approved by the Institutional Review Board of our
institute (NCT00522639). Electronic medical charts of non-small cell lung cancer
(NSCLC) patients were reviewed. Patients undergoing surgery, Stereotactic Body Radio-
therapy (SBRT) or palliative treatment, or who had had a previous malignancy within
five years prior to diagnosis were excluded from analysis. A total of 343 NSCLC patients
(stage I-IIIB) referred to the Radiation Oncology department for curative treatment](https://image.slidesharecdn.com/0e20c58a-e59d-4f72-b721-87c0da20639d-160804091812/85/E-book-Thesis-Sara-Carvalho-95-320.jpg)
![CHAPTER 7
96
(between May 2006 and September 2012) were selected for the development dataset.
Out of these patients, 262 (76%) had metastatic lymph nodes. The patients received
high-dose radiotherapy (RT) combined with chemotherapy, for which an FDG-PET-CT
was available for treatment planning. Clinical follow-up was performed according to
national guidelines.
Image acquisition
Before scanning, patients fasted for minimum of 6 hours. Two different protocols were
used: until December 2010, the total dose of FDG was calculated as (bodyweight x 4 +
20) MBq, but as from January 2011, the administered dose was (2.5 x bodyweight) MBq
as defined by the NEDPAS protocol [15]. FDG-PET-CT images were taken 60 minutes
post injection. Data acquired until December 2006 were gathered on Siemens Biograph
16 CT-PET scanner, and from that time onwards on a Siemens Truepoint 40 CT-PET
(Siemens AG, Munich, Germany). An Ordered Subset Expectation Maximisation 2D 4
iterations 8 subsets (OSEM2D 4i8s) algorithm was used for image reconstruction using
post-reconstruction 5mm Gaussian filtering, and voxel size of 4.0728 x 4.0728, and slice
thickness of 3 (mm). Model-based methods were applied for scatter correction. All PET
scans were corrected for attenuation using the mid-ventilation phase of the 4DCT or a
3DCT thorax in case the 4DCT was not of sufficient image quality due to irregular
breathing of the patient. All exams were corrected for random events and decay.
Validation cohort
Patient population
Using the same criteria as for the development dataset, the validation dataset included
215 stage I-IIIB NSCLC patients, treated with primary radiotherapy between May 2006
and October 2012 at an independent and external institute. In total 115 (53%) patients
were node-positive, of which 50 patients had an available FDG-PET-CT scan prior to
radiotherapy.
Image acquisition
Prior to FDG injection, patients fasted for at least 6 hours. FDG-PET scans were per-
formed 60 minutes after intravenous injection of approximately 250 MBq FDG
(Covidien, Petten, the Netherlands) and 10 mg furosemide. PET scans were performed
on Siemens Biograph Duo (Siemens Medical Solutions USA, Inc.) using three-
dimensional emissions of 4 minutes per bed position as described previously [16]. A
low-dose CT scan for localisation and attenuation-correction purposes was acquired.
Scanning parameters included 40 mA·s (50 mA·s for patient weight >100 kg and 60 mA·s
if >120 kg), 130 kV, 5-mm slice collimation, 0.8-second rotation time, and pitch of 1.5,
reconstructed with 3-mm slices for smooth coronal representation. An OSEM2D 4i16s
algorithm was used for PET image reconstruction, with a voxel size of 5.3 x 5.3 x 3.375](https://image.slidesharecdn.com/0e20c58a-e59d-4f72-b721-87c0da20639d-160804091812/85/E-book-Thesis-Sara-Carvalho-96-320.jpg)
![FDG-PET RADIOMICS OF METASTATIC LYMPH NODES AND PRIMARY TUMOUR IN NSCLC
97
(in mm). All PET scans were corrected for attenuation using CT and simulation ap-
proaches. Model-based methods were applied for scatter correction. All exams were
corrected for random events and decay.
Regions of interest (ROI)
Images were imported into the research treatment planning system Xio/Focal (devel-
opment dataset) and Eclipse (validation dataset) using the DICOM protocol. The primary
gross tumour volume (tumour) and metastatic hilar/mediastinal lymph nodes (LN),
identified as PET positive and/or proven by EBUS/EUS, were manually delineated by
experienced radiation oncologists on the fused FDG-PET-CT images, and used as the
regions of interest for analysis.
Image analysis
Software developed in-house was used to extract Radiomics descriptors from the FDG-
PET scans [17-21]. Imaging descriptors comprised first order statistics (n=16), shape and
size (n=13), intensity volume histograms (n=45), and textural features describing the
spatial distribution of voxel intensities (n=44). Textural features were calculated from
grey-level co-occurrence (GLCM), grey-level run-length (GLRLM) and grey-level size-
zone texture matrices (GLSZM). To determine these matrices, images were first discre-
tised with a bin width of 0.5 (SUV), according to:
( ) =
( )
0,5
− min
( )
0,5
+ 1
Where I is the original image, I(x) represents the SUV of voxel x, and ID is the resulting
discretised image [20]. Texture matrices were then constructed by considering 26 con-
nected voxels (i.e. voxels were considered to be neighbours in all 13 directions in three
dimensions) at a distance of 1 voxel. Features derived from GLCM and RLGL were calcu-
lated by averaging their value over all 13 directions. Forty-four textural features were
extracted (22 GLCM, 11 RLGL and 11 GLSZM). In total, 118 imaging features were calcu-
lated based on the FDG-PET distribution within ROI, which mathematical formulations
can be found elsewhere [18, 19]. Image analysis was performed in Matlab R2012b (The
Mathworks, Natick, MA), based on an adapted version of Computational Environment
for Radiotherapy Research (CERR) [22].
Statistical analysis
Study parameters/endpoints
The primary endpoint of this study was overall survival (OS), defined as the time from
the start of radiotherapy until the last day of follow-up or death due to any cause, and](https://image.slidesharecdn.com/0e20c58a-e59d-4f72-b721-87c0da20639d-160804091812/85/E-book-Thesis-Sara-Carvalho-97-320.jpg)
![CHAPTER 7
98
was available for all patients under analysis. A patient still alive at the end of the study
was regarded as right-censored.
Univariable analysis
Robust and stable PET-Radiomics features, found to be thoroughly described in the
online appendix, were analysed as continuous variables in a univariable Cox regression.
In addition, a correlation analysis was conducted on maximum, peak, and mean SUV,
and volume, for tumour, all metastatic LNs, and tumour load, which was defined as the
union of the tumour and LN volumes.
Multivariable analysis
A prognostic model was fitted to the data with a 10-fold cross-validated least absolute
shrinkage and selection operator (LASSO), selecting amongst the stable and robust PET-
Radiomics descriptors extracted from the tumour (model 1), LN (model 2) and the union
of both structures (model 3) [23]. A diagram illustrating this methodology is shown in
Figure 1. Log-likelihood tests for non-nested models, Akaike information criterion (AIC),
were performed to compare the fit of the three derived models. AIC measures the rela-
tive quality of model fit to a given dataset, providing substantiation for model selection,
i.e. for being the preferred model, which is the one with a lower AIC [24]. Log-linearity
assumption was verified for the selected features in the final models by fitting a penal-
ised smoothing spline. A Cox proportional hazards assumption was graphically examined
for the Schoenfeld residuals.
Figure 1 – Diagram of the workflow followed in the multivariable model development phase. After a test-
retest and inter-observer study, 77 features remained for further analysis, based on a cut-off of 0.85 for the
ICC analysis [19]. Further identification of comparable features extracted from a structure merging all meta-
static lymph nodes (LNmerged) to the largest (LNvolume) or most active node (LNmax), by means of an intra-
class correlation (ICC) over 0.85 and ±10% limits of agreement (LoA) between measurements, was performed
(further details in the online appendix). In summary, 77 features of the primary tumour and 16 from the
metastatic lymph nodes were entered in the model development phase.](https://image.slidesharecdn.com/0e20c58a-e59d-4f72-b721-87c0da20639d-160804091812/85/E-book-Thesis-Sara-Carvalho-98-320.jpg)
![FDG-PET RADIOMICS OF METASTATIC LYMPH NODES AND PRIMARY TUMOUR IN NSCLC
99
Model performance
Model performance was assessed in the development and validation datasets by means
of a concordance-index [25]. Concordance-index, also referred to as Harrell’s C-index,
evaluates the fraction of patient pairs for which the predicted and actual outcome are
concordant, ranging from a random 0.5 to a perfect 1 [26].
A 5% significance level was used in the analysis. All statistical analysis was conducted
in R (version 2.15.2), using the libraries: survival, survcomp, glmnet, cvTols and rms [27].
The development dataset is publicly available at www.cancerdata.org.
RESULTS
Table 1 gives a complete overview of patients under analysis including treatment de-
tails. Node-positive patients with available FDG-PET scans were included in the analysis:
262 for the development dataset and 50 cases for the validation datasets. A univariable
analysis was performed for each of the clinical variables in the development dataset
(Table 2). Results show that TNM staging was not correlated to OS, while N stage was a
prognostic factor at 0.1 level (p=0.09) in the development dataset, with later stages
being associated with a worse prognosis. The number of LN stations was significantly
associated with a higher risk in this cohort of patients. None of the remaining analysed
metrics, including gender, age or histology showed a significant correlation to OS in our
development cohort.](https://image.slidesharecdn.com/0e20c58a-e59d-4f72-b721-87c0da20639d-160804091812/85/E-book-Thesis-Sara-Carvalho-99-320.jpg)
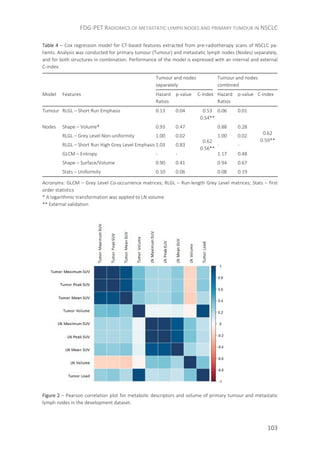
![CHAPTER 7
104
DISCUSSION
Disease management of NSCLC is a primary concern, for which prognostic assessment is
essential to fulfil the potential of individualised and personalised treatment. Nowadays,
a wide range of information sources are available of which the non-invasive types, in
particular imaging, play a fundamental role in reducing the patients’ burden [11-14]. In
this study we correlated PET-Radiomics descriptors of metabolic activity based on FDG
uptake patterns from both the primary tumour and metastatic lymph nodes with overall
survival. Radiomics has been proven to have prognostic potential in predicting clinical
outcomes or treatment monitoring in different cancer types [17, 21, 28, 29]. Radiomics
can essentially be applied to different medical imaging modalities and disease-related
structures such as the primary tumour, metastatic lymph nodes or metastatic lesions.
Based on the rationale that disease progression and the ability to metastasise are close-
ly related to the presence of metastatic lymph nodes, we hypothesised that FDG-PET-
based Radiomics information of these nodes would provide additional prognostic in-
formation in addition to the information that is obtained from the primary tumour [30].
Given the broad range of imaging descriptors which can be analysed with Radiomics,
an initial step in this analysis was aimed at investigating the univariable potential of the
most commonly analysed PET metrics when extracted from tumour and LNs, namely
maximum, peak, and mean SUV, volume and tumour load. None of metabolic metrics
extracted from tumour had significant prognostic value, whereas the same ones ex-
tracted from LNs were related to OS and yielded an univariable C-index of at least 0.57
(Table 3). No statistical significance could be associated with tumour volume (p=0.47),
as opposed to LN volume (p<0.01; c-index 0.60). Tumour load, the sums of volumes of
tumour and LNs, also had prognostic value, in line with previous studies [31]. Despite
the strong correlation between metabolic features within each structure, no correlation
with own volume, or metabolic features of the other structure could be found, contrary
to previous evidence of correlation between maximum SUV of tumour and total LN
volume [32]. One can already infer from this univariable analysis the considerable prog-
nostic value that the metabolic distribution within metastatic lymph nodes has for
node-positive NSCLC patients, which is further reinforced by the remaining features
analysed.
Of the three independent fits, the model with features from LNs alone or LNs in
combination with primary tumour performed best (0.62). The model included at least
one feature from categories of shape and size, first order statistics and texture de-
scriptor, excluding features from the IHV group. The intrinsic heterogeneity described
by the FDG distribution within a primary tumour has proven its prognostic power, not
only for NSCLC, but also for other cancer types [33, 34]. Inclusion of such descriptors in
derived prognostic models, gathering heterogeneity insight into not only primary tu-
mour but also metastatic lymph nodes, resulted in a model with a better fit and more
accurate description of disease structures. Shape descriptors, including total LN volume,](https://image.slidesharecdn.com/0e20c58a-e59d-4f72-b721-87c0da20639d-160804091812/85/E-book-Thesis-Sara-Carvalho-104-320.jpg)
![FDG-PET RADIOMICS OF METASTATIC LYMPH NODES AND PRIMARY TUMOUR IN NSCLC
105
included in the multivariable model, were shown to be an independent prognostic pa-
rameter. In a previous study, tumour load was revealed to be a prognostic factor, but
not LN volume independently, which we proved in this study [31]. Finally, and despite
their univariate prognostic value, particularly when assessed from LN, none of the most
common SUV descriptors were included in the final models. However, as Radiomics
analysis includes a large number of features, selection of the most promising ones is
difficult. We attempted to overcome this difficulty using a LASSO approach and external
validation. Nonetheless, it cannot be completely excluded that other variables have
similar or even greater prognostic value than the current ones, and therefore larger
imaging datasets are needed to validate and confirm our findings. Similarly, another
limitation of our study was the lack of additional patient data for the validation phase. A
lower performance is commonly observed when validating a model against new, inde-
pendent, and external cohorts, which is most frequently attributed to discrepancies
between development and validation data [35]. A larger external dataset which would
increase the robustness of the validation procedure would be beneficial. Nevertheless,
we observed a benefit from combining imaging features from both primary tumour and
metastatic lymph nodes for node-positive NSCLC patients. In terms of prognostics, this
should not be disregarded, particularly when compared to the limited capacity of hu-
mans to infer an accurate prognosis from same data [36].
A recent study with 139 NSCLC patients treated with at least 60Gy with a concurrent
(chemo)radiotherapy regimen showed the importance of measuring the post-treatment
SUV in the metastatic lymph nodes, as an increase in both the absolute value and per-
centage of residual activity compared to the pre-treatment SUV were associated with
worse local-regional control [37]. In our study we looked only at the pre-treatment scan
and could already discern an association with OS of imaging features derived from the
metastatic lymph nodes that could not be assessed based on the primary tumour for
node-positive patients. However, we are planning extension of this analysis to include
the variation of FDG-PET-Radiomics features between subsequent scans at an early
phase of treatment for both the primary tumour and the metastatic lymph nodes, and
their impact on survival for NSCLC patients as a complement to the positive findings
reported here. Also, a positive correlation between PET information derived from LNs
and overall relapse has been reported [38]. Our analysis focused primarily on overall
survival, and therefore we could not validate these findings. In the future we will be
able to analyse this outcome as we are currently improving our data collection routines,
to further evaluate other outcomes, not just in terms of overall survival. Nevertheless,
our findings emphasise the importance of analysing FDG-PET signal of metastatic lymph
nodes prior to radiotherapy, which can provide further prognostic power beyond the
classical TNM classification of the disease, which proved not to be prognostic in our
cohort.
Based on the positive and relevant findings we documented, we decided to extend
our analysis in a similar manner to other disease sites, particularly head and neck can-](https://image.slidesharecdn.com/0e20c58a-e59d-4f72-b721-87c0da20639d-160804091812/85/E-book-Thesis-Sara-Carvalho-105-320.jpg)
![CHAPTER 7
106
cer, for which the involvement of the nodes is a well-known prognostic risk factor [39].
Likewise, we are also aiming to analyse other PET tracers, particularly hypoxia markers
(e.g. HX4) and compare the results with FDG uptake [40, 41].
CONCLUSION
In summary, we proved in a large dataset that common SUV descriptors derived from
the metastatic lymph nodes are associated with overall survival in NSCLC patients. Addi-
tionally, PET information has been shown to have higher prognostic value when ex-
tracted from metastatic lymph nodes in comparison to the primary tumour alone, fur-
ther complementing that information.
ACKNOWLEDGMENTS
The authors acknowledge financial support of the QuIC-ConCePT project, which is partly
funded by EFPIA companies and the Innovative Medicine Initiative Joint Undertaking
(IMIJU) under Grant Agreement No. 115151. This research was also funded in part by
the Dutch technology Foundation STW (grant n° 10696 DuCAT), which is the applied
science division of the Netherlands Organisation for Scientific Research (NWO), and the
Technology Programme of the Ministry of Economic Affairs. Authors also acknowledge
the financial support of the CTMM framework (AIRFORCE project, grant 030-103), EU
7th framework programme (EURECA, ARTFORCE - n° 257144, REQUITE - n° 601826),
SME Phase 2 (EU proposal 673780 – RAIL), Kankeronderzoekfonds Limburg from the
Health Foundation Limburg and the Dutch Cancer Society (KWF UM 2008-4210, KWF
UM 2009-4454).](https://image.slidesharecdn.com/0e20c58a-e59d-4f72-b721-87c0da20639d-160804091812/85/E-book-Thesis-Sara-Carvalho-106-320.jpg)
![FDG-PET RADIOMICS OF METASTATIC LYMPH NODES AND PRIMARY TUMOUR IN NSCLC
107
REFERENCES
[1] Dehing-Oberije C, De Ruysscher D, van der Weide H, et al. Tumour volume combined with number of
positive lymph node stations is a more important prognostic factor than TNM stage for survival of non-
small-cell lung cancer patients treated with (chemo)radiotherapy. Int J Radiat Oncol Biol Phys
2008;70(4):1039-44.
[2] De Ruysscher D, Wanders S, van Haren E, et al. Selective mediastinal node irradiation based on FDG-PET
scan data in patients with non-small-cell lung cancer: a prospective clinical study. Int J Radiat Oncol Biol
Phys 2005;62(4):988-94.
[3] Teran MD, Brock MV. Staging lymph node metastases from lung cancer in the mediastinum. J Thorac Dis
2014;6(3):230-6.
[4] Hellwig D, Graeter TP, Ukena D, et al. 18F-FDG PET for mediastinal staging of lung cancer: which SUV
threshold makes sense? J Nucl Med 2007;48(11):1761-6.
[5] Lee AY, Choi SJ, Jung KP, et al. Characteristics of Metastatic Mediastinal Lymph Nodes of Non-Small Cell
Lung Cancer on Preoperative F-18 FDG PET/CT. Nucl Med Mol Imaging 2014;48(1):41-6.
[6] Mirsadraee S, Oswal D, Alizadeh Y, et al. The 7th lung cancer TNM classification and staging system:
Review of the changes and implications. World J Radiol 2012;4(4):128-34.
[7] van Baardwijk A, Bosmans G, Boersma L, et al. PET-CT-based auto-contouring in non-small-cell lung
cancer correlates with pathology and reduces interobserver variability in the delineation of the primary
tumour and involved nodal volumes. Int J Radiat Oncol Biol Phys 2007;68(3):771-8.
[8] Paesmans M, Garcia C, Wong CO, et al. Primary tumour standardised uptake value is prognostic in
nonsmall cell lung cancer: a multivariate pooled analysis of individual data. Eur Respir J 2015; 10.1183/
13993003.00099-2015.
[9] de Groot PM, Carter BW, Betancourt Cuellar SL, et al. Staging of lung cancer. Clin Chest Med 2015;36(2):
179-96, vii-viii.
[10] Lambin P, Rios-Velazquez E, Leijenaar R, et al. Radiomics: extracting more information from medical
images using advanced feature analysis. Eur J Cancer 2012;48(4):441-6.
[11] Lambin P, van Stiphout RG, Starmans MH, et al. Predicting outcomes in radiation oncology--multifactorial
decision support systems. Nat Rev Clin Oncol 2013;10(1):27-40.
[12] Lambin P, Roelofs E, Reymen B, et al. 'Rapid Learning health care in oncology' - an approach towards
decision support systems enabling customised radiotherapy'. Radiother Oncol 2013;109(1):159-64.
[13] Lambin P, Petit SF, Aerts HJ, et al. The ESTRO Breur Lecture 2009. From population to voxel-based radio-
therapy: exploiting intra-tumour and intra-organ heterogeneity for advanced treatment of non-small cell
lung cancer. Radiother Oncol 2010;96(2):145-52.
[14] Lambin P, Zindler J, Vanneste B, et al. Modern clinical research: How rapid learning health care and
cohort multiple randomised clinical trials complement traditional evidence based medicine. Acta Oncol
2015;54(9):1289-300.
[15] Boellaard R, Oyen WJ, Hoekstra CJ, et al. The Netherlands protocol for standardisation and quantification
of FDG whole body PET studies in multi-centre trials. Eur J Nucl Med Mol Imaging 2008;35(12):2320-33.
[16] Schuurbiers OC, Meijer TW, Kaanders JH, et al. Glucose metabolism in NSCLC is histology-specific and
diverges the prognostic potential of 18FDG-PET for adenocarcinoma and squamous cell carcinoma. J
Thorac Oncol 2014;9(10):1485-93.
[17] Aerts HJ, Velazquez ER, Leijenaar RT, et al. Decoding tumour phenotype by noninvasive imaging using a
quantitative radiomics approach. Nat Commun 2014;5:4006.
[18] Carvalho S, Leijenaar RT, Velazquez ER, et al. Prognostic value of metabolic metrics extracted from
baseline positron emission tomography images in non-small cell lung cancer. Acta Oncol 2013;52(7):
1398-404.
[19] Leijenaar RT, Carvalho S, Velazquez ER, et al. Stability of FDG-PET Radiomics features: an integrated
analysis of test-retest and inter-observer variability. Acta Oncol 2013;52(7):1391-7.](https://image.slidesharecdn.com/0e20c58a-e59d-4f72-b721-87c0da20639d-160804091812/85/E-book-Thesis-Sara-Carvalho-107-320.jpg)
![CHAPTER 7
108
[20] Leijenaar RT, Nalbantov G, Carvalho S, et al. The effect of SUV discretization in quantitative FDG-PET
Radiomics: the need for standardized methodology in tumour texture analysis. Sci Rep 2015;5:11075.
[21] Coroller TP, Grossmann P, Hou Y, et al. CT-based radiomic signature predicts distant metastasis in lung
adenocarcinoma. Radiother Oncol 2015;114(3):345-50.
[22] Deasy JO, Blanco AI, Clark VH. CERR: a computational environment for radiotherapy research. Med Phys
2003;30(5):979-85.
[23] Tibshirani R. The lasso method for variable selection in the Cox model. Stat Med 1997;16(4):385-95.
[24] Burnham KP, Anderson DR. Multimodel Inference: Understanding AIC and BIC in Model Selection. Socio-
logical methods and research 2004;33:261-304.
[25] Harrell FE, Jr., Lee KL, Mark DB. Multivariable prognostic models: issues in developing models, evaluating
assumptions and adequacy, and measuring and reducing errors. Stat Med 1996;15(4):361-87.
[26] Royston P, Altman DG. External validation of a Cox prognostic model: principles and methods. BMC Med
Res Methodol 2013;13:33.
[27] Team RC. R: A language and environment for statistical computing. In. R Foundation for Statistical Com-
puting. 2.15.2 ed; 2015.
[28] Rao SX, Lambregts DM, Schnerr RS, et al. Whole-liver CT texture analysis in colorectal cancer: Does the
presence of liver metastases affect the texture of the remaining liver? United European Gastroenterol J
2014;2(6):530-8.
[29] Zhang H, Graham CM, Elci O, et al. Locally advanced squamous cell carcinoma of the head and neck: CT
texture and histogram analysis allow independent prediction of overall survival in patients treated with
induction chemotherapy. Radiology 2013;269(3):801-9.
[30] Paesmans M, Garcia C, Wong CY, et al. Primary tumour standardised uptake value is prognostic in nonsmall
cell lung cancer: a multivariate pooled analysis of individual data. Eur Respir J 2015;46(6):1751-61.
[31] Dehing-Oberije C, Yu S, De Ruysscher D, et al. Development and external validation of prognostic model
for 2-year survival of non-small-cell lung cancer patients treated with chemoradiotherapy. Int J Radiat
Oncol Biol Phys 2009;74(2):355-62.
[32] Wang Y, Ma S, Dong M, et al. Evaluation of the factors affecting the maximum standardized uptake value
of metastatic lymph nodes in different histological types of non-small cell lung cancer on PET-CT. BMC
Pulm Med 2015;15:20.
[33] Cook GJ, Yip C, Siddique M, et al. Are pretreatment 18F-FDG PET tumour textural features in non-small
cell lung cancer associated with response and survival after chemoradiotherapy? J Nucl Med 2013;54(1):
19-26.
[34] Hatt M, Majdoub M, Vallieres M, et al. 18F-FDG PET uptake characterization through texture analysis:
investigating the complementary nature of heterogeneity and functional tumour volume in a multi-
cancer site patient cohort. J Nucl Med 2015;56(1):38-44.
[35] Toll DB, Janssen KJ, Vergouwe Y, et al. Validation, updating and impact of clinical prediction rules: a
review. J Clin Epidemiol 2008;61(11):1085-94.
[36] Oberije C, Nalbantov G, Dekker A, et al. A prospective study comparing the predictions of doctors versus
models for treatment outcome of lung cancer patients: a step toward individualized care and shared de-
cision making. Radiother Oncol 2014;112(1):37-43.
[37] Markovina S, Duan F, Snyder BS, et al. Regional Lymph Node Uptake of [(18)F]Fluorodeoxyglucose After
Definitive Chemoradiation Therapy Predicts Local-Regional Failure of Locally Advanced Non-Small Cell
Lung Cancer: Results of ACRIN 6668/RTOG 0235. (1879-355X (Electronic)).
[38] Li H, Becker N, Raman S, et al. The value of nodal information in predicting lung cancer relapse using
4DPET/4DCT. Med Phys 2015;42(8):4727-33.
[39] Prabhu RS, Hanasoge S, Magliocca KR, et al. Lymph node ratio influence on risk of head and neck cancer
locoregional recurrence after initial surgical resection: implications for adjuvant therapy. Head Neck
2015;37(6):777-82.
[40] Zegers CM, van Elmpt W, Reymen B, et al. In vivo quantification of hypoxic and metabolic status of
NSCLC tumours using [18F]HX4 and [18F]FDG-PET/CT imaging. Clin Cancer Res 2014;20(24):6389-97.](https://image.slidesharecdn.com/0e20c58a-e59d-4f72-b721-87c0da20639d-160804091812/85/E-book-Thesis-Sara-Carvalho-108-320.jpg)
![FDG-PET RADIOMICS OF METASTATIC LYMPH NODES AND PRIMARY TUMOUR IN NSCLC
109
[41] Pettersen EO, Ebbesen P, Gieling RG, et al. Targeting tumour hypoxia to prevent cancer metastasis. From
biology, biosensing and technology to drug development: the METOXIA consortium. J Enzyme Inhib Med
Chem 2015;30(5):689-721.](https://image.slidesharecdn.com/0e20c58a-e59d-4f72-b721-87c0da20639d-160804091812/85/E-book-Thesis-Sara-Carvalho-109-320.jpg)
![CHAPTER 7
110
APPENDIX 1
This appendix presents a methodology conducted for feature pre-selection for both
primary tumour (tumour) and metastatic lymph nodes (LN), and corresponding results
and interpretation.
Robust and stable 18
F-fluorodeoxyglucose (FDG) Positron Emission Tomography
(PET) Radiomics features of the primary tumour were selected from a test-retest and
inter-observer analysis, using an intraclass correlation coefficient (ICC) analysis [1]. De-
tails of the methodology and corresponding results are presented elsewhere [2]. Fea-
tures presenting an intraclass correlation coefficient (ICC) over 0.85 in both test-retest
and multiple observer settings were defined as robust. The selection procedure resulted
in a total of 77 features.
Metastatic lymph nodes were analysed as a single structure combining all the indi-
vidual metastatic LN stations. We further assessed how feature values extracted from
this merged structure (LNmerged) compared to values from the largest (LNvolume) or
most active LN (LNmax), regardless of the corresponding lymph node station. To this
end, we randomly selected a subgroup of 88 patients (34%) of the 262 patients in the
derivation dataset with lymphadenopathy and identified LNvolume and LNmax, from
which the robust and stable PET Radiomics were extracted. These same features were
then derived from the radiotherapy planning structure comprising the total nodal vol-
ume (LNmerged). The intraclass correlation coefficient (ICC) was calculated between
features extracted from LNvolume and LNmerged (A), as well as between features ex-
tracted from LNmax and LNmerged (B). The ICC is based on the analysis of variance and
assumes values between 0 and 1, and were further adjusted as by Spearman-Brown, to
reflect the means of the different ratters – ICC(1,k)[1]. The ICC can be large only if there
is no bias and the paired measurements are in close agreement. Hence, we extended
comparisons A and B with a 95% limit of agreement (LoA), based on the methods of
Bland and Altman [3, 4].
The largest and most active LN was the same for 55 out of the 88 (62.5%) patients in
the sub-analysis. For LNvolume and LNmerged, 37 out of the 77 features yielded an
ICC(1,k) over 0.85 and a LoA within the ±10% interval, while for LNmax and LNmerged
this number decreased to 26 features (Table 1), that were condensed in combination
into 12 common features between structures. This analysis followed the aim to capture
the independent contributions of each independent node in a single feature value,
which varies among patients. Some of the derived features are dependent on the Re-
gion-of-interest (ROI), that when comprising more than a single independent lymph
node, may influence its value. For this reason, we aimed to identify features that, ex-
tracted from a single structure, would be comparable if extracted from the largest or
most active LN, improving its interpretability. In addition to these features, we included
maximum and peak SUV as well as total LN volume and tumour load in the multivariable
modelling, following the univariable evidence that a single high uptake region and LN](https://image.slidesharecdn.com/0e20c58a-e59d-4f72-b721-87c0da20639d-160804091812/85/E-book-Thesis-Sara-Carvalho-110-320.jpg)
![FDG-PET RADIOMICS OF METASTATIC LYMPH NODES AND PRIMARY TUMOUR IN NSCLC
111
volume are prognostic factors (Table 3 in main text), even though these metrics were
not gathered from the largest node, but were, obviously, from the most active one.
In summary, a total of 77 stable and robust features from the primary tumour and
16 for LNmerged, were selected for further analysis following the rationale described.
Table 1 – Number of PET features with an ICC(1,k) over 0.85 and within a ±10% LoA interval as derived from
the largest (LNvolume) or more active node (LNmax) and merged structure (LNmerged), for the different
groups of features. Stable and robust features were identified previously, which results may be shown be-
tween brackets in the header of each sub-category.
Structure Statistics
(13/16)
Shape
(9/13)
RLGL
(8/11)
GLCM
(10/22)
GLSZM
(1/11)
IVH
(36/45)
Total
(77/118)
LNvolume 5 1 6 4 0 21 37
LNmax 8 1 6 7 0 4 26
Acronyms: RLGL – run-length grey level; GLCM – grey level co-occurrence; GLSZM – grey level size zone matri-
ces; IVH – intensity-volume histograms.
REFERENCES
[1] Shrout PE, Fleiss JL. Intraclass correlations: uses in assessing rater reliability. Psychol Bull 1979;86(2):420-
8.
[2] Leijenaar RT, Carvalho S, Velazquez ER, et al. Stability of FDG-PET Radiomics features: an integrated
analysis of test-retest and inter-observer variability. Acta Oncol 2013;52(7):1391-7.
[3] Bland JM, Altman DG. Statistical methods for assessing agreement between two methods of clinical
measurement. Lancet 1986;1(8476):307-10.
[4] Dewitte K Fau - Fierens C, Fierens C Fau - Stockl D, Stockl D Fau - Thienpont LM, et al. Application of the
Bland-Altman plot for interpretation of method-comparison studies: a critical investigation of its prac-
tice. (0009-9147 (Print)).](https://image.slidesharecdn.com/0e20c58a-e59d-4f72-b721-87c0da20639d-160804091812/85/E-book-Thesis-Sara-Carvalho-111-320.jpg)
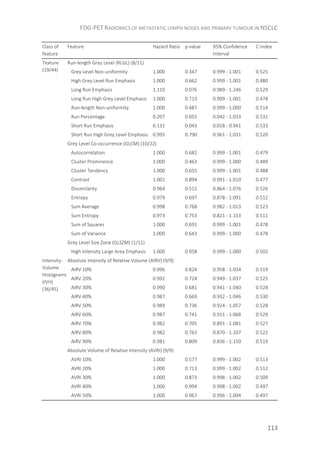
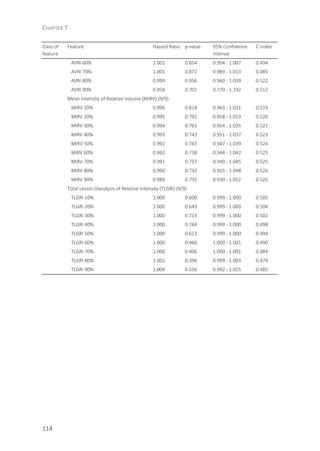
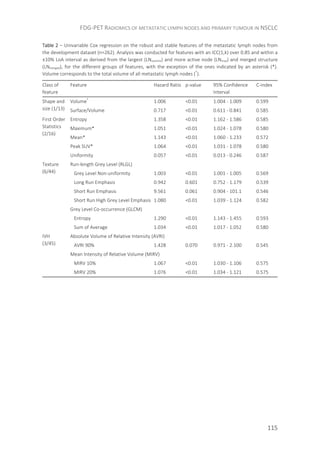
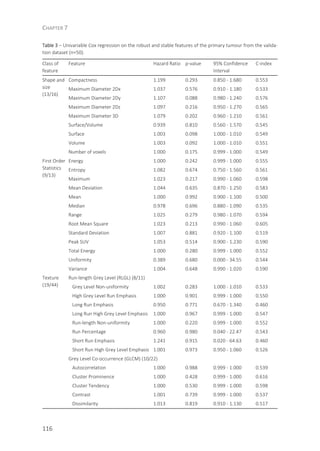
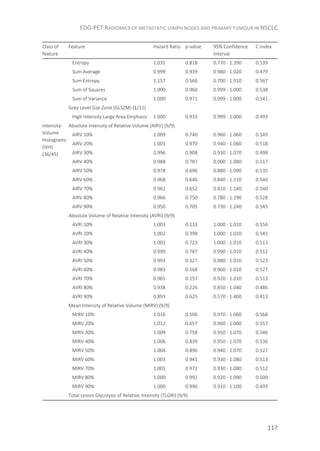
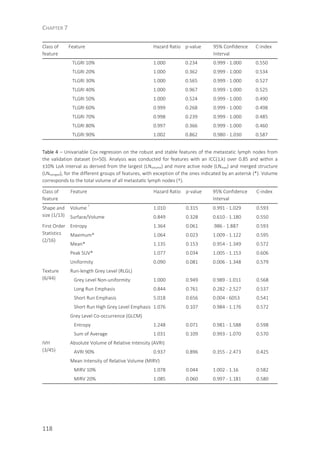
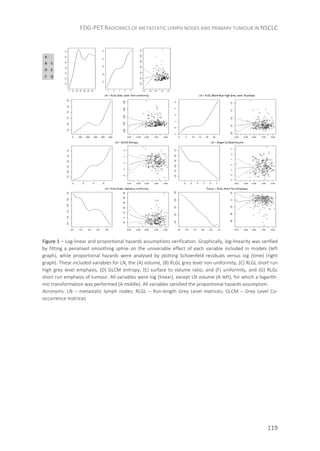

![CHAPTER 8
122
ABSTRACT
Background
Improve the prognostic prediction of clinical variables for non-small cell lung cancer
(NSCLC), by selecting from blood-biomarkers, non-invasively describing hypoxia, in-
flammation and tumour load.
Methods
Model development and validation included 182 and 181 inoperable stage I-IIIB NSCLC
patients treated radically with radiotherapy (55.2%) or chemo-radiotherapy (44.8%).
Least absolute shrinkage and selection operator (LASSO), selected from blood-
biomarkers related to hypoxia [osteopontin (OPN) and carbonic anhydrase IX (CA-IX)],
inflammation [interleukin-6 (IL-6), IL-8, and C-reactive protein (CRP)], and tumour load
[carcinoembryonic antigen (CEA), and cytokeratin fragment 21-1 (Cyfra 21-1)]. Sequent
model extension selected from alpha-2-macroglobulin (a2M), serum interleukin-2 re-
ceptor (sIL2r), toll-like receptor 4 (TLR4), and vascular endothelial growth factor (VEGF).
Discrimination was reported by concordance-index.
Results
OPN and Cyfra 21-1 (hazard ratios of 3.3 and 1.7) significantly improved a clinical model
comprising gender, World Health Organization performance-status, forced expiratory
volume in 1 s, number of positive lymph node stations, and gross tumour volume, from
a concordance-index of 0.66 to 0.70 (validation = 0.62 and 0.66). Extension of the vali-
dated model yielded a concordance-index of 0.67, including a2M, sIL2r and VEGF (haz-
ard ratios of 4.6, 3.1, and 1.4).
Conclusion
Improvement of a clinical model including hypoxia and tumour load blood-biomarkers
was validated. New immunological markers were associated with overall survival. Data
and models can be found at www.cancerdata.org (http://dx.doi.org/10.17195/candat.
2016.04.1) and www.predictcancer.org.](https://image.slidesharecdn.com/0e20c58a-e59d-4f72-b721-87c0da20639d-160804091812/85/E-book-Thesis-Sara-Carvalho-122-320.jpg)
![PROGNOSTIC VALUE OF BLOOD-BIOMARKERS IN NSCLC
123
INTRODUCTION
In the last three decades, lung cancer has been the leading cause of cancer deaths [1].
To increase the survival of lung cancer patients, we have witnessed an improvement of
radiotherapy techniques and more effective (chemo)radiotherapy schemes (i.e., intro-
duction of concurrent treatment) [2-4]. Attempts have been made to develop more
accurate risk stratification for non-small cell lung cancer (NSCLC) patients, which would
lead to more tailored, individualised and personalised care, avoiding over or under-
treatment, by means of a radiation oncology based on multifactorial Decision Support
Systems [5, 6]. Therefore, the investigation of new prognostic parameters derived from,
but not limited to, anatomic, molecular and functional imaging, genomics, and prote-
omics is warranted [7-9].
The analysis of biomarkers, including proteins, is a fast-developing, promising and
challenging area of research, permitting the prediction or description of the evolution of
normal biological processes, pathogenic processes, or pharmacological responses to a
therapeutic intervention [10]. Oncoproteins are produced by tumour cells or in re-
sponse to their presence, and may be released into the bloodstream of cancer patients.
As tissue sampling is often not possible in lung cancer patients, blood sample collection
by venipuncture is an attractive alternative, which is safe and easy to implement [10].
Blood-biomarkers reflect dissimilarities of the tumour microenvironment, are linked to
disease prognosis and response to treatment. Blood-biomarkers, that can be measured
in daily clinical practice and have been shown to be associated with treatment outcome
were first identified in studies comprising large datasets. Based on this criterion, those
which biological functions are related to processes of hypoxia [osteopontin (OPN) and
carbonic anhydrase IX (CA-IX)]; inflammation [interleukin 6 (IL-6), IL-8, and C-reactive
protein (CRP)], and tumour load [carcinoembryonic antigen (CEA) and cytokeratin frag-
ment (CYFRA 21-1)], were analysed and externally validated [11-25]. As an exploratory
step we investigated additional blood-biomarkers, including those related to immuno-
logical response, which could therefore be incorporated into immunotherapy assess-
ment studies: alpha-2-macroglobulin (α2M), serum IL-2 receptor (sIL2R), toll-like recep-
tor 4 (TLR4), and vascular endothelial growth factor (VEGF) [14, 26-35].
PATIENTS AND METHODS
Development dataset
The development cohort included 195 stage I-IIIb NSCLC patients treated with
(chemo)radiotherapy between October 2003 and October 2008. Clinical data and blood
samples were prospectively collected to ensure standardisation. Exclusion criteria in-
cluded surgery or palliative treatment, and insufficient material to perform blood](https://image.slidesharecdn.com/0e20c58a-e59d-4f72-b721-87c0da20639d-160804091812/85/E-book-Thesis-Sara-Carvalho-123-320.jpg)
![CHAPTER 8
124
measurements (OPN, CA-IX, IL-6, IL-8, CRP, CEA, and CYFRA 21-1). All patients partici-
pated in the Biobank project (Clinical trials.gov identifiers: NCT00181519,
NCT00573040, and NCT00572325) launched in 2003, and provided written informed
consent. One hundred and eighty-two patients were treated according to dissimilar
radiotherapy (RT) regimens, with a minimum dose of 50Gy:
1. Forty-nine patients (26.8%) received the standard external beam radiation therapy
(EBRT) protocol used until August 2005, of either 70 Gy (Stage I–II) or 60 Gy after in-
duction chemotherapy (Stage III) in once-daily fractions of 2 Gy.
2. One hundred and one patients (55.2%) were treated with EBRT only according to
the protocol as of August 2005, with an individualised dose delivered in fractions of
1.8 Gy twice daily, until normal tissue dose constraints were met (e.g., mean lung
dose, or maximum dose to the spinal cord) [36].
3. Thirty-three patients (18%) received concurrent (chemo)radiotherapy with a total
dose of 45 Gy, delivered in fractions of 1.5 Gy twice daily, followed by an individual-
ised dose of 8 to 24 Gy delivered in fractions of 2.0 Gy once daily, again limited by
the dose to surrounding organs at risk [37].
Validation dataset
The validation cohort consisted of 200 NSCLC patients with same characteristics as the
development cohort, treated between March 2007 and September 2013. Measure-
ments included the above mentioned blood-biomarkers plus VEGF, α2M, TLR4 and
sIL2R (Clinicaltrials.gov identifier: NCT01936571). One hundred and eighty-one patients
received a minimum dose of 50 Gy and were treated as follows:
1. Sixty-eight patients (37.6%) received radiotherapy alone according to the protocol
as of August 2005, with an individualised total dose delivered in fractions of 1.8 Gy
twice daily, limited by the mean lung dose or the spinal cord dose [36].
2. One hundred and one patients (55.8%) received concurrent chemo-radiotherapy
scheme for a prescribed dose of 45 Gy, followed by an individualised dose ranging
from 8 to 24 Gy, delivered in fractions of 2.0 Gy once daily, again limited by the dose
to surrounding organs at risk [37].
3. Twelve patients (6.6%) followed the Phase II Positron Emission Tomography (PET)
boost trial (clinicaltrals.gov identifier NCT01024829), in which a dose escalation pro-
tocol was based on the Fluorine-18-Fluorodeoxyglucose distribution of the PET
scans [38].](https://image.slidesharecdn.com/0e20c58a-e59d-4f72-b721-87c0da20639d-160804091812/85/E-book-Thesis-Sara-Carvalho-124-320.jpg)
![PROGNOSTIC VALUE OF BLOOD-BIOMARKERS IN NSCLC
125
Radiation treatment
Patients were irradiated in accordance with local protocols and stage of the disease. No
elective nodal irradiation was performed and irradiation was delivered 5 days a week
[39]. Radiotherapy planning was performed on a XiO system (Computerised Medical
Systems) until July 2012, using a convolution–superposition algorithm with inhomoge-
neity corrections and according to International Commission on Radiation Units &
Measurements 50 guidelines. As of July 2012, radiotherapy planning was performed
using RapidArc (Eclipse version 11.0), with a type B dose calculation algorithm (Acu-
rosXB-10.0).
Endpoint
Study endpoint was overall survival (OS) calculated from start of RT until the date of
death or last follow-up. Survival information was retrieved from “Gemeentelijke Basis
Administratie” (GBA), the decentralised population registration system in the Nether-
lands. A patient who was alive at the end of the study was considered right-censored.
Blood-biomarker measurement
Blood-biomarkers measurements of the development dataset can be found elsewhere
[40]. Measurements of the validation cohort were performed in a certified laboratory,
using commercially available kits, in order to easily translate the results into clinical
practice. For each patient, 3 aliquots of 0.5ml of serum and 3 aliquots of 1.5 ml of plas-
ma were available, which had been collected before the first fraction of radiotherapy,
processed using standard protocols and finally stored in the institutional biobank.
Measurements in plasma were performed using enzyme-linked immunosorbent assays
for OPN (Quantikine Human Osteopontin Immuno assay; R&D Systems, Minneapolis,
MN), CA-IX (Nuclea Diagnostics, Cambridge, MA), VEGF (R&D Systems), and TLR4
(MyBioSource, San Diego, CA). Measurements in serum for IL-6 and IL-8 were deter-
mined on Immulite XPi 2000 with a solid phase, enzyme labelled, chemoluminescence
sequential immunometric assay (Siemens Medical Solutions Diagnostics, LA), for CRP on
Cobas 8000 using an immunoturbimetric assay (Roche Diagnostics, Mannheim, Germa-
ny), for CEA on Immulite XPi using a solid-phase, two-site sequential chemoluminescent
immunometric assay (Siemens Medical Solutions Diagnostics), for CYFRA 21-1 on Kryp-
tor with a sandwich immuno-fluorescent assay (Brahms, ThermoFisher, Hennigsdorf,
Germany), for α2M on BN ProSpec using immunonephelometric assays (Siemens Medi-
cal Solutions Diagnostics, LA, USA), and for sIL2R using an enzyme-linked immuno-
sorbent assay (Diaclone, Basancon Cedex, France).](https://image.slidesharecdn.com/0e20c58a-e59d-4f72-b721-87c0da20639d-160804091812/85/E-book-Thesis-Sara-Carvalho-125-320.jpg)
![CHAPTER 8
126
The analytes OPN, CA-IX, VEGF and TLR4 were assayed in plasma in duplicate using a
Victor multilabel counter (Perkinelmer, Turku, Finland), while all other biomarkers were
measured in singletons.
Descriptive statistics
Comparison of the development and validation datasets distributions was performed
using a χ2 test for categorical variables and a Student t-test for the continuous ones.
Prior to this a variable transformation on the gross tumour volume (GTV) and blood
biomarker measurements were performed, using a logarithmic approach. Missing data
imputation was performed by Multivariate Imputation by Chained Equations (MICE).
Correlation analysis was performed between clinical and blood-biomarker variables
under analysis for both datasets.
Model development
A Cox proportional hazards model was developed and included validated clinical varia-
bles: gender, World Health Organization performance status (WHO-PS), forced expira-
tory volume in one second (FEV1s), number of positive lymph node stations identified in
the diagnostic PET scans (lymph nodes) and GTV, defined as the sum of the GTV of the
primary tumour and metastatic lymph nodes [41]. A least absolute shrinkage and selec-
tion operator (LASSO) method was applied for feature selection of the blood-
biomarkers, entered as continuous variables into the model. LASSO selects variables
correlated to the measured outcome by shrinking coefficients weights, down to zero for
the ones not correlated to outcome [42]. Regression coefficients were estimated, using
the whole dataset, hazard ratios (HR) and confidence intervals (CI) were calculated.
Schoenfeld residuals were used to check the proportional hazards assumption. Discrim-
ination, reflecting a correct ordering of the relative predictions with respect to true
outcomes (i.e. overall survival) for individuals, and model’s ability to distinguish be-
tween individuals who experience the outcome from those who remained event free,
was determined by the Harrell’s concordance-index (c-index). This ranges from 0.5, no
discrimination (no greater than the chance expectation) to 1 indicating perfect discrimi-
nation.
External Model validation
Calibration of the model, which refers to the agreement between observed and pre-
dicted probabilities, was visually assessed (further details in the appendix). Discrimina-
tion ability of the model was also determined by the Harrell’s c-index in an independent
dataset.](https://image.slidesharecdn.com/0e20c58a-e59d-4f72-b721-87c0da20639d-160804091812/85/E-book-Thesis-Sara-Carvalho-126-320.jpg)
![PROGNOSTIC VALUE OF BLOOD-BIOMARKERS IN NSCLC
127
Model updating
The prognostic index (PI) was computed by multiplying the covariates with the estimat-
ed coefficients on the validation dataset: = ∑ . The validated model was ex-
tended by inputting the PI (recalibrated if necessary) as a fixed variable and further
selecting among new proposed blood-biomarkers. Performance was evaluated by
means of an internal 10-fold CV c-index (further details in the appendix). A log likelihood
test of model fit was conducted between the validated and extended model.
All statistical methods were performed in R (version 2.15.2), using the libraries sur-
vcomp, survival, rms, glmnet and corrplot [43].
RESULTS
Upon analysis, 161 and 132 patients in the derivation and validation cohorts, respec-
tively, had died, and median follow-up time was 8.2 (95% CI: 7.3 – 9.3) and 3.6 years
(95% CI: 3.2 – 4.6). Kaplan Meier plots of the overall survival for both datasets are
shown in Figure 1. Patient characteristics and blood biomarker measurements are
shown in Table 1 and Table 2, including the missing measurements count. Homogeneity
tests on the blood-biomarkers measures reflect the small differences that could be
observed between development and validation datasets, for which a non-significant p-
value could be demonstrated. The exception to this lies on IL-8, that was significantly
higher in the validation dataset, with, however, a non-drastically higher median. The
highest Pearson correlation was 0.61 between IL-6 and CRP in the development dataset
(r=0.72 in the validation dataset). Correlation between clinical features and blood-
biomarkers was lower than 0.5 for all comparisons, demonstrating that these variables
provide complementary information (Figure 2). Radiotherapy administered doses ac-
cording to regimen up to August 2005 had an HR=0.17 (p<0.01), while the one after-
wards had an HR=0.90 (p=0.52). Concurrent scheme presented with an HR=0.62
(p=0.03). Administered dose had a risk of 0.98 (p=0.03).](https://image.slidesharecdn.com/0e20c58a-e59d-4f72-b721-87c0da20639d-160804091812/85/E-book-Thesis-Sara-Carvalho-127-320.jpg)
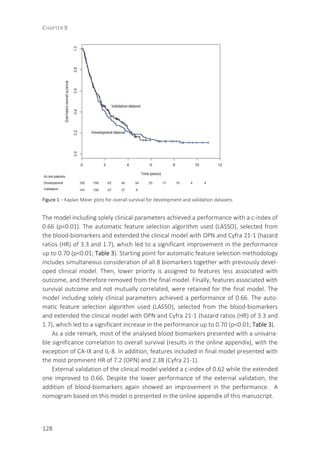
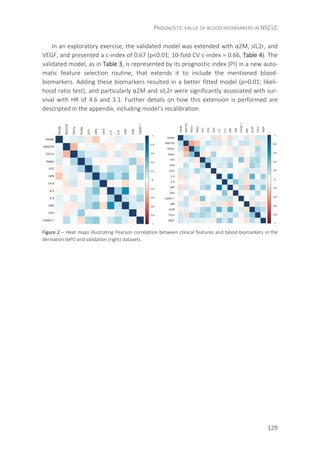
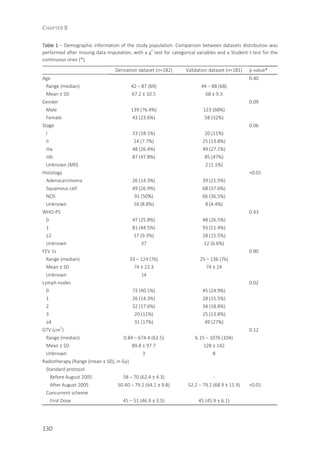
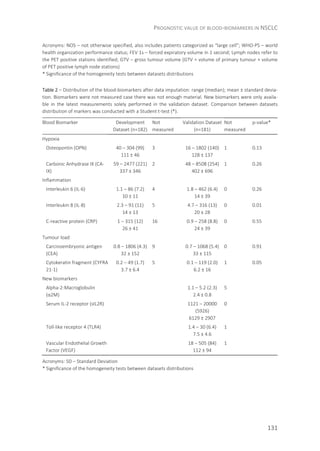
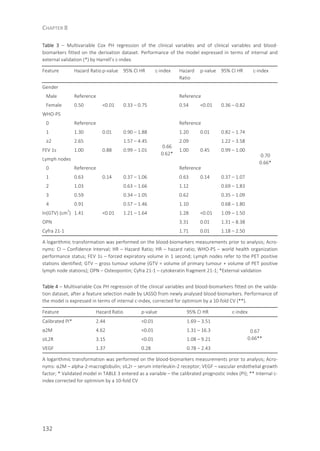
![PROGNOSTIC VALUE OF BLOOD-BIOMARKERS IN NSCLC
133
DISCUSSION
Prognostic modelling of NSCLC is becoming an important element of the disease man-
agement. Several sources of information now available make it an emerging and con-
stantly changing field, however the choice for non-invasive techniques is preferred in
order to diminish the burden for patients. The use of blood-biomarker measurements
appears to be a non-invasive, fast and promising source of extra information, reflecting
dissimilarities of the tumour microenvironment that has been shown to be associated
with disease prognosis and response to treatment [44, 45].
We demonstrated and validated in two large cohorts of NSCLC patients the added
value of blood-biomarkers related to hypoxia (OPN) and tumour load (Cyfra 21-1), re-
flected by a statistically significant improvement in the performance of a clinical model
after their inclusion. A priori selection of blood-biomarkers was based on a literature
search and evidence of their prognostic value for NSCLC [11-25]. Hypoxia affects malig-
nant progression by increasing the tumour’s metastatic ability and diminishing the
apoptotic potential, and also the response to therapy, by decreasing the effects of anti-
cancer therapies including (chemo)radiotherapy [44]. In addition, imaging studies with
hypoxia-specific markers have shown that hypoxia is a prevalent effect in NSCLC [46].
The hypoxia marker OPN, has also been associated with tumour aggressiveness and
metastatic potential, accompanying a poor prognosis in NSCLC, confirmed rather
strongly in our study (HR=3.3) [19, 20]. Tumour load is often associated with disease
development and prognosis [41, 47]. Cyfra 21-1, a marker associated with tumour load,
was previously identified as a prognostic factor for NSCLC, which was also confirmed in
our analysis [48].
We have already investigated the prognostic potential of blood-biomarkers using a
support vector machine (SVM) for model development. We then extended a validated
2-year survival clinical model with blood-biomarkers related to inflammation (IL-6) and
tumour load (CEA). Performance expressed as the area under the curve (AUC) improved
from 0.72 (solely clinical parameters) to 0.81 [40, 41]. However, the limited number of
patients included in the study made it difficult to draw definitive conclusions. Moreover,
SVM is less suited to a time-to-event analysis, as it requires dichotomous outcome.
Therefore, we re-analysed the data, applying Cox regression. In the newly fitted clinical
model, moderately good performance (0.66, external = 0.62) could be achieved with
female gender which is associated with a better prognosis, given the lower risk
(HR=0.50), while WHO-PS ≥ 2 (HR=2.65) and larger GTV (HR=1.41) are worse prognostic
factors.
The validated model was extended to include α2M, sIL2r, and VEGF. Despite the com-
parable c-index (0.67; 10-fold CV = 0.66), most importantly it showed that higher concen-
trations of these new markers are associated with a worse prognosis, particularly α2M
and sIL2r with HRs of 4.6 and 3.1. Previous studies showed α2M as a top candidate for
radiation pneumonitis [31]. We further confirmed its prognostic potential for NSCLC. IL-2](https://image.slidesharecdn.com/0e20c58a-e59d-4f72-b721-87c0da20639d-160804091812/85/E-book-Thesis-Sara-Carvalho-133-320.jpg)
![CHAPTER 8
134
was already identified as an independent prognostic marker in patients with advanced
NSCLC [49]. Its cell surface receptor, a soluble form of IL-2 receptor (sIL2r) is released into
the bloodstream and involved in the regulation of IL-2. High sIL2r levels were associated
with shorter survival in an advanced stage [50, 51]. Elevated levels of sIL2r may lead to a
decreased cellular response to IL-2, reinforcing the importance of measuring this marker
for patients receiving IL-2 immunotherapy [51-53]. VEGF, also included in the final model
with a less expressive HR of 1.4, is a common angiogenesis factor for a variety of solid
tumours, including NSCLC [54]. It has been shown previously to be an independent prog-
nostic factor, which was not however confirmed by our data [14].
An advantage of our study is the large number of patients available, making the
derived message a more solid one. Conversely, this study had some limitations. First, it
was impossible to validate our latest findings using the newer biomarkers as these were
only measured in the validation dataset. This should be thoroughly considered in the
future, by gathering data from external institute(s). The heterogeneity of our dataset,
including more recently treated patients following concurrent schemes in the validation
dataset, the different types and scheduling of chemotherapy, and the different labora-
tories involved in the biomarkers measurements may provide us to a better under-
standing of the derived calibration slope, which is below 1 [55]. However, the c-index
achieved in the context of a prognostic analysis must not be disregarded, particularly
when compared with the limited capacity of humans to infer better prognosis from the
same sources of information [7]. Also due to its great heterogeneity, it is not possible
with this cohort to assess stage-specific treatment variables. We are however able to
deliver a set of prognostic factors, independent of dissimilar types of treatment or dis-
ease stage, but spanning a larger cohort of heterogeneous patients. This model could
be improved by including other sources of information, for example imaging (Radi-
omics), as the relevant prognostic value of sophisticated image analysis has been
shown, to be investigated in the future [8, 9]. One last point that we would like to em-
phasise is the increasing number of PET tracers currently available and the ability to
obtain extra information, in particular relating to hypoxia (18
F-FMISO, 18
F-FAZA and 18
F-
HX4), tumour proliferation (18F-fluorothymidine), and assessment of epidermal growth
factor receptor (EGFR) [56-58]. The potential use of blood-biomarkers to predict which
imaging tracer is best suited to an individual patient, would convert prognostic markers
into predictive information and increase the cost effectiveness of imaging procedures,
while diminishing patient burden from extensive diagnostic imaging procedures.
In conclusion, we improved a clinical model by the inclusion of blood-biomarkers re-
lated to hypoxia and tumour load. This improvement was validated externally, which rein-
forces its potential relevance for shared decision-making. An extended model demon-
strated that higher concentrations of the inflammation marker α2M and immunological
marker sIL2r have strong negative prognostic value for NSCLC, which requires extra valida-
tion. Data is publicly available at www.cancerdata.org (http://dx.doi.org/10.17195/candat.
2016.04.1) and the developed models can be found at www.predictcancer.org.](https://image.slidesharecdn.com/0e20c58a-e59d-4f72-b721-87c0da20639d-160804091812/85/E-book-Thesis-Sara-Carvalho-134-320.jpg)
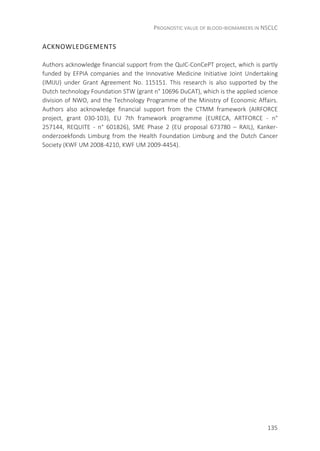
![CHAPTER 8
136
REFERENCES
[1] Torre LA, Siegel RL, Ward EM, Jemal A. Global Cancer Incidence and Mortality Rates and Trends-An
Update. Cancer Epidemiol Biomarkers Prev. 2016;25 (1):16-25.
[2] Dingemans AM, Bootsma G, van Baardwijk A, Reymen B, Wanders R, Brans B, et al. A phase I study of
concurrent individualized, isotoxic accelerated radiotherapy and cisplatin-vinorelbine-cetuximab in pa-
tients with stage III non-small-cell lung cancer. J Thorac Oncol. 2014;9:710-6.
[3] De Ruysscher D, van Baardwijk A, Steevens J, Botterweck A, Bosmans G, Reymen B, et al. Individualised
isotoxic accelerated radiotherapy and chemotherapy are associated with improved long-term survival of
patients with stage III NSCLC: a prospective population-based study. Radiother Oncol. 2012;102:228-33.
[4] De Ruysscher D, Wanders R, van Baardwijk A, Dingemans AM, Reymen B, Houben R, et al. Radical treat-
ment of non-small-cell lung cancer patients with synchronous oligometastases: long-term results of a
prospective phase II trial (Nct01282450). J Thorac Oncol. 2012;7:1547-55.
[5] Lambin P, Roelofs E Fau - Reymen B, Reymen B Fau - Velazquez ER, Velazquez Er Fau - Buijsen J, Buijsen J
Fau - Zegers CML, Zegers Cm Fau - Carvalho S, et al. 'Rapid Learning health care in oncology' - an ap-
proach towards decision support systems enabling customised radiotherapy'. Radiother Oncol.
2013;109(1):159-64.
[6] Lambin P, van Stiphout Rg Fau - Starmans MHW, Starmans Mh Fau - Rios-Velazquez E, Rios-Velazquez E
Fau - Nalbantov G, Nalbantov G Fau - Aerts HJWL, Aerts Hj Fau - Roelofs E, et al. Predicting outcomes in
radiation oncology--multifactorial decision support systems. Nature reviews Clinical oncology.
2013;10(1):27-40.
[7] Oberije C, Nalbantov G, Dekker A, Boersma L, Borger J, Reymen B, et al. A prospective study comparing
the predictions of doctors versus models for treatment outcome of lung cancer patients: a step toward
individualized care and shared decision making. Radiother Oncol. 2014;112:37-43.
[8] Lambin P, Rios-Velazquez E, Leijenaar R, Carvalho S, van Stiphout RG, Granton P, et al. Radiomics: ex-
tracting more information from medical images using advanced feature analysis. Eur J Cancer.
2012;48:441-6.
[9] Aerts HJ, Velazquez ER, Leijenaar RT, Parmar C, Grossmann P, Carvalho S, et al. Decoding tumour pheno-
type by noninvasive imaging using a quantitative radiomics approach. Nat Commun. 2014;5:4006.
[10] Sozzi G, Boeri M. Potential biomarkers for lung cancer screening. Transl Lung Cancer Res. 2014;3(3):139-48.
[11] Donati V, Boldrini L, Dell'Omodarme M, Prati MC, Faviana P, Camacci T, et al. Osteopontin expression
and prognostic significance in non-small cell lung cancer. Clin Cancer Res. 2005;11:6459-65.
[12] Fiala O, Pesek M, Finek J, Topolcan O, Racek J, Minarik M, et al. High serum level of C-reactive protein is
associated with worse outcome of patients with advanced-stage NSCLC treated with erlotinib. Tumour
Biol. 2015;36(12):9215-22.
[13] Mendes F, Antunes C, Abrantes AM, Goncalves AC, Nobre-Gois I, Sarmento AB, et al. Lung cancer: the
immune system and radiation. Br J Biomed Sci. 2015;72:78-84.
[14] Ostheimer C, Bache M, Guttler A, Kotzsch M, Vordermark D. A pilot study on potential plasma hypoxia
markers in the radiotherapy of non-small cell lung cancer. Osteopontin, carbonic anhydrase IX and vas-
cular endothelial growth factor. Strahlenther Onkol. 2014;190:276-82.
[15] Rud AK, Boye K, Oijordsbakken M, Lund-Iversen M, Halvorsen AR, Solberg SK, et al. Osteopontin is a
prognostic biomarker in non-small cell lung cancer. BMC Cancer. 2013;13:540.
[16] Sanmamed MF, Carranza-Rua O, Alfaro C, Onate C, Martin-Algarra S, Perez G, et al. Serum interleukin-8
reflects tumour burden and treatment response across malignancies of multiple tissue origins. Clin Can-
cer Res. 2014;20:5697-707.
[17] Wang J, Yi Y, Li B, Wang Z, Sun H, Zhang P, et al. CYFRA21-1 can predict the sensitivity to chemoradio-
therapy of non-small-cell lung carcinoma. Biomarkers. 2010;15:594-601.
[18] Wang J, Zhang N, Li B, Wang Z, Sun H, Yi Y, et al. Decline of serum CYFRA21-1 during chemoradiotherapy
of NSCLC: a probable predictive factor for tumour response. Tumour Biol. 2011;32:689-95.](https://image.slidesharecdn.com/0e20c58a-e59d-4f72-b721-87c0da20639d-160804091812/85/E-book-Thesis-Sara-Carvalho-136-320.jpg)
![PROGNOSTIC VALUE OF BLOOD-BIOMARKERS IN NSCLC
137
[19] Zou XL, Wang C, Liu KE, Nie W, Ding ZY. Prognostic significance of osteopontin expression in non-small-
cell lung cancer: A meta-analysis. Mol Clin Oncol. 2015;3:633-8.
[20] Liu Y, Gu X, Lin Q, Tian T, Shao L, Yuan C, et al. Prognostic significance of osteopontin in patients with
non-small cell lung cancer: results from a meta-analysis. International journal of clinical and experi-
mental medicine. 2015;8:12765-73.
[21] Jing X, Huang C, Zhou H, Li C, Fan L, Chen J, et al. Association between serum C-reactive protein value
and prognosis of patients with non-small cell lung cancer: a meta-analysis. International journal of clini-
cal and experimental medicine. 2015;8:10633-9.
[22] Ilie M, Mazure NM, Hofman V, Ammadi RE, Ortholan C, Bonnetaud C, et al. High levels of carbonic anhy-
drase IX in tumour tissue and plasma are biomarkers of poor prognostic in patients with non-small cell
lung cancer. British journal of cancer. 2010;102:1627-35.
[23] Gomes M, Coelho A, Araujo A, Azevedo A, Teixeira AL, Catarino R, et al. IL-6 polymorphism in non-small
cell lung cancer: a prognostic value? Tumour Biol. 2015;36:3679-84.
[24] Liao C, Yu Z, Guo W, Liu Q, Wu Y, Li Y, et al. Prognostic value of circulating inflammatory factors in non-
small cell lung cancer: a systematic review and meta-analysis. Cancer biomarkers : section A of Disease
markers. 2014;14:469-81.
[25] Zhang ZH, Han YW, Liang H, Wang LM. Prognostic value of serum CYFRA21-1 and CEA for non-small-cell
lung cancer. Cancer medicine. 2015;4:1633-8.
[26] Bien E, Balcerska A. Serum soluble interleukin 2 receptor alpha in human cancer of adults and children: a
review. Biomarkers. 2008;13:1-26.
[27] De Vita F, Turitto G, di Grazia M, Frattolillo A, Catalano G. Analysis of interleukin-2/interleukin-2 receptor
system in advanced non-small-cell lung cancer. Tumouri. 1998;84:33-8.
[28] Fu HY, Li C, Yang W, Gai XD, Jia T, Lei YM, et al. FOXP3 and TLR4 protein expression are correlated in non-
small cell lung cancer: implications for tumour progression and escape. Acta Histochem. 2013;115:151-7.
[29] Kawashima O, Kamiyoshihara M, Sakata S, Endo K, Saito R, Morishita Y. The clinicopathological signifi-
cance of preoperative serum-soluble interleukin-2 receptor concentrations in operable non-small-cell
lung cancer patients. Ann Surg Oncol. 2000;7:239-45.
[30] Naumnik W, Chyczewska E. The clinical significance of serum soluble interleukin 2 receptor (sIL-2R)
concentration in lung cancer. Folia Histochem Cytobiol. 2001;39 Suppl 2:185-6.
[31] Oh JH, Craft JM, Townsend R, Deasy JO, Bradley JD, El Naqa I. A bioinformatics approach for biomarker
identification in radiation-induced lung inflammation from limited proteomics data. J Proteome Res.
2011;10:1406-15.
[32] Rades D, Setter C, Dunst J, Dahl O, Schild SE, Noack F. Prognostic impact of VEGF and VEGF receptor 1
(FLT1) expression in patients irradiated for stage II/III non-small cell lung cancer (NSCLC). Strahlenther
Onkol. 2010;186:307-14.
[33] Samara KD, Antoniou KM, Karagiannis K, Margaritopoulos G, Lasithiotaki I, Koutala E, et al. Expression
profiles of Toll-like receptors in non-small cell lung cancer and idiopathic pulmonary fibrosis. Int J Oncol.
2012;40:1397-404.
[34] Carrizosa DR, Gold KA. New strategies in immunotherapy for non-small cell lung cancer. Transl Lung
Cancer Res. 2015;4:553-9.
[35] Simone CB, 2nd, Burri SH, Heinzerling JH. Novel radiotherapy approaches for lung cancer: combining
radiation therapy with targeted and immunotherapies. Transl Lung Cancer Res. 2015;4:545-52.
[36] van Baardwijk A, Wanders S Fau - Boersma L, Boersma L Fau - Borger J, Borger J Fau - Ollers M, Ollers M
Fau - Dingemans A-MC, Dingemans Am Fau - Bootsma G, et al. Mature results of an individualized radia-
tion dose prescription study based on normal tissue constraints in stages I to III non-small-cell lung can-
cer. J Clin Oncol. 2010;28(8):1380-6.
[37] Oncology MR. Concurrent chemo-radiation for NSCLC to an individualized MLD, NLM identifier: NCT005
72325. 2007.
[38] van Elmpt W, De Ruysscher D Fau - van der Salm A, van der Salm A Fau - Lakeman A, Lakeman A Fau -
van der Stoep J, van der Stoep J Fau - Emans D, Emans D Fau - Damen E, et al. The PET-boost randomised
phase II dose-escalation trial in non-small cell lung cancer. Radiother Oncol. 2012;104(1):67-71.](https://image.slidesharecdn.com/0e20c58a-e59d-4f72-b721-87c0da20639d-160804091812/85/E-book-Thesis-Sara-Carvalho-137-320.jpg)
![CHAPTER 8
138
[39] Senan S, De Ruysscher D, Giraud P, Mirimanoff R, Budach V. Literature-based recommendations for
treatment planning and execution in high-dose radiotherapy for lung cancer. Radiother Oncol.
2004;71:139-46.
[40] Dehing-Oberije C, Aerts H, Yu S, De Ruysscher D, Menheere P, Hilvo M, et al. Development and validation
of a prognostic model using blood biomarker information for prediction of survival of non-small-cell lung
cancer patients treated with combined chemotherapy and radiation or radiotherapy alone
(NCT00181519, NCT00573040, and NCT00572325). Int J Radiat Oncol Biol Phys. 2011;81:360-8.
[41] Dehing-Oberije C, Yu S, De Ruysscher D, Meersschout S, Van Beek K, Lievens Y, et al. Development and
external validation of prognostic model for 2-year survival of non-small-cell lung cancer patients treated
with chemoradiotherapy. Int J Radiat Oncol Biol Phys. 2009;74:355-62.
[42] Tibshirani R. The lasso method for variable selection in the Cox model. Stat Med. 1997;16(4):385-95.
[43] Team RC. R: A language and environment for statistical computing. R Foundation for Statistical Compu-
ting. 2.15.2 ed2015.
[44] Graves EE, Maity A, Le QT. The Tumour Microenvironment in Non-Small Cell Lung Cancer. Semin Radiat
Oncol. 2010;20:156-63.
[45] Quail D, Joyce J. Microenvironmental regulation of tumour progression and metastasis. Nat Med.
2013;19:1423-37.
[46] Zegers CM, van Elmpt W, Reymen B, Even AJ, Troost EG, Ollers MC, et al. In vivo quantification of hypoxic
and metabolic status of NSCLC tumours using [18F]HX4 and [18F]FDG-PET/CT imaging. Clin Cancer Res.
2014;20:6389-97.
[47] Soliman M, Yaromina A Fau - Appold S, Appold S Fau - Zips D, Zips D Fau - Reiffenstuhl C, Reiffenstuhl C
Fau - Schreiber A, Schreiber A Fau - Thames HD, et al. GTV differentially impacts locoregional control of
non-small cell lung cancer (NSCLC) after different fractionation schedules: subgroup analysis of the pro-
spective randomized CHARTWEL trial. Radiother Oncol. 2013;106(3):299-304.
[48] Xu Y, Xu L, Qiu M, Wang J, Zhou Q, Yin R. Prognostic value of serum cytokeratin 19 fragments (Cyfra 21-1)
in patients with non-small cell lung cancer. Sci Rep. 2015;5:9444.
[49] Orditura M, Romano C, De Vita F, Galizia G, Lieto E, Infusino S, et al. Behaviour of interleukin-2 serum
levels in advanced non-small-cell lung cancer patients: relationship with response to therapy and surviv-
al. Cancer Immunol Immunother. 2000;49:530-6.
[50] Brunetti G, Bossi A, Baiardi P, Jedrychowska I, Pozzi U, Bacchella L, et al. Soluble interleukin 2 receptor
(sIL2R) in monitoring advanced lung cancer during chemotherapy. Lung Cancer. 1999;23:1-9.
[51] Witkowska AM. On the role of sIL-2R measurements in rheumatoid arthritis and cancers. Mediators
Inflamm. 2005;2005:121-30.
[52] Zegers CM, Rekers NH, Quaden DH, Lieuwes NG, Yaromina A, Germeraad WT, et al. Radiotherapy com-
bined with the immunocytokine L19-IL2 provides long-lasting antitumour effects. Clin Cancer Res.
2015;21(5):1151-60.
[53] van den Heuvel MM, Verheij M, Boshuizen R, Belderbos J, Dingemans AM, De Ruysscher D, et al. NHS-IL2
combined with radiotherapy: preclinical rationale and phase Ib trial results in metastatic non-small cell
lung cancer following first-line chemotherapy. J Transl Med. 2015:13:32.
[54] Das M, Wakelee H. Targeting VEGF in lung cancer. Expert Opinion on Therapeutic Targets 2012;16:395-406.
[55] Auperin A, Le Pechoux C Fau - Rolland E, Rolland E Fau - Curran WJ, Curran Wj Fau - Furuse K, Furuse K
Fau - Fournel P, Fournel P Fau - Belderbos J, et al. Meta-analysis of concomitant versus sequential radi-
ochemotherapy in locally advanced non-small-cell lung cancer. J Clin Oncol. 2010;28(13):2181-90.
[56] Peeters SG, Zegers CM, Lieuwes NG, van Elmpt W, Eriksson J, van Dongen GA, et al. A comparative study
of the hypoxia PET tracers [(1)(8)F]HX4, [(1)(8)F]FAZA, and [(1)(8)F]FMISO in a preclinical tumour model.
Int J Radiat Oncol Biol Phys. 2015;91(2):351-9.
[57] Zander T, Scheffler M Fau - Nogova L, Nogova L Fau - Kobe C, Kobe C Fau - Engel-Riedel W, Engel-Riedel
W Fau - Hellmich M, Hellmich M Fau - Papachristou I, et al. Early prediction of nonprogression in ad-
vanced non-small-cell lung cancer treated with erlotinib by using [(18)F]fluorodeoxyglucose and
[(18)F]fluorothymidine positron emission tomography. J Clin Oncol. 2011;29(13):1701-8.](https://image.slidesharecdn.com/0e20c58a-e59d-4f72-b721-87c0da20639d-160804091812/85/E-book-Thesis-Sara-Carvalho-138-320.jpg)
![PROGNOSTIC VALUE OF BLOOD-BIOMARKERS IN NSCLC
139
[58] Mishani E, Abourbeh G Fau - Eiblmaier M, Eiblmaier M Fau - Anderson CJ, Anderson CJ. Imaging of EGFR
and EGFR tyrosine kinase overexpression in tumours by nuclear medicine modalities. Curr Pharm Des.
2008;14(28):2983-98.](https://image.slidesharecdn.com/0e20c58a-e59d-4f72-b721-87c0da20639d-160804091812/85/E-book-Thesis-Sara-Carvalho-139-320.jpg)
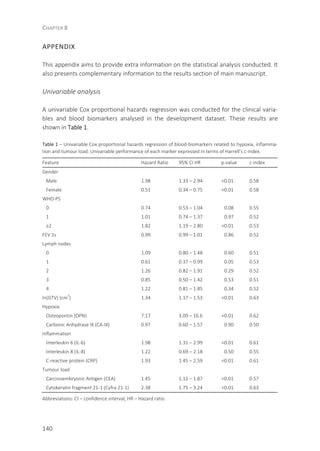
![PROGNOSTIC VALUE OF BLOOD-BIOMARKERS IN NSCLC
141
Multivariable analysis
A Cox proportional hazards regression model was developed and selected from blood
biomarkers representative of hypoxia, inflammation and tumour load, in addition to
validated clinical variables (gender, World Health Organization performance status
(WHO-PS), forced expiratory volume in one second (FEV1s), number of positive lymph
node stations identified in the diagnostic PET scans (lymph nodes) and GTV, defined as
the sum of the GTV of the primary tumour and metastatic lymph nodes [1]). A least
absolute shrinkage and selection operator (LASSO) method was applied for feature
selection of the blood-biomarkers with 10-fold cross-validated (CV) for lambda selec-
tion. Lambda (λ), is the regularisation coefficient, and for high values of λ, LASSO returns
a zero vector, whereas when λ approaches zero it becomes the standard least squares
fit. After correct lambda selection, LASSO minimises the log partial likelihood, shrinking
coefficients weights (to zero), decreasing the estimated variance while providing an
interpretable final model [2].
Table 2 – Multivariable Cox PH regression of the clinical variables and of clinical variables and blood-
biomarkers included in the derivation dataset. Performance of the model expressed in terms of internal
Harrell’s c-index, further corrected for optimism by a 10-fold CV (*) and external one (**).
Feature Hazard Ratio p-value 95% CI HR c-index Hazard Ratio p-value 95% CI HR c-index
Gender 0.66
0.64*
0.62**
0.70
0.67*
0.66**
Male Reference Reference
Female 0.50 <0.01 0.33 – 0.75 0.54 <0.01 0.36 – 0.82
WHO-PS
0 Reference Reference
1 1.30 0.01 0.90 – 1.88 1.20 0.01 0.82 – 1.74
≥2 2.65 1.57 – 4.45 2.09 1.22 – 3.58
FEV 1s 1.00 0.88 0.99 – 1.01 1.00 0.45 0.99 – 1.00
Lymph nodes
0 Reference Reference
1 0.63 0.14 0.37 – 1.06 0.63 0.14 0.37 – 1.07
2 1.03 0.63 – 1.66 1.12 0.69 – 1.83
3 0.59 0.34 – 1.05 0.62 0.35 – 1.09
4 0.91 0.57 – 1.46 1.10 0.68 – 1.80
ln(GTV) (cm
3
) 1.41 <0.01 1.21 – 1.64 1.28 <0.01 1.09 – 1.50
OPN 3.31 0.01 1.31 – 8.38
Cyfra 21-1 1.71 0.01 1.18 – 2.50
A logarithmic transformation was performed on the blood-biomarker measurements prior to analysis
Abbreviations: CI – Confidence Interval; HR – Hazard Ratio; WHO-PS – World Health Organization perfor-
mance status; FEV 1s – forced expiratory volume in 1 second; Lymph nodes refer to the PET positive stations
identified; GTV – gross tumour volume (GTV = volume of primary tumour + volume of PET positive lymph
node stations); OPN – Osteopontin; Cyfra 21-1 – Cytokeratin fragment 21-1.](https://image.slidesharecdn.com/0e20c58a-e59d-4f72-b721-87c0da20639d-160804091812/85/E-book-Thesis-Sara-Carvalho-141-320.jpg)
![CHAPTER 8
142
Model performance was evaluated using Harrell’s concordance-index (c-index), for
which 1 indicates perfect discrimination and a value of 0.5, no discrimination (no great-
er than chance expectations). As the model is fit to the data, its performance is usually
overestimated. Therefore, the c-index was corrected for this optimism with a 10-fold
Cross Validation (CV) [3]. Data were split into 10 subsets. The model coefficients were
estimated using 90% of the data and the model was then tested on the remaining 10%.
This procedure was repeated 100 times and the average performance on the test data
was computed. The result provides an indication of the model’s expected performance
on a new dataset. The derived model, apparent (not corrected) and cross-validated
performances are shown in Table 2.
External Model validation
The prognostic index (PI) was computed by multiplying the covariates’ values of the
validation data with the estimated coefficients: = ∑ . Calibration slope was
determined on the PI, by entering the PI as a variable in the Cox regression and the
likelihood ratio test of the equality of this slope to 1 was performed: a slope not signifi-
cantly different from 1 indicates that the estimated model coefficients can be applied to
the new dataset without adaptation, otherwise a recalibration is necessary [4, 5].
The calibration slope of the PI was 0.66 and significantly different from 1 (p<0.01)
indicating that the absolute risk prediction was not accurate, being too optimistic. This
means that the predictions are too extreme, being too low for low predictions and too
high for high estimates (figure in the appendix material). Therefore, the model was re-
calibrated (Figure 1).](https://image.slidesharecdn.com/0e20c58a-e59d-4f72-b721-87c0da20639d-160804091812/85/E-book-Thesis-Sara-Carvalho-142-320.jpg)
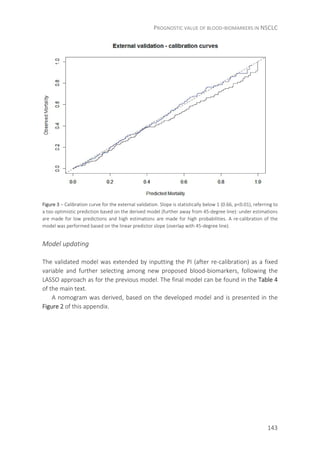
![CHAPTER 8
144
Figure 2 – Nomogram for predicted probability of 2-year survival, using the fitted Cox regression, on the
training dataset. To compute the predicted value, gather for each variable the number of points, by drawing a
straight upward line from the variable row to the “Points” line on top. Sum the total number of points and
locate this value in the “Total points” line. Draw a line straight down from it to the “Predicted Value”, as to
compute the predicted probability. A logarithmic transformation was performed on the blood-biomarkers
measurements prior to analysis. Acronyms: WHO-PS – world health organization performance status; FEV 1s –
forced expiratory volume in 1 second; Lymph nodes refer to the PET positive stations identified; GTV – gross
tumour volume (GTV = volume of primary tumour + volume of PET positive lymph node stations); OPN –
Osteopontin; Cyfra 21-1 – cytokeratin fragment 21-1.
REFERENCES
[1] Dehing-Oberije C, Yu S, De Ruysscher D, Meersschout S, Van Beek K, Lievens Y, et al. Development and
external validation of prognostic model for 2-year survival of non-small-cell lung cancer patients treated
with chemoradiotherapy. Int J Radiat Oncol Biol Phys. 2009 Jun 1;74(2):355-362.
[2] Tibshirani R. The lasso method for variable selection in the Cox model. Stat Med. 1997 19970429 DCOM-
19970429;16(4)(0277-6715 (Print)):385-395.
[3] Harrell FE, Jr., Lee KL, Mark DB. Multivariable prognostic models: issues in developing models, evaluating
assumptions and adequacy, and measuring and reducing errors. Statistics in medicine. 1996 Feb
28;15(4):361-387.
[4] Royston P, Altman DG. External validation of a Cox prognostic model: principles and methods. BMC
medical research methodology. 2013;13:33.
[5] van Houwelingen HC. Validation, calibration, revision and combination of prognostic survival models.
Stat Med. 2000 Dec 30;19(24):3401-3415.](https://image.slidesharecdn.com/0e20c58a-e59d-4f72-b721-87c0da20639d-160804091812/85/E-book-Thesis-Sara-Carvalho-144-320.jpg)

![CHAPTER 9
146
GENERAL DISCUSSION AND CONCLUDING REMARKS
This thesis describes the use of non-invasive sources of information, namely imaging
and blood biomarkers for disease management and overall survival assessment for
patients with non-small cell lung cancer (NSCLC). Methods for sophisticated image
analysis were developed, the so called radiomics, and applied to develop prognostic and
predictive models, subsequently validated in external datasets. The importance of blood
biomarkers related to hypoxia, inflammation and tumour load for prognostic
assessment, was also assessed and later on, extended with newer markers related to
immunological processes. Combining the here investigated non-invasive sources of
information with clinical parameters, even though not fully explored within this work, is
expected to be of great importance in the patient management and improvement of
outcomes. Finally, incorporating these in shared decision making tools would be
advantageous for both patient and healthcare providers, facilitating existing healthcare
routines and patient’s awareness on prognostic probabilities.
Final section of this chapter resumes an overview of possible future developments,
following the methodologies and conclusions derived along this thesis.
1. RAPID LEARNING IN RADIOTHERAPY
Chapter 2 presents an overview on the use of data mining approaches and outcomes
modelling as a way to tailor treatment and enhance outcomes in oncology, by means of
a rapid-learning health care approach for radiotherapy. Rapid-learning methodologies
for health-care in general encompass a continuous learning process from
retrospective/prospectively standardly collected data, which evaluation of outcomes,
through developed prognostic/predictive tools will iteratively generate new hypothesis
for investigation [1]. Additionally, these are aimed to raise awareness at a multilevel
clinical care approach, and preventive alertness by engaging patients into screening
initiatives for early disease detection. As a result, a more personalized approach is
expected, entangled with more participatory patients, but also care providers [2].
Practical evidences of these approaches have been recently demonstrated. A
previously devel-oped decision support system (DSS) for NSCLC, was deployed in a
typical and busy clinic. This led to the identification of prognostic groups and strengthen
its potential for an individualized thera-py, based on the predicted outcomes [3]. This
case study illustrates these tools’ potential in help-ing clinicians delivering a more
reliable prognostic assessment of the disease, thus facilitation the above explained
learning phase from multi-institutional data.[4].
Current literature is becoming broader and extensive in reporting the development
of prognos-tic/predictive models, not limited to NSCLC, but other solid cancer types [5-
14]. However, few of these make their way into clinical application, which may follow
the lack of validation, and there-fore impedes their translation into external and newer
data. This is often a reflection of most common problems encountered when sharing](https://image.slidesharecdn.com/0e20c58a-e59d-4f72-b721-87c0da20639d-160804091812/85/E-book-Thesis-Sara-Carvalho-146-320.jpg)
![GENERAL DISCUSSION, CONCLUDING REMARKS AND FUTURE PERSPECTIVES
147
data across institutes, either due to legal con-straints, patients’ own will or even IT
infrastructures non-compatibilities.
Radiotherapy-specific data have the potential to be shared across international
institutes, without need for burdensome reinventions, assuming its uniformity,
completeness and quality is verified. This may follow a standardized protocol, format
and semantics, for which controlled vocabulary and ontology are verified, given
interoperability between clinical technological infrastructures exists. Nevertheless,
patient privacy, particularly across international institutes being a delicate matter
should not be disregarded in any way, as application of confidentiality and privacy rules
and laws differ between different countries [15].
Figure 1 – Rapid-learning systems in radiotherapy require clinical information systems integra-tion. Datasets
for research purposes are often stored in date warehouses for further analysis [15].
The current transition from paper records into more sophisticated electronic medical
records (EMD), allows for, not only a more structured information, as well as highly
increases its sharing potential. Modern data warehouse technologies are expected to
provide with high quality data collection and storage. Nevertheless, the initial
burdensome in data digitization, is expected to be compensated on the long term, with
a higher flexibility of data handling and information extrac-tion for newer studies (Figure
1) [16]. Not to forget that, data collection is the most time-consuming and often prone
to errors task, particularly when conducted by humans.](https://image.slidesharecdn.com/0e20c58a-e59d-4f72-b721-87c0da20639d-160804091812/85/E-book-Thesis-Sara-Carvalho-147-320.jpg)
![CHAPTER 9
148
Following these evidences and current availability of imaging information in
dedicated PACS systems (picture archive and communication system - a computer
network for digitized radiologic images and reports), opens a branch for data analysis,
sharing and validation, that has never found equivalent in the past years.
2. IMAGING BIOMARKERS FOR NSCLC – RADIOMICS
Solid tumours are heterogeneous and dissimilar in shape and size amongst patients. The
possibility to describe this heterogeneity in a non-invasive manner, derive prognostic
information from it, and potentially capture its underlying genomic and proteomic
profile is the main hypothesis behind Radiomics, presented in Chapter 3. In this chapter,
even though not introducing a novel concept, it definitely brings into light a more
sophisticated workflow of image analysis, from high quality imaging data acquisition to
the high-throughput quantification of imaging features derived from a robustly defined
region-of-interest (ROI). The large spectrum of imaging features retrieved from this ROI
is then to be analyzed through refined statistical methods and modelling techniques
with the goal of inferring useful, predictive, and prognostic information. Following this
conceptual presentation of the project, many studies were conducted and are discussed
in the following chapters.
This thesis particularly deals with the metabolic distribution of 18
F-fluorode-
oxyglucose (FDG), as measured by positron emission tomography (PET) for NSCLC
patients, treated radically with radiotherapy. Radiomics features analyzed include
descriptors of shape and size (n=9), first order statistics (n=16), texture information
(second order statistics) – with the three sub-categories run length grey level – RLGL
(n=11), grey level co-occurrence – GLCM (n=22), and grey level size zone matrices –
GLSZM (n=11), and intensity-volume histogram features (IVH) (n=45) (Figure 2). A
mathematical explanation of these features is given in the appendix to Chapter 5, with
exception of IVH metrics, further introduced in Chapter 4.
IVH features are similar in concept to the dose-volume histograms (DVH) deeply
used in the radiotherapy field, but instead of dose distributions, describe tumour’s FDG
uptake distribution as a function of its volume, and vice-versa [17]. These include
descriptors of absolute and relative volume for increasing relative intensities of 10 up to
90% in steps of 10% (AVRIx and RVRIx); descriptors of absolute and mean intensities
enclosed with increasingly relative volume portions from 10 up to 90% in steps of 10%
(AIRVx and MIRVx); metabolic tumour volume (MTV) and total lesion glycolysis (TLG)
defined for increasing relative intensities of 10 up to 90% in steps of 10% (MTVRIx and
TLGRIx). Note that MIRV, MTV and TLG curves were introduced later in the in-house
develop toolbox for feature extraction,and therefore not accounted for the stability
analysis performed in Chapter 5. A similar analysis was later conducted before their
inclusion in the studies presented in chapters 6 and 7.](https://image.slidesharecdn.com/0e20c58a-e59d-4f72-b721-87c0da20639d-160804091812/85/E-book-Thesis-Sara-Carvalho-148-320.jpg)
![GENERAL DISCUSSION, CONCLUDING REMARKS AND FUTURE PERSPECTIVES
149
Radiomics approach is the precursor of the next four chapters that in an initial stage
started by investigating whether IVH, a particular sub-category of first order statistics
metrics, would provide extra information, in comparison to the commonly analyzed
features as derived from the FDG-PET signal: maximum, peak and mean standard
uptake value (SUV). Chapter 4 describes the results of analyzing the FDG-PET signal at
the baseline scan (prior to radiotherapy delivery) in a large dataset of 220 NSCLC
patients treated radically at our institute. Tumour heterogeneous FDG uptake is
intrinsically dependent on its microenvironment, that can be more accurately describe
with IVH metrics, providing a more complete overview of the complex tumour intensity
distribution across total tumour volume, instead of narrowed to a single high uptake
value, as maximum or peak SUV [18, 19]. All IVH metrics were evaluated in this chapter,
with the exception of TLGRIx and MIRVx, only investigated in Chapters 6 and 7, as they
were later included in the imaging analysis toolbox. Results summarized in this chapter
report on important findings of relative volume enclosing the higher relative intensity
being a significant prognostic factor for overall survival, which could not be concluded
for the maximum or peak SUV. Even though lacking external validation, these positive
results were introductory for the extended imaging analysis in which more radiomics
features were included.
Figure 2 – Radiomics features comprised descriptors of (A) first order statistics, (B) shape and size and (C)
texture information, describing spatial distribution of voxel intensities and deter-mined by considering 26
connected voxels (i.e. voxels were considered to be neighbors in all 13 directions in three dimensions) at a
distance of 1 voxel. Features derived from GLCM and RLGL were calculated by averaging their value over all 13
directions.](https://image.slidesharecdn.com/0e20c58a-e59d-4f72-b721-87c0da20639d-160804091812/85/E-book-Thesis-Sara-Carvalho-149-320.jpg)
![CHAPTER 9
150
Chapter 5 presents an analysis on the stability of Radiomics features, assessed in a
test-retest scenario and through multiple radiation oncologist’s primary tumour
delineations. Test-retest included the analysis of PET scans from 11 liver cancer
patients, acquired one day apart with no treatment administered in between. Multiple
observers analysis involved the investigation of Radiomics features’ robustness against
manual and independent delineations. These were per-formed by five independent and
experienced radiation oncologist, who were required to segment the primary tumour
on pre-radiotherapy fused PET-CT scans, blinded to each other’s delineations. Solely 77
out of 118 features achieved a high stability in both tests, defined as an intraclass corre-
lation (ICC) larger than 0.85. These were included in the subsequent analyses in the
studies pre-sented in Chapters 6 and 7.
A bottleneck of imaging analysis, and particularly PET, is its dependence on the
followed protocol for FDG injection, scan acquisition and reconstruction as well
correction protocols. In this scenar-io, stability tests become an important and crucial
step in the imaging analysis and prognostic modelling, particularly when dealing with
independent and external validation scans, often per-formed in different scanners.
Previous studies have addressed this matter, particularly for CT imaging [20-22]. One
should however keep in mind that this step provides a more reliable ap-proach when
performed in scans acquired with the same scanner and following the same acquisi-tion
protocols, as data in the development datasets for sequent model derivation. This
should be deeply considered in the future, by means of using phantom acquisitions, for
instance. However, and even though with this limitation, one can rely on this approach
to provide a good estimation for accurate selection amongst the whole spectrum of
Radiomics features in order to proceed analysis with the most stable and robust ones.
In Chapter 6 the changes of radiomics features early during radiotherapy were
analyzed, the so-called “Delta Radiomics” approach. Few studies have already
addressed the importance of meas-uring the changes in FDG uptake patterns, early
during treatment, in order to improve outcomes in a stage at which treatment
adaptation is still a possibility. These have included mainly first order descriptors,
metabolic tumour volume – MTV (the highly uptake region above a defined threshold)
and total lesion glycolysis – TLG (defined as the product of MTV with its enclosed mean
SUV) [23-27]. Here, a multivariable model was built, based on early changes in
Radiomics features in 52 NSCLC patients, and subsequently validated in two
independent datasets (n=32 and 26). The final model included, at least, one variable
from each category. To note that the univariable percentage variation of most
commonly assessed features (maximum, mean and peak SUV, and tumour volume) was
not statistically significant. In addition to the benefit of combining heterogeneous
imaging descriptors, as offered with the Radiomics approach, the greatest advantage
here documented refers to the validation performed. The use of two independent and
external datasets offers protection against model fit in independent data of the one
used in the development phase. This is a crucial step when moving towards the clinical](https://image.slidesharecdn.com/0e20c58a-e59d-4f72-b721-87c0da20639d-160804091812/85/E-book-Thesis-Sara-Carvalho-150-320.jpg)
![GENERAL DISCUSSION, CONCLUDING REMARKS AND FUTURE PERSPECTIVES
151
application, offering a better insight on how the derived models would fit in new data. A
satisfactory internal performance of 0.66 (p<0.01) was achieve, here measured as the
concordance-index (ranging from 0.5 – not better than the expected chance, up to 1 –
perfect fit). Independent validation presented performances of 0.64 (p<0.01) and 0.57
(p=0.27). The lower external performance, particularly for the second validation dataset
and further discussed in the corresponding chapter, reinforces the debate on a uniform
acquisition protocol, not only of FDG injection and reconstruction parameters, but also
timing. The repeated acquisition within treatment, when following an homogenous
protocols amongst institutes will provide a higher accuracy assessment of disease
evolution. It is, therefore desired a combination of efforts between institutes as to
derive homogeneous imaging acquisition protocols, in order to gather a large enough
number of observations that would allow for a more precise and validated predic-tive
model.
Finally, in Chapter 7 a Radiomics approach is conducted to both primary tumour and
the metastat-ic lymph nodes of NSCLC. Main hypothesis of this chapter was that
metastatic lymph nodes, and its associated higher metastatic potential, do provide extra
prognostic value in addition to the primary tumour, and for this purpose, a whole set of
stable radiomics features were extracted and analyzed for both structures. These were
used to fit a prognostic model on the derivation dataset (n=262 patients) and further
validated on an external one (n=50). Main conclusion of this study was that a model
selecting amongst features exclusively extracted from the metastatic lymph nodes
achieved a statistically higher performance than similar modeling approach based solely
on the primary tumour. External validation of these models showed however that the
best fit was achieved when combining both sources of information, meaning features
from metastatic lymph nodes and primary tumour, which achieved a performance of
0.62 – external 0.59. Other ap-proaches verified performances of 0.53 – external 0.54,
when derived from tumour, and 0.62 – external 0.56 from metastatic lymph nodes. All
performances are expressed in terms of concord-ance-index.
The analysis of imaging traits derived from metastatic lymph nodes, even though
expected to provide with relevant insight of disease prognosis, is still very limited in the
current literature [28, 29], with more relevance currently still being given to the primary
tumour alone [30-32]. This study, being a newer approach in the imaging analysis for
NSCLC, and despite its limitations of not providing a stratified analysis per metastatic
node station affected (and further, discussed in the corresponding chapter), clearly
brings into light the extra source of information that these structures provide for a
more accurate prognostic assessment. This gains even more attention, particularly
when it also confirmed the higher prognostic value associated with the number of
metastatic lymph nodes, when compared to the location-based pathological nodal stage
classifi-cation [33].
To conclude this section, one of its limitations refers to the only outcome measured
and analyzed: overall survival. This drawback is expected to be addressed in the future,](https://image.slidesharecdn.com/0e20c58a-e59d-4f72-b721-87c0da20639d-160804091812/85/E-book-Thesis-Sara-Carvalho-151-320.jpg)
![CHAPTER 9
152
specifically when corre-lation between imaging traits accessed prior to radiotherapy
delivery, have been reportedly related to progression free survival, tumour control and
relapse [23, 34, 35]. In order to validate these findings, prospective data collection
should be improved to facilitate the incorporation of mentioned outcomes in future
analyses, not possible to perform at the time that this work was conducted. Literature
has also reported the investigation of response assessment and prognosis for NSCLC
patients following other therapeutic approaches, not limited to radiotherapy as pre-
sented in this thesis, namely erlotinib therapy and chemotherapy alone [36-39].
However, and despite the positive findings, this has been restricted to the analysis of
higher regions of uptake, for which a full Radiomics approach would be of expected
advantage, but, still not proved.
3. BLOOD BIOMARKERS FOR NSCLC
In this thesis the seek for non-invasive ways to accurately describe tumour and further
characterize its prognostic profiles followed two approaches, imaging and blood
respectively. In Chapter 8 a study on blood-biomarkers related to hypoxia, inflammation
and tumour load, was performed and validated in an independent cohort, comprising a
total of over 350 patients.
The use of blood-biomarkers has been receiving much attention in the past years as
for lung cancer, tissue collection by means of biopsy is a difficult process as already
mentioned. In this scenario, blood collection by veniculture offers an attractive
alternative. Blood-biomarkers selec-tion was based on proven evidence of their
prognostic value and association with treatment outcome (survival or tumour control),
restricted to studies with a minimum of 100 patients and narrowed to markers that
could be measured in daily clinical practice (to ensure its applicability in clinical
practice). The selection comprised markers related to hypoxia [osteopontin (OPN) and
carbonic anhydrase IX (CA-IX)], inflammation [interleukin 6 (IL-6), IL-8, and C-reactive
protein (CRP)], and tumour load [carcinoembryonic antigen (CEA) and cytokeratin
fragment (CYFRA 21-1)] [40-54].
Even though many studies have already addressed the utility of different blood-
biomarkers indi-vidually, we here that analysis to a multivariable approach including
dissimilar types of markers in a large set of NSCLC patients (n=182), further validated in
an independent and equally large dataset (n=181). The obtained results reported on a
positive improvement of a validated clinical model including World Health Organization
performance-status, forced expiratory volume in 1 second, number of positive lymph
node stations, and gross tumour volume, with the addition of a marker of hypoxia
(OPN) and one of tumour load (Cyfra 21-1) [7]. This model was then extended by
selecting among newer markers, only available in the development dataset, including
immunogenic markers: alpha-2-macroglobulin (α2M), serum IL-2 receptor (sIL2R), toll-
like receptor 4 (TLR4), and vascular endothelial growth factor (VEGF) [43, 55-62]. The](https://image.slidesharecdn.com/0e20c58a-e59d-4f72-b721-87c0da20639d-160804091812/85/E-book-Thesis-Sara-Carvalho-152-320.jpg)
![GENERAL DISCUSSION, CONCLUDING REMARKS AND FUTURE PERSPECTIVES
153
selection of these markers followed a similar rationale as previously described, further
testing the possibility to identify surrogates for immunological response, which could
therefore be incorporated into immunotherapy assessment studies. This was in
response to evidence that immunotherapy has positive effects on NSCLC [63-67]. Still,
this was an exploratory step, which still requires further validation.
In summary, we obtained positive results for the use of blood-biomarkers to predict
overall sur-vival. Similarly to the closing remarks of previous section, other outcomes
would also be of inter-est. Recent literature reported on a panel of 6 serum biomarkers
(including Cyfra 21-1), related to overall survival assessment, which however could not
characterized the disease in terms of its development and spread of brain metastasis
[68]. As performed for imaging biomarkers in Chap-ter 6, the early response assessment
for disease progression and treatment effectiveness by means of blood collection
during treatment, still remain and unanswered hypothesis. To close this section
discussion, some of the here investigated markers, particularly CEA and CYFRA 21-1,
have been reported as a valuable diagnostic tool, providing an early and high sensitive
identification of newer lung neoplasms, reinforcing its high potential for disease
management [69]. This list of potential biomarkers can also be expanded with DNA-
related ones, retrieved from saliva samples, but here not explored [70].
FUTURE PERSPECTIVES
The imaging analysis, here restricted to FDG-PET, has always the potential to be
extended to, or complemented with other imaging modalities, as CT, magnetic
resonance imaging (MRI), single-photon emission computerized tomography (SPECT), to
name a few. For its clinical application, a reliable and reproducible assessment of
radiomics features is required, as demonstrated in chap-ter 5. Therefore, a clear
definition of imaging protocols, testing and development of phantoms should be in the
agenda for the next developments. This should be conducted in a longitudinal manner,
including not only the development datasets acquisitions, but also the ones used for
validation purposes.
Still in the field PET signal analysis, interesting to address would be the extension of
tumour me-tabolism assessment, here measured by FDG uptake, with different tracers,
namely for hypoxia and diffusion. Hypoxia is known to be a prevalent effect on NSCLC,
for which a previous study already reported on the combined advantage of analyzing
PET with an appropriate hypoxia mark-er and MRI for early response assessment during
treatment [71, 72]. Also diffusion markers, have been gaining more attention nowadays,
with reported evidences that early variation during treatment of 18F-fluorothymidine
(FLT) is a surrogate for treatment response in NSCLC patients treated with concurrent
(chemo)radiotherapy [73]. Aligned with this, and in order to reduce patient’s burden
with potentially unnecessary radioactive exposure, proper way of identifying which](https://image.slidesharecdn.com/0e20c58a-e59d-4f72-b721-87c0da20639d-160804091812/85/E-book-Thesis-Sara-Carvalho-153-320.jpg)
![CHAPTER 9
154
marker to use based on Radiomics analysis of anatomic information (for instance, CT),
would greatly increase imaging modalities usage. Reduction of costs would also be an
economic benefit, as a more tailored scanning protocol would be performed, instead of
a one-size-fits-all approach.
Common analysis of the imaging information nowadays is circumscribed to the
primary tumour for many of the solid cancer diseases. We presented in chapter 7 an
analysis for which a great value appears to be laying on the metastatic lymph nodes for
NSCLC. Future work planning should include the analysis of early variation of these
metrics derived from the metastatic nodes, follow-ing preliminary evidences that
commonly assessed first order statistic metrics do provide with predictive information,
when assessed early after completion of first cycle of treatment [28]. This approach
should thoroughly be considered to be extended to other disease sites, in particular head
and neck cancer, for which nodes involvement is often a worse prognostic factor [74].
Next step would definitely be the extension of these methodologies to other structures,
in particularly distant metastasis, or even complete organs, for instance total lung.
The combination of the different sources of information (imaging and blood
biomarkers) should also thoroughly be considered in a future investigation. A recent
study showed the added value in combining plasma VEGF–C and PET signal to predict
nodal disease of NSCLC patients [75]. Within the timeframe dedicated to this research,
it was however, not possible to complement the here presented findings with a
combined study of both sources of information.
Preliminary results suggested an association between Radiomics features of a
prognostic signa-ture derived on a large dataset of NSCLC and gene expression, using
gene-set enrichment analysis (GSEA) [76]. These observations were based on pre-
radiotherapy CT images of a sample of 89 NSCLC patients. Linking Radiomics features
and blood biomarkers to genotype, would definitely overcome the current main
drawback on NSCLC management, referring to tissue sampling. Thus, offering a great
gain in treatment response assessment and prediction of outcomes.
Finally, this thesis focused on development and validation of models, incorporating
imaging and blood biomarkers. Following the rationale already discussed, one should
keep in mind that there are always concerns with generalization, particularly with
model development. Frequently, this appears to be associated with the limited number
of observations for validation. Nonetheless, development datasets are themselves often
not large or heterogeneous enough, implying that derived models lack enough
“knowledge” to make accurate predictions on new data. This bridges back to the need
of a more data-sharing mindset, data accrual and re-use, following the iterative learning
process of rapid-learning approaches. The translation of these models into clinical prac-
tice should include the development of tools capable of providing with individualized
prognostic information, and suitable for both clinicians and patients. Moreover, these
should consider clini-cians and patients expectations and preferences.](https://image.slidesharecdn.com/0e20c58a-e59d-4f72-b721-87c0da20639d-160804091812/85/E-book-Thesis-Sara-Carvalho-154-320.jpg)
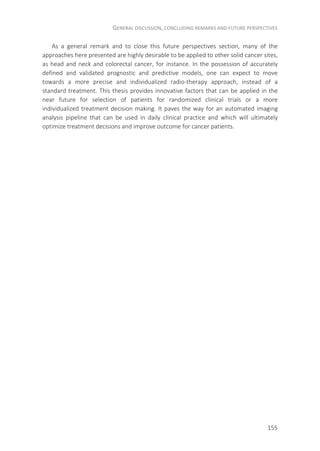
![CHAPTER 9
156
REFERENCES
[1] Abernethy AP, Etheredge LM, Ganz PA, Wallace P, German RR, Neti C, et al. Rapid-learning system for
cancer care. Journal of clinical oncology : official journal of the American Society of Clinical Oncology.
2010 Sep 20;28(27):4268-4274.
[2] Shaikh AR, Butte AJ, Schully SD, Dalton WS, Khoury MJ, Hesse BW. Collaborative biomedicine in the age
of big data: the case of cancer. Journal of medical Internet research. 2014;16(4):e101.
[3] Dekker A, Vinod S, Holloway L, Oberije C, George A, Goozee G, et al. Rapid learning in practice: a lung
cancer survival decision support system in routine patient care data. Radiotherapy and oncology : journal
of the European Society for Therapeutic Radiology and Oncology. 2014 Oct;113(1):47-53.
[4] Lambin P, Zindler J, Vanneste B, Van De Voorde L, Eekers D, Compter I, et al. Decision Support Systems
for Personalized and Participative Radiation Oncology. Advanced drug delivery reviews. 2016 Jan 13.
[5] Wishart GC, Azzato EM, Greenberg DC, Rashbass J, Kearins O, Lawrence G, et al. PREDICT: a new UK
prognostic model that predicts survival following surgery for invasive breast cancer. Breast cancer
research : BCR. 2010;12(1):R1.
[6] Dehing-Oberije C, De Ruysscher D, van der Weide H, Hochstenbag M, Bootsma G, Geraedts W, et al.
Tumour volume combined with number of positive lymph node stations is a more important prognostic
factor than TNM stage for survival of non-small-cell lung cancer patients treated with (chemo)
radiotherapy. International journal of radiation oncology, biology, physics. 2008 Mar 15;70(4):1039-
1044.
[7] Dehing-Oberije C, Yu S, De Ruysscher D, Meersschout S, Van Beek K, Lievens Y, et al. Development and
external validation of prognostic model for 2-year survival of non-small-cell lung cancer patients treated
with chemoradiotherapy. International journal of radiation oncology, biology, physics. 2009 Jun
1;74(2):355-362.
[8] Oberije C, De Ruysscher D, Houben R, van de Heuvel M, Uyterlinde W, Deasy JO, et al. A Validated
Prediction Model for Overall Survival From Stage III Non-Small Cell Lung Cancer: Toward Survival
Prediction for Individual Patients. International journal of radiation oncology, biology, physics. 2015 Jul
15;92(4):935-944.
[9] Marks LB, Bentzen SM, Deasy JO, Kong FM, Bradley JD, Vogelius IS, et al. Radiation dose-volume effects
in the lung. International journal of radiation oncology, biology, physics. 2010 Mar 1;76(3 Suppl):S70-76.
[10] van Stiphout RG, Lammering G, Buijsen J, Janssen MH, Gambacorta MA, Slagmolen P, et al. Development
and external validation of a predictive model for pathological complete response of rectal cancer
patients including sequential PET-CT imaging. Radiotherapy and oncology : journal of the European
Society for Therapeutic Radiology and Oncology. 2011 Jan;98(1):126-133.
[11] Valentini V, van Stiphout RG, Lammering G, Gambacorta MA, Barba MC, Bebenek M, et al. Nomograms
for predicting local recurrence, distant metastases, and overall survival for patients with locally advanced
rectal cancer on the basis of European randomized clinical trials. Journal of clinical oncology : official
journal of the American Society of Clinical Oncology. 2011 Aug 10;29(23):3163-3172.
[12] Egelmeer AG, Velazquez ER, de Jong JM, Oberije C, Geussens Y, Nuyts S, et al. Development and
validation of a nomogram for prediction of survival and local control in laryngeal carcinoma patients
treated with radiotherapy alone: a cohort study based on 994 patients. Radiotherapy and oncology :
journal of the European Society for Therapeutic Radiology and Oncology. 2011 Jul;100(1):108-115.
[13] Creutzberg CL, van Stiphout RG, Nout RA, Lutgens LC, Jurgenliemk-Schulz IM, Jobsen JJ, et al.
Nomograms for prediction of outcome with or without adjuvant radiation therapy for patients with
endometrial cancer: a pooled analysis of PORTEC-1 and PORTEC-2 trials. International journal of
radiation oncology, biology, physics. 2015 Mar 1;91(3):530-539.
[14] Rios Velazquez E, Hoebers F, Aerts HJ, Rietbergen MM, Brakenhoff RH, Leemans RC, et al. Externally
validated HPV-based prognostic nomogram for oropharyngeal carcinoma patients yields more accurate
predictions than TNM staging. Radiotherapy and oncology : journal of the European Society for
Therapeutic Radiology and Oncology. 2014 Dec;113(3):324-330.](https://image.slidesharecdn.com/0e20c58a-e59d-4f72-b721-87c0da20639d-160804091812/85/E-book-Thesis-Sara-Carvalho-156-320.jpg)
![GENERAL DISCUSSION, CONCLUDING REMARKS AND FUTURE PERSPECTIVES
157
[15] Skripcak T, Belka C, Bosch W, Brink C, Brunner T, Budach V, et al. Creating a data exchange strategy for
radiotherapy research: towards federated databases and anonymised public datasets. Radiotherapy and
oncology : journal of the European Society for Therapeutic Radiology and Oncology. 2014
Dec;113(3):303-309.
[16] Roelofs E, Persoon L, Nijsten S, Wiessler W, Dekker A, Lambin P. Benefits of a clinical data warehouse
with data mining tools to collect data for a radiotherapy trial. Radiotherapy and oncology : journal of the
European Society for Therapeutic Radiology and Oncology. 2013 Jul;108(1):174-179.
[17] JC LA, Herrero MA, Nunez L. A dose-volume histogram based decision-support system for dosimetric
comparison of radiotherapy treatment plans. Radiation oncology (London, England). 2015;10(1):263.
[18] El Naqa I, Grigsby P, Apte A, Kidd E, Donnelly E, Khullar D, et al. Exploring feature-based approaches in
PET images for predicting cancer treatment outcomes. Pattern recognition. 2009 Jun 1;42(6):1162-1171.
[19] van Velden FH, Cheebsumon P, Yaqub M, Smit EF, Hoekstra OS, Lammertsma AA, et al. Evaluation of a
cumulative SUV-volume histogram method for parameterizing heterogeneous intratumoural FDG uptake
in non-small cell lung cancer PET studies. European journal of nuclear medicine and molecular imaging.
2011 Sep;38(9):1636-1647.
[20] Balagurunathan Y, Gu Y, Wang H, Kumar V, Grove O, Hawkins S, et al. Reproducibility and Prognosis of
Quantitative Features Extracted from CT Images. Translational oncology. 2014 Feb;7(1):72-87.
[21] Hunter LA, Krafft S, Stingo F, Choi H, Martel MK, Kry SF, et al. High quality machine-robust image
features: identification in nonsmall cell lung cancer computed tomography images. Medical physics.
2013 Dec;40(12):121916.
[22] Mackin D, Fave X, Zhang L, Fried D, Yang J, Taylor B, et al. Measuring Computed Tomography Scanner
Variability of Radiomics Features. Investigative radiology. 2015 Nov;50(11):757-765.
[23] Yossi S, Krhili S, Muratet JP, Septans AL, Campion L, Denis F. Early assessment of metabolic response by
18F-FDG PET during concomitant radiochemotherapy of non-small cell lung carcinoma is associated with
survival: a retrospective single-center study. Clinical nuclear medicine. 2015 Apr;40(4):e215-221.
[24] Kim S, Oh SW, Kim JS, Kim KH, Kim YK. Prediction of response by FDG PET early during concurrent
chemoradiotherapy for locally advanced non-small cell lung cancer. Radiation oncology journal. 2014
Dec;32(4):231-237.
[25] Toma-Dasu I, Uhrdin J, Lazzeroni M, Carvalho S, van Elmpt W, Lambin P, et al. Evaluating tumour
response of non-small cell lung cancer patients with (1)(8)F-fludeoxyglucose positron emission
tomography: potential for treatment individualization. International journal of radiation oncology,
biology, physics. 2015 Feb 1;91(2):376-384.
[26] Fledelius J, Khalil AA, Hjorthaug K, Frokiaer J. Using positron emission tomography (PET) response criteria
in solid tumours (PERCIST) 1.0 for evaluation of 2'-deoxy-2'-[18F] fluoro-D-glucose-PET/CT scans to
predict survival early during treatment of locally advanced non-small cell lung cancer (NSCLC). Journal of
medical imaging and radiation oncology. 2015 Dec 18.
[27] van Elmpt W, Ollers M, Dingemans AM, Lambin P, De Ruysscher D. Response assessment using 18F-FDG
PET early in the course of radiotherapy correlates with survival in advanced-stage non-small cell lung
cancer. Journal of nuclear medicine : official publication, Society of Nuclear Medicine. 2012
Oct;53(10):1514-1520.
[28] Markovina S, Duan F, Snyder BS, Siegel BA, Machtay M, Bradley JD. Regional Lymph Node Uptake of
[(18)F]Fluorodeoxyglucose After Definitive Chemoradiation Therapy Predicts Local-Regional Failure of
Locally Advanced Non-Small Cell Lung Cancer: Results of ACRIN 6668/RTOG 0235. International journal
of radiation oncology, biology, physics. 2015 Nov 1;93(3):597-605.
[29] Li H, Becker N, Raman S, Chan TC, Bissonnette JP. The value of nodal information in predicting lung
cancer relapse using 4DPET/4DCT. Medical physics. 2015 Aug;42(8):4727-4733.
[30] Ohri N, Duan F, Machtay M, Gorelick JJ, Snyder BS, Alavi A, et al. Pretreatment FDG-PET metrics in stage
III non-small cell lung cancer: ACRIN 6668/RTOG 0235. Journal of the National Cancer Institute. 2015
Apr;107(4).](https://image.slidesharecdn.com/0e20c58a-e59d-4f72-b721-87c0da20639d-160804091812/85/E-book-Thesis-Sara-Carvalho-157-320.jpg)
![CHAPTER 9
158
[31] Usmanij EA, de Geus-Oei LF, Bussink J, Oyen WJ. Update on F-18-fluoro-deoxy-glucose-PET/computed
tomography in nonsmall cell lung cancer. Current opinion in pulmonary medicine. 2015 Jul;21(4):314-
321.
[32] Paesmans M, Garcia C, Wong CY, Patz EF, Jr., Komaki R, Eschmann S, et al. Primary tumour standardised
uptake value is prognostic in nonsmall cell lung cancer: a multivariate pooled analysis of individual data.
The European respiratory journal. 2015 Dec;46(6):1751-1761.
[33] Wei S, Asamura H, Kawachi R, Sakurai H, Watanabe S. Which is the better prognostic factor for resected
non-small cell lung cancer: the number of metastatic lymph nodes or the currently used nodal stage
classification? Journal of thoracic oncology : official publication of the International Association for the
Study of Lung Cancer. 2011 Feb;6(2):310-318.
[34] Jeong JU, Chung WK, Nam TK, Song JY, Yoon MS, Kim YC, et al. Early metabolic response on 18F-
fluorodeoxyglucose-positron-emission tomography/computed tomography after concurrent
chemoradiotherapy for advanced stage III non-small cell lung cancer is correlated with local tumour
control and survival. Anticancer research. 2014 May;34(5):2517-2523.
[35] Sura S, Greco C, Gelblum D, Yorke ED, Jackson A, Rosenzweig KE. (18)F-fluorodeoxyglucose positron
emission tomography-based assessment of local failure patterns in non-small-cell lung cancer treated
with definitive radiotherapy. International journal of radiation oncology, biology, physics. 2008 Apr
1;70(5):1397-1402.
[36] Hachemi M, Couturier O, Vervueren L, Fosse P, Lacoeuille F, Urban T, et al. [(1)(8)F]FDG positron
emission tomography within two weeks of starting erlotinib therapy can predict response in non-small
cell lung cancer patients. PloS one. 2014;9(2):e87629.
[37] Ordu C, Selcuk NA, Erdogan E, Angin G, Gural Z, Memis H, et al. Does early PET/CT assesment of
response to chemotherapy predicts survival in patients with advanced stage non-small-cell lung cancer?
Medicine. 2014 Dec;93(28):e299.
[38] Cook GJ, O'Brien ME, Siddique M, Chicklore S, Loi HY, Sharma B, et al. Non-Small Cell Lung Cancer
Treated with Erlotinib: Heterogeneity of (18)F-FDG Uptake at PET-Association with Treatment Response
and Prognosis. Radiology. 2015 Sep;276(3):883-893.
[39] Han EJ, Yang YJ, Park JC, Park SY, Choi WH, Kim SH. Prognostic value of early response assessment using
18F-FDG PET/CT in chemotherapy-treated patients with non-small-cell lung cancer. Nuclear medicine
communications. 2015 Dec;36(12):1187-1194.
[40] Donati V, Boldrini L, Dell'Omodarme M, Prati MC, Faviana P, Camacci T, et al. Osteopontin expression
and prognostic significance in non-small cell lung cancer. Clinical cancer research : an official journal of
the American Association for Cancer Research. 2005 Sep 15;11(18):6459-6465.
[41] Fiala O, Pesek M, Finek J, Topolcan O, Racek J, Minarik M, et al. High serum level of C-reactive protein is
associated with worse outcome of patients with advanced-stage NSCLC treated with erlotinib. Tumour
Biol. 2015 Jun 19.
[42] Mendes F, Antunes C, Abrantes AM, Goncalves AC, Nobre-Gois I, Sarmento AB, et al. Lung cancer: the
immune system and radiation. Br J Biomed Sci. 2015;72(2):78-84.
[43] Ostheimer C, Bache M, Guttler A, Kotzsch M, Vordermark D. A pilot study on potential plasma hypoxia
markers in the radiotherapy of non-small cell lung cancer. Osteopontin, carbonic anhydrase IX and
vascular endothelial growth factor. Strahlentherapie und Onkologie : Organ der Deutschen
Rontgengesellschaft [et al]. 2014 Mar;190(3):276-282.
[44] Rud AK, Boye K, Oijordsbakken M, Lund-Iversen M, Halvorsen AR, Solberg SK, et al. Osteopontin is a
prognostic biomarker in non-small cell lung cancer. BMC Cancer. 2013;13:540.
[45] Sanmamed MF, Carranza-Rua O, Alfaro C, Onate C, Martin-Algarra S, Perez G, et al. Serum interleukin-8
reflects tumour burden and treatment response across malignancies of multiple tissue origins. Clin
Cancer Res. 2014 Nov 15;20(22):5697-5707.
[46] Wang J, Yi Y, Li B, Wang Z, Sun H, Zhang P, et al. CYFRA21-1 can predict the sensitivity to
chemoradiotherapy of non-small-cell lung carcinoma. Biomarkers. 2010 Nov;15(7):594-601.
[47] Wang J, Zhang N, Li B, Wang Z, Sun H, Yi Y, et al. Decline of serum CYFRA21-1 during chemoradiotherapy
of NSCLC: a probable predictive factor for tumour response. Tumour Biol. 2011 Aug;32(4):689-695.](https://image.slidesharecdn.com/0e20c58a-e59d-4f72-b721-87c0da20639d-160804091812/85/E-book-Thesis-Sara-Carvalho-158-320.jpg)
![GENERAL DISCUSSION, CONCLUDING REMARKS AND FUTURE PERSPECTIVES
159
[48] Zou XL, Wang C, Liu KE, Nie W, Ding ZY. Prognostic significance of osteopontin expression in non-small-
cell lung cancer: A meta-analysis. Mol Clin Oncol. 2015 May;3(3):633-638.
[49] Liu Y, Gu X, Lin Q, Tian T, Shao L, Yuan C, et al. Prognostic significance of osteopontin in patients with
non-small cell lung cancer: results from a meta-analysis. International journal of clinical and
experimental medicine. 2015;8(8):12765-12773.
[50] Jing X, Huang C, Zhou H, Li C, Fan L, Chen J, et al. Association between serum C-reactive protein value
and prognosis of patients with non-small cell lung cancer: a meta-analysis. International journal of
clinical and experimental medicine. 2015;8(7):10633-10639.
[51] Ilie M, Mazure NM, Hofman V, Ammadi RE, Ortholan C, Bonnetaud C, et al. High levels of carbonic
anhydrase IX in tumour tissue and plasma are biomarkers of poor prognostic in patients with non-small
cell lung cancer. British journal of cancer. 2010 May 25;102(11):1627-1635.
[52] Gomes M, Coelho A, Araujo A, Azevedo A, Teixeira AL, Catarino R, et al. IL-6 polymorphism in non-small
cell lung cancer: a prognostic value? Tumour Biol. 2015 May;36(5):3679-3684.
[53] Liao C, Yu Z, Guo W, Liu Q, Wu Y, Li Y, et al. Prognostic value of circulating inflammatory factors in non-
small cell lung cancer: a systematic review and meta-analysis. Cancer biomarkers : section A of Disease
markers. 2014;14(6):469-481.
[54] Zhang ZH, Han YW, Liang H, Wang LM. Prognostic value of serum CYFRA21-1 and CEA for non-small-cell
lung cancer. Cancer medicine. 2015 Nov;4(11):1633-1638.
[55] Bien E, Balcerska A. Serum soluble interleukin 2 receptor alpha in human cancer of adults and children: a
review. Biomarkers : biochemical indicators of exposure, response, and susceptibility to chemicals. 2008
Feb;13(1):1-26.
[56] De Vita F, Turitto G, di Grazia M, Frattolillo A, Catalano G. Analysis of interleukin-2/interleukin-2 receptor
system in advanced non-small-cell lung cancer. Tumouri. 1998 Jan-Feb;84(1):33-38.
[57] Fu HY, Li C, Yang W, Gai XD, Jia T, Lei YM, et al. FOXP3 and TLR4 protein expression are correlated in non-
small cell lung cancer: implications for tumour progression and escape. Acta histochemica. 2013
Mar;115(2):151-157.
[58] Kawashima O, Kamiyoshihara M, Sakata S, Endo K, Saito R, Morishita Y. The clinicopathological
significance of preoperative serum-soluble interleukin-2 receptor concentrations in operable non-small-
cell lung cancer patients. Annals of surgical oncology. 2000 Apr;7(3):239-245.
[59] Naumnik W, Chyczewska E. The clinical significance of serum soluble interleukin 2 receptor (sIL-2R)
concentration in lung cancer. Folia histochemica et cytobiologica / Polish Academy of Sciences, Polish
Histochemical and Cytochemical Society. 2001;39 Suppl 2:185-186.
[60] Oh JH, Craft JM, Townsend R, Deasy JO, Bradley JD, El Naqa I. A bioinformatics approach for biomarker
identification in radiation-induced lung inflammation from limited proteomics data. Journal of proteome
research. 2011 Mar 4;10(3):1406-1415.
[61] Rades D, Setter C, Dunst J, Dahl O, Schild SE, Noack F. Prognostic impact of VEGF and VEGF receptor 1
(FLT1) expression in patients irradiated for stage II/III non-small cell lung cancer (NSCLC).
Strahlentherapie und Onkologie : Organ der Deutschen Rontgengesellschaft [et al]. 2010
Jun;186(6):307-314.
[62] Samara KD, Antoniou KM, Karagiannis K, Margaritopoulos G, Lasithiotaki I, Koutala E, et al. Expression
profiles of Toll-like receptors in non-small cell lung cancer and idiopathic pulmonary fibrosis.
International journal of oncology. 2012 May;40(5):1397-1404.
[63] Zegers CM, Rekers NH, Quaden DH, Lieuwes NG, Yaromina A, Germeraad WT, et al. Radiotherapy
combined with the immunocytokine L19-IL2 provides long-lasting antitumour effects. Clinical cancer
research : an official journal of the American Association for Cancer Research. 2015 Mar 1;21(5):1151-
1160.
[64] Rekers NH, Zegers CM, Germeraad WT, Dubois L, Lambin P. Long-lasting antitumour effects provided by
radiotherapy combined with the immunocytokine L19-IL2. Oncoimmunology. 2015 Aug;4(8):e1021541.
[65] Rekers NH, Zegers CM, Yaromina A, Lieuwes NG, Biemans R, Senden-Gijsbers BL, et al. Combination of
radiotherapy with the immunocytokine L19-IL2: Additive effect in a NK cell dependent tumour model.](https://image.slidesharecdn.com/0e20c58a-e59d-4f72-b721-87c0da20639d-160804091812/85/E-book-Thesis-Sara-Carvalho-159-320.jpg)
![CHAPTER 9
160
Radiotherapy and oncology : journal of the European Society for Therapeutic Radiology and Oncology.
2015 Sep;116(3):438-442.
[66] Carrizosa DR, Gold KA. New strategies in immunotherapy for non-small cell lung cancer. Translational
lung cancer research. 2015 Oct;4(5):553-559.
[67] Simone CB, 2nd, Burri SH, Heinzerling JH. Novel radiotherapy approaches for lung cancer: combining
radiation therapy with targeted and immunotherapies. Translational lung cancer research. 2015
Oct;4(5):545-552.
[68] Li BT, Lou E, Hsu M, Yu HA, Naidoo J, Zauderer MG, et al. Serum Biomarkers Associated with Clinical
Outcomes Fail to Predict Brain Metastases in Patients with Stage IV Non-Small Cell Lung Cancers. PloS
one. 2016;11(1):e0146063.
[69] Li X, Asmitananda T, Gao L, Gai D, Song Z, Zhang Y, et al. Biomarkers in the lung cancer diagnosis: a
clinical perspective. Neoplasma. 2012;59(5):500-507.
[70] Subramaniam S, Thakur RK, Yadav VK, Nanda R, Chowdhury S, Agrawal A. Lung cancer biomarkers: State
of the art. Journal of carcinogenesis. 2013;12:3.
[71] Brustugun OT. Hypoxia as a cause of treatment failure in non-small cell carcinoma of the lung. Seminars
in radiation oncology. 2015 Apr;25(2):87-92.
[72] Yip C, Blower PJ, Goh V, Landau DB, Cook GJ. Molecular imaging of hypoxia in non-small-cell lung cancer.
European journal of nuclear medicine and molecular imaging. 2015 May;42(6):956-976.
[73] Trigonis I, Koh PK, Taylor B, Tamal M, Ryder D, Earl M, et al. Early reduction in tumour [18F]fluoro-
thymidine (FLT) uptake in patients with non-small cell lung cancer (NSCLC) treated with radiotherapy
alone. European journal of nuclear medicine and molecular imaging. 2014 Apr;41(4):682-693.
[74] Prabhu RS, Hanasoge S, Magliocca KR, Hall WA, Chen SA, Higgins KA, et al. Lymph node ratio influence on
risk of head and neck cancer locoregional recurrence after initial surgical resection: implications for
adjuvant therapy. Head & neck. 2015 Jun;37(6):777-782.
[75] Farjah F, Madtes DK, Wood DE, Flum DR, Zadworny ME, Waworuntu R, et al. Vascular endothelial growth
factor C complements the ability of positron emission tomography to predict nodal disease in lung
cancer. The Journal of thoracic and cardiovascular surgery. 2015 Oct;150(4):796-803 e792.
[76] Aerts HJ, Velazquez ER, Leijenaar RT, Parmar C, Grossmann P, Carvalho S, et al. Decoding tumour
phenotype by noninvasive imaging using a quantitative radiomics approach. Nature communications.
2014;5:4006.](https://image.slidesharecdn.com/0e20c58a-e59d-4f72-b721-87c0da20639d-160804091812/85/E-book-Thesis-Sara-Carvalho-160-320.jpg)

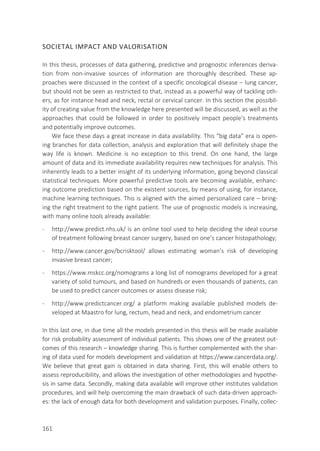
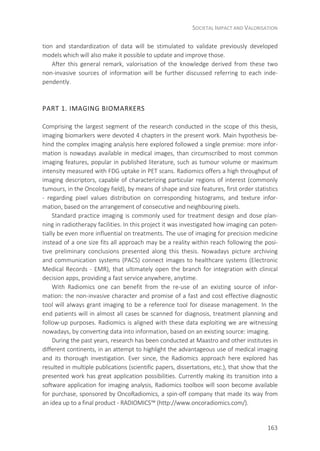
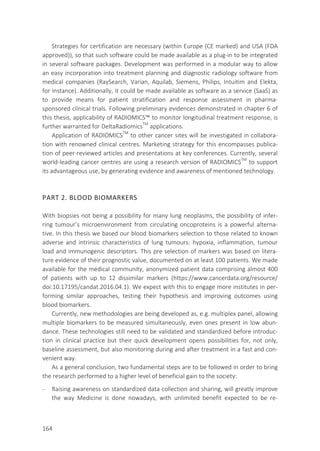
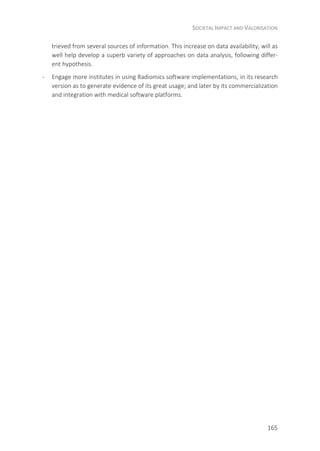


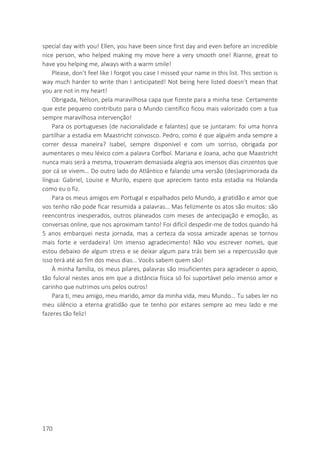

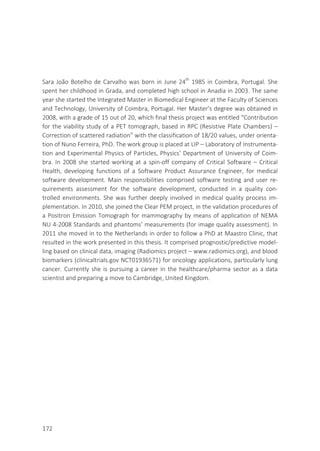

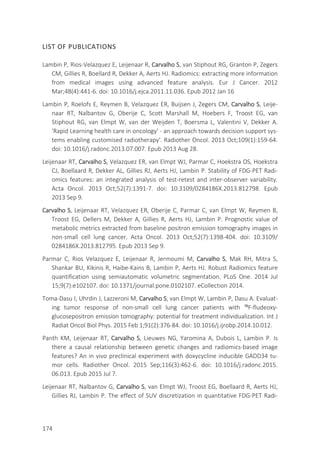
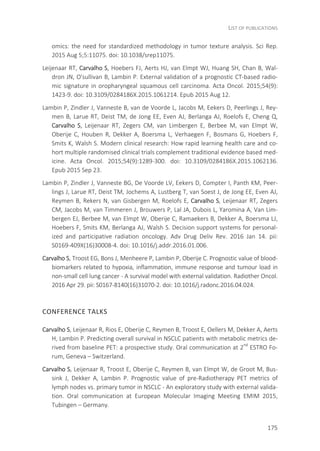


![[ASGO 2019] Artificial Intelligence in Medicine](https://cdn.slidesharecdn.com/ss_thumbnails/asgo2019medicalai191010-191010155811-thumbnail.jpg?width=640&height=640&fit=bounds)


