Download as PDF, PPTX


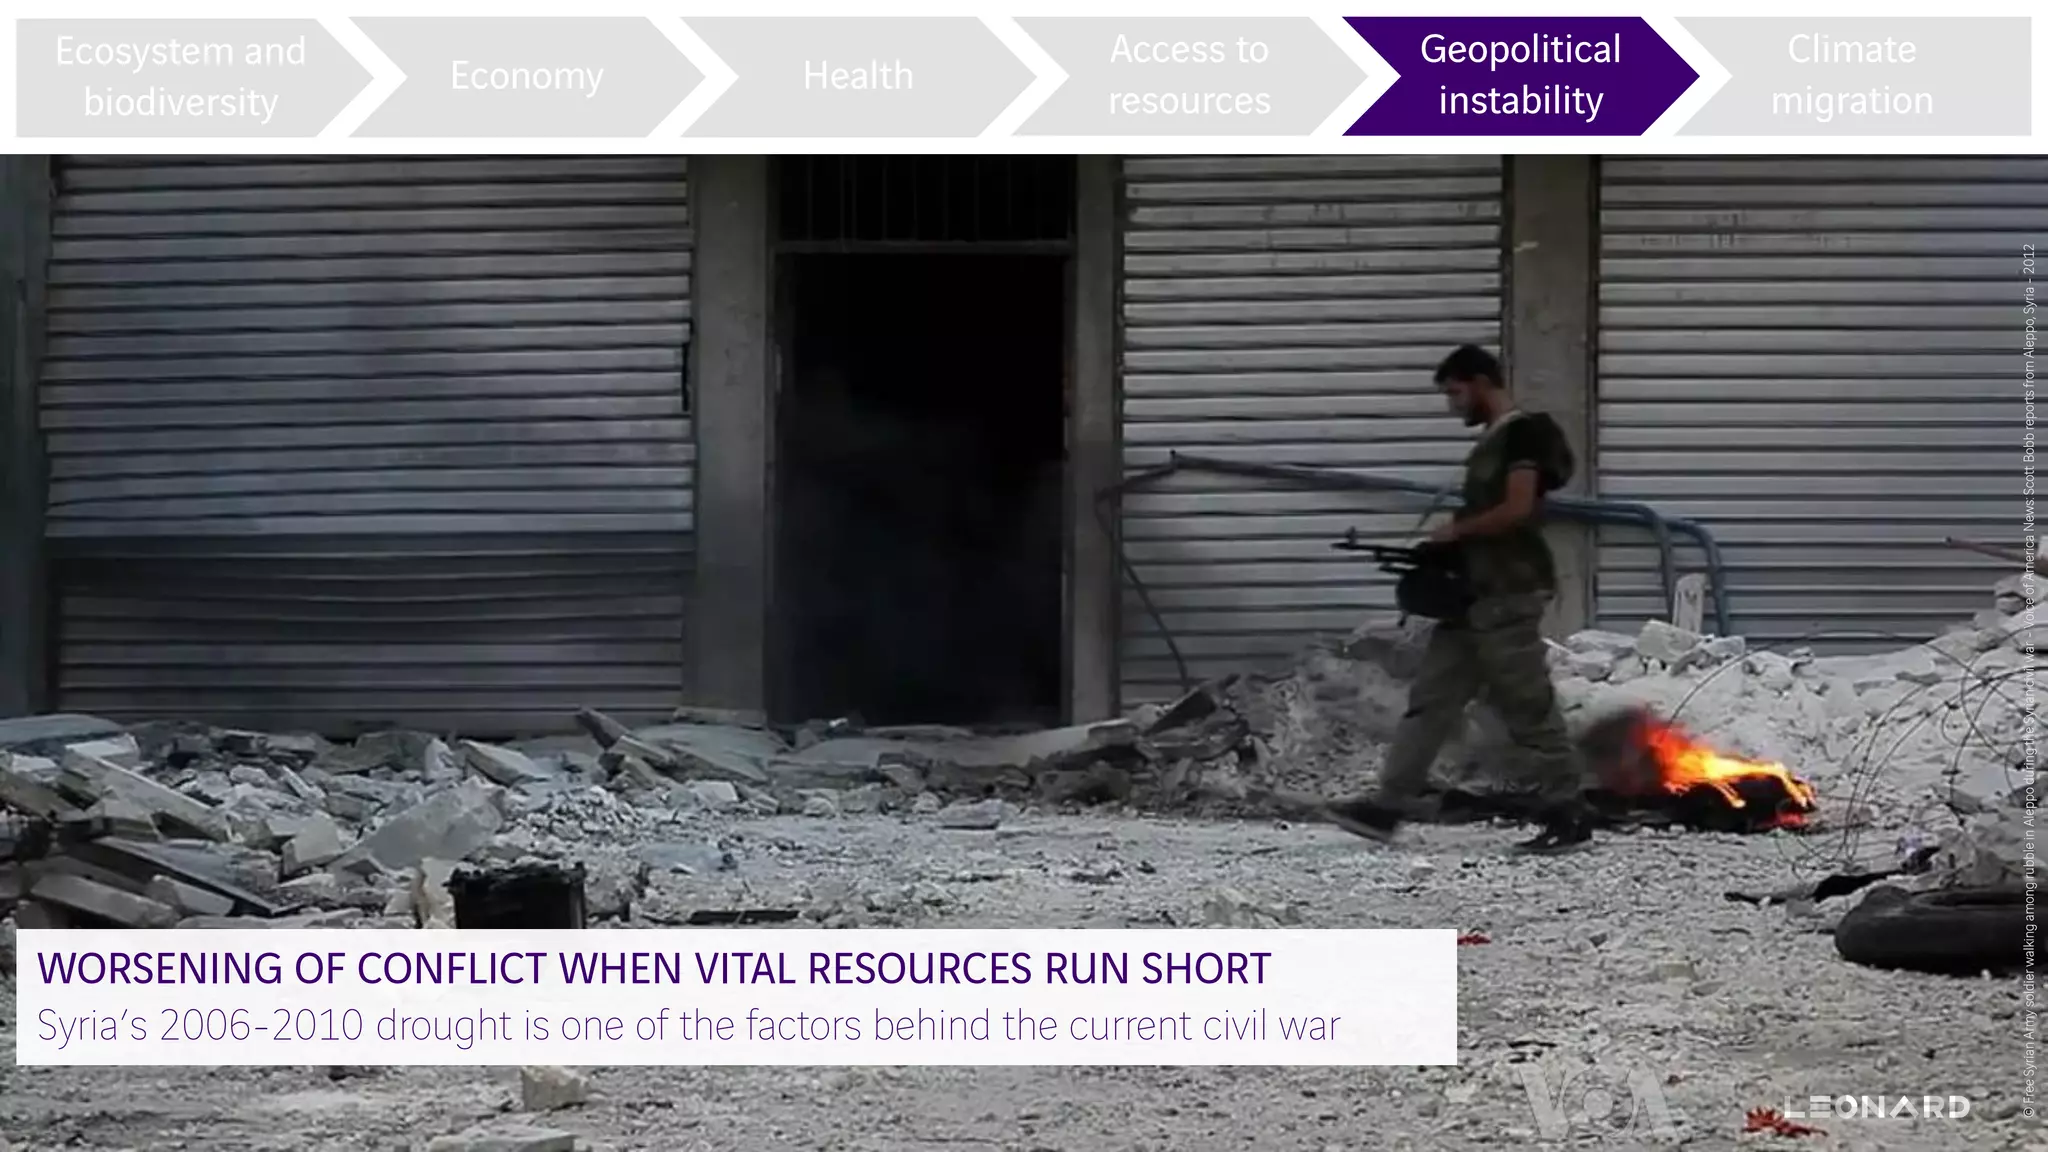
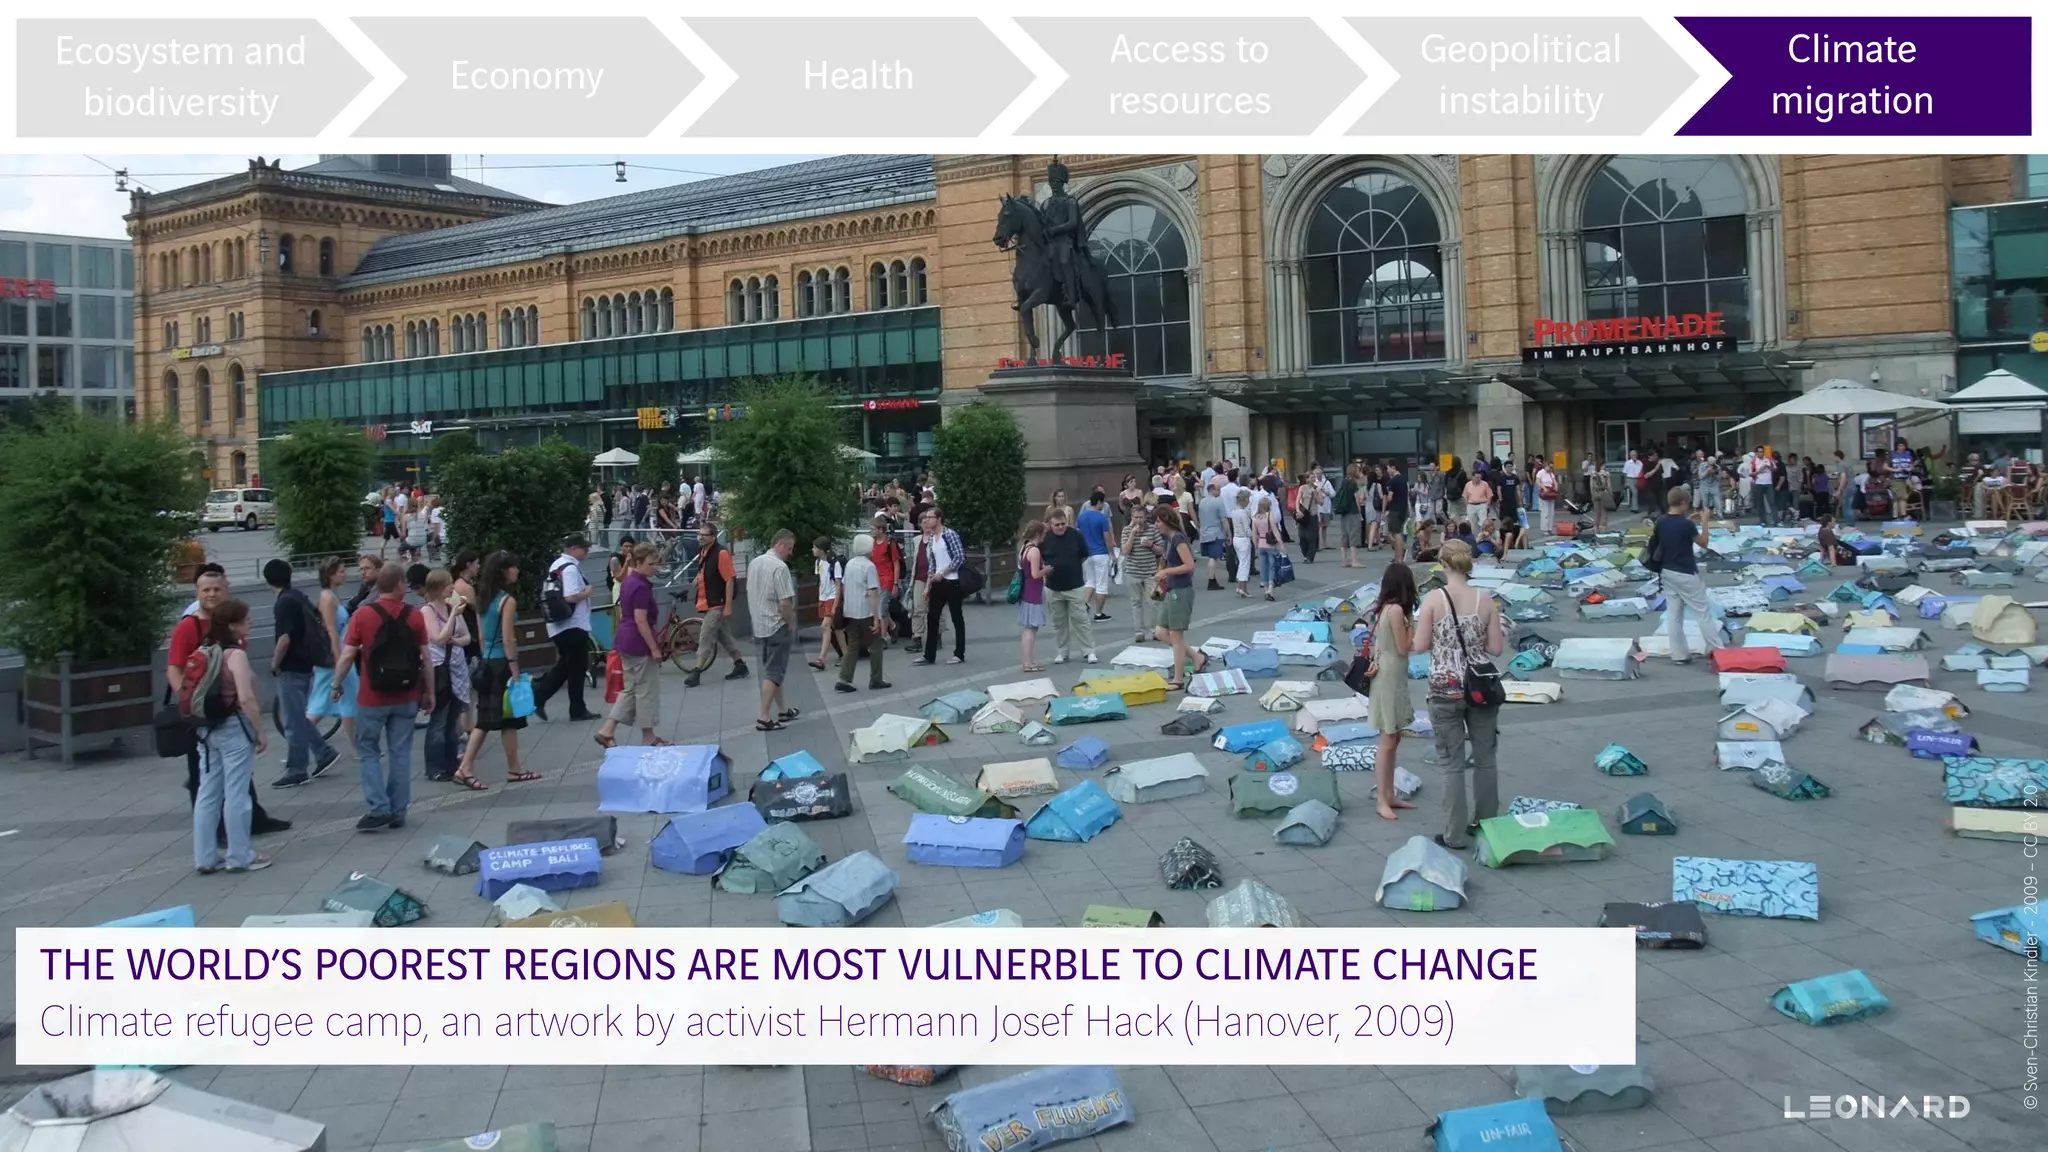


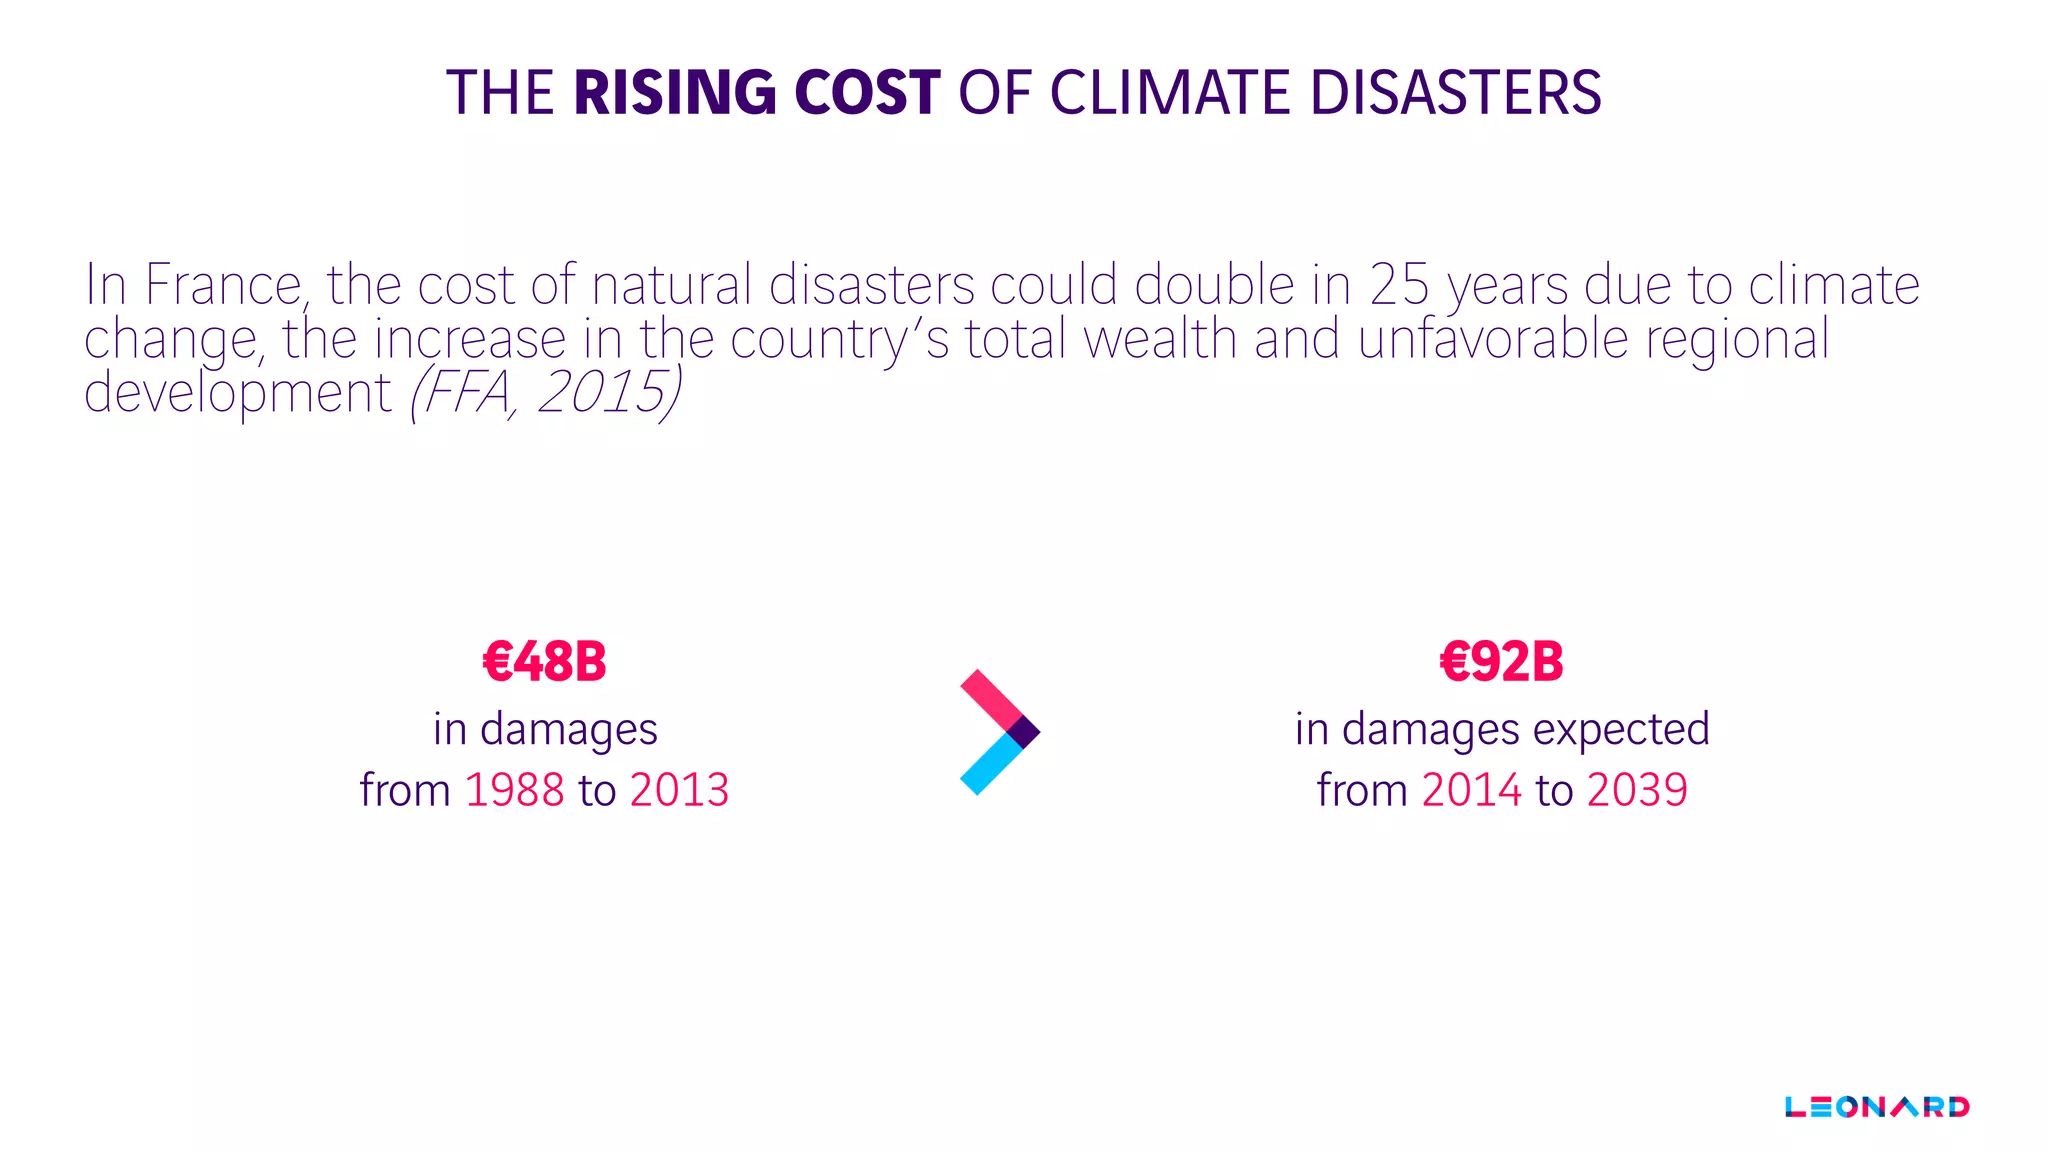
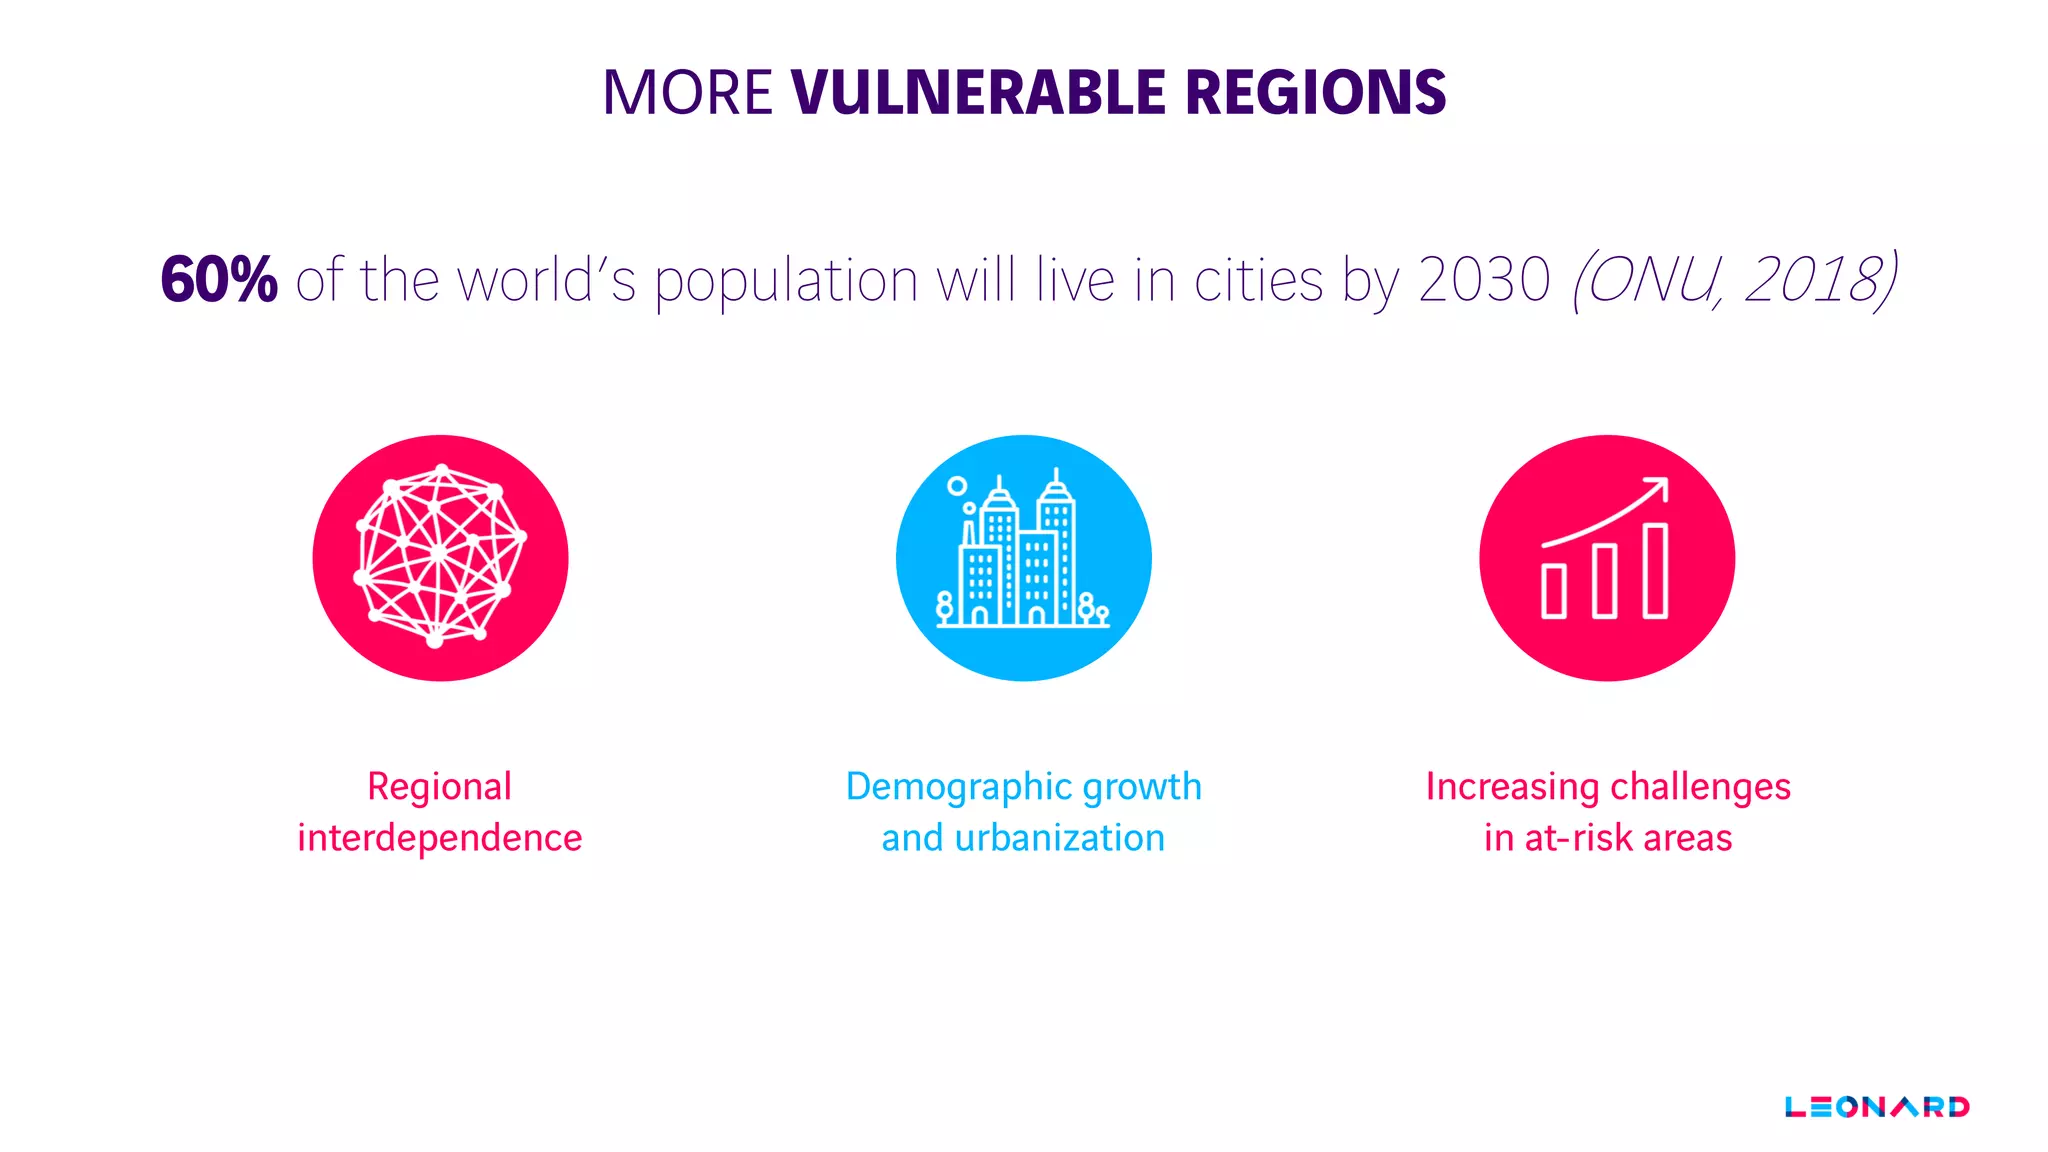


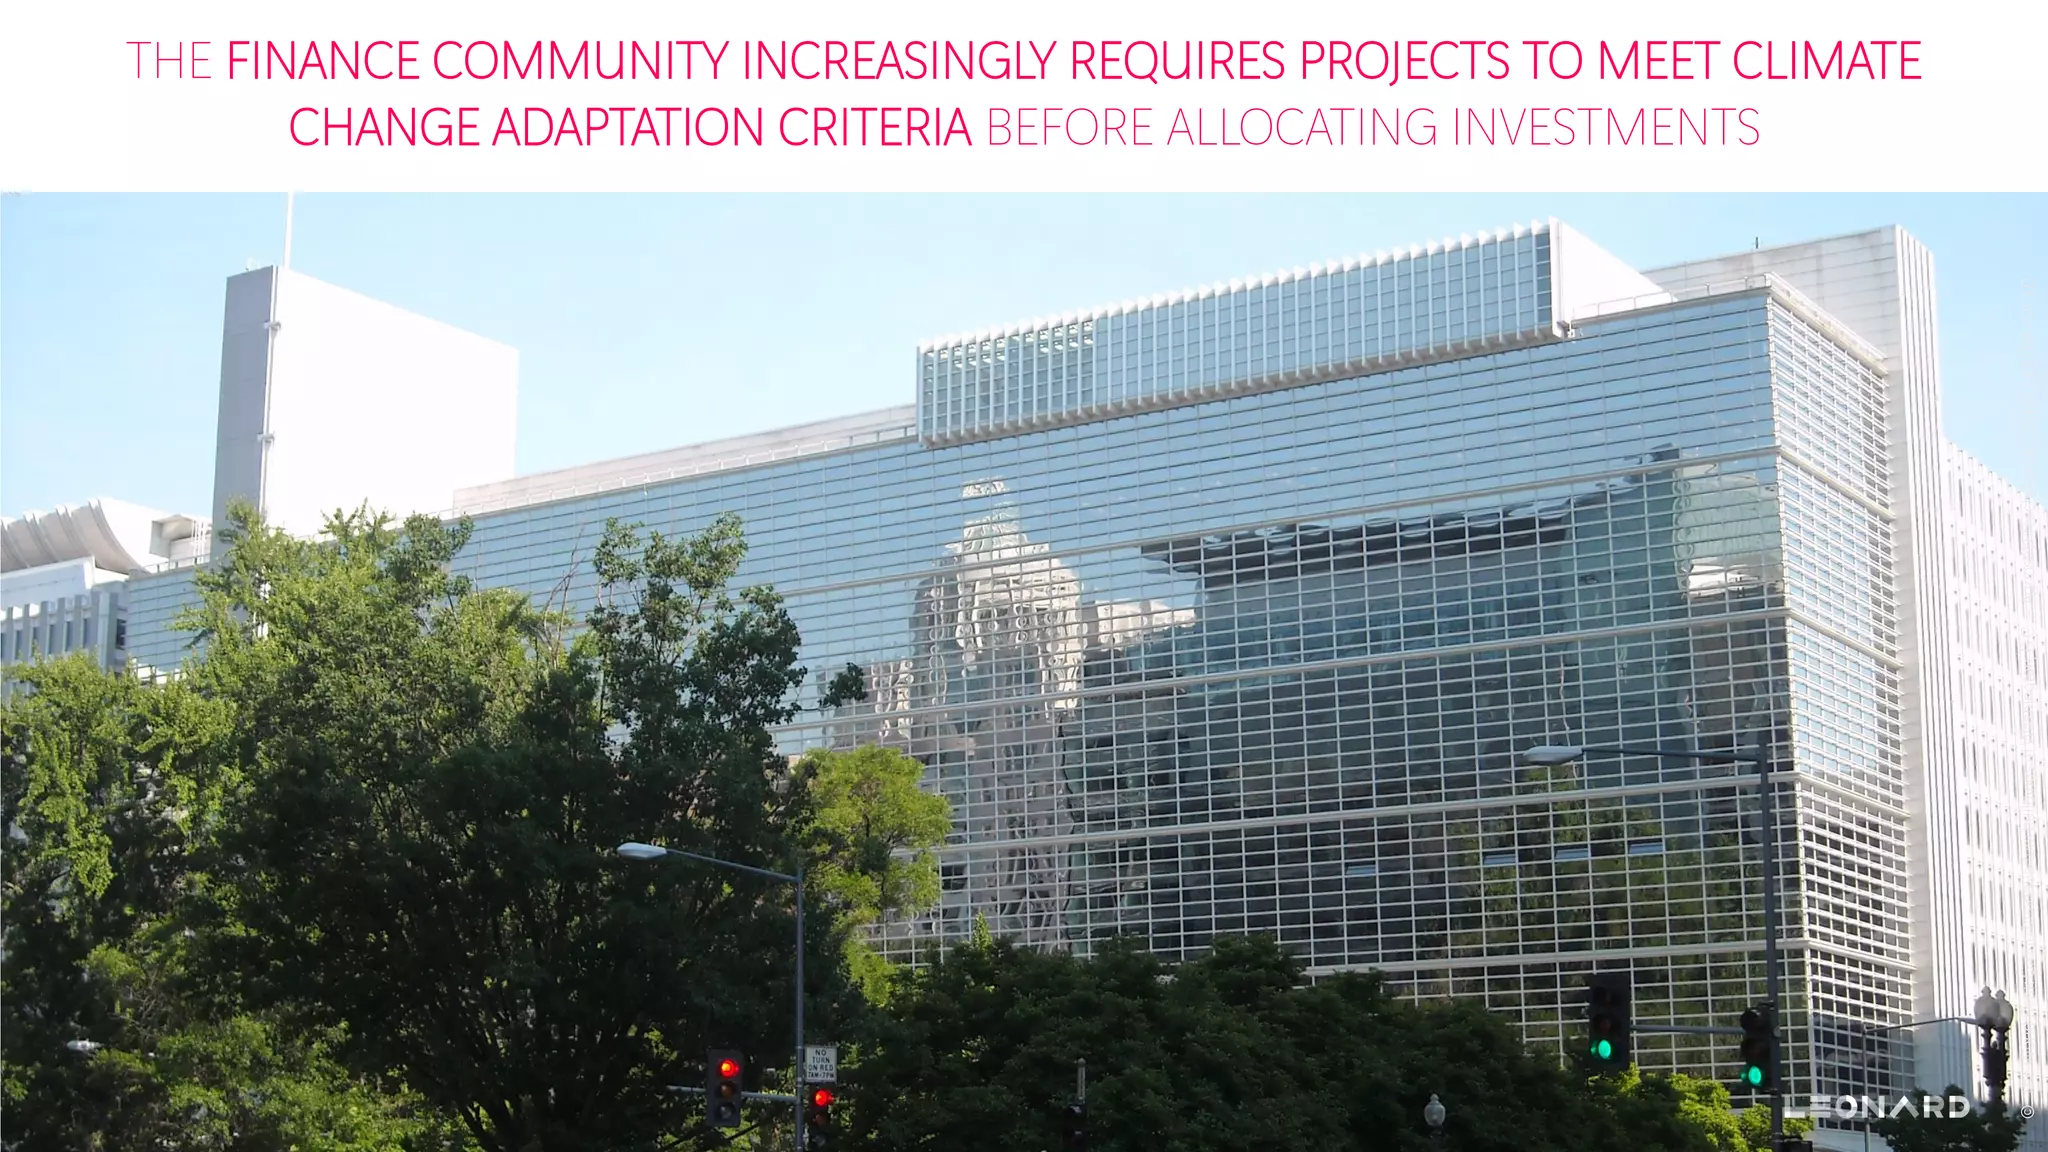
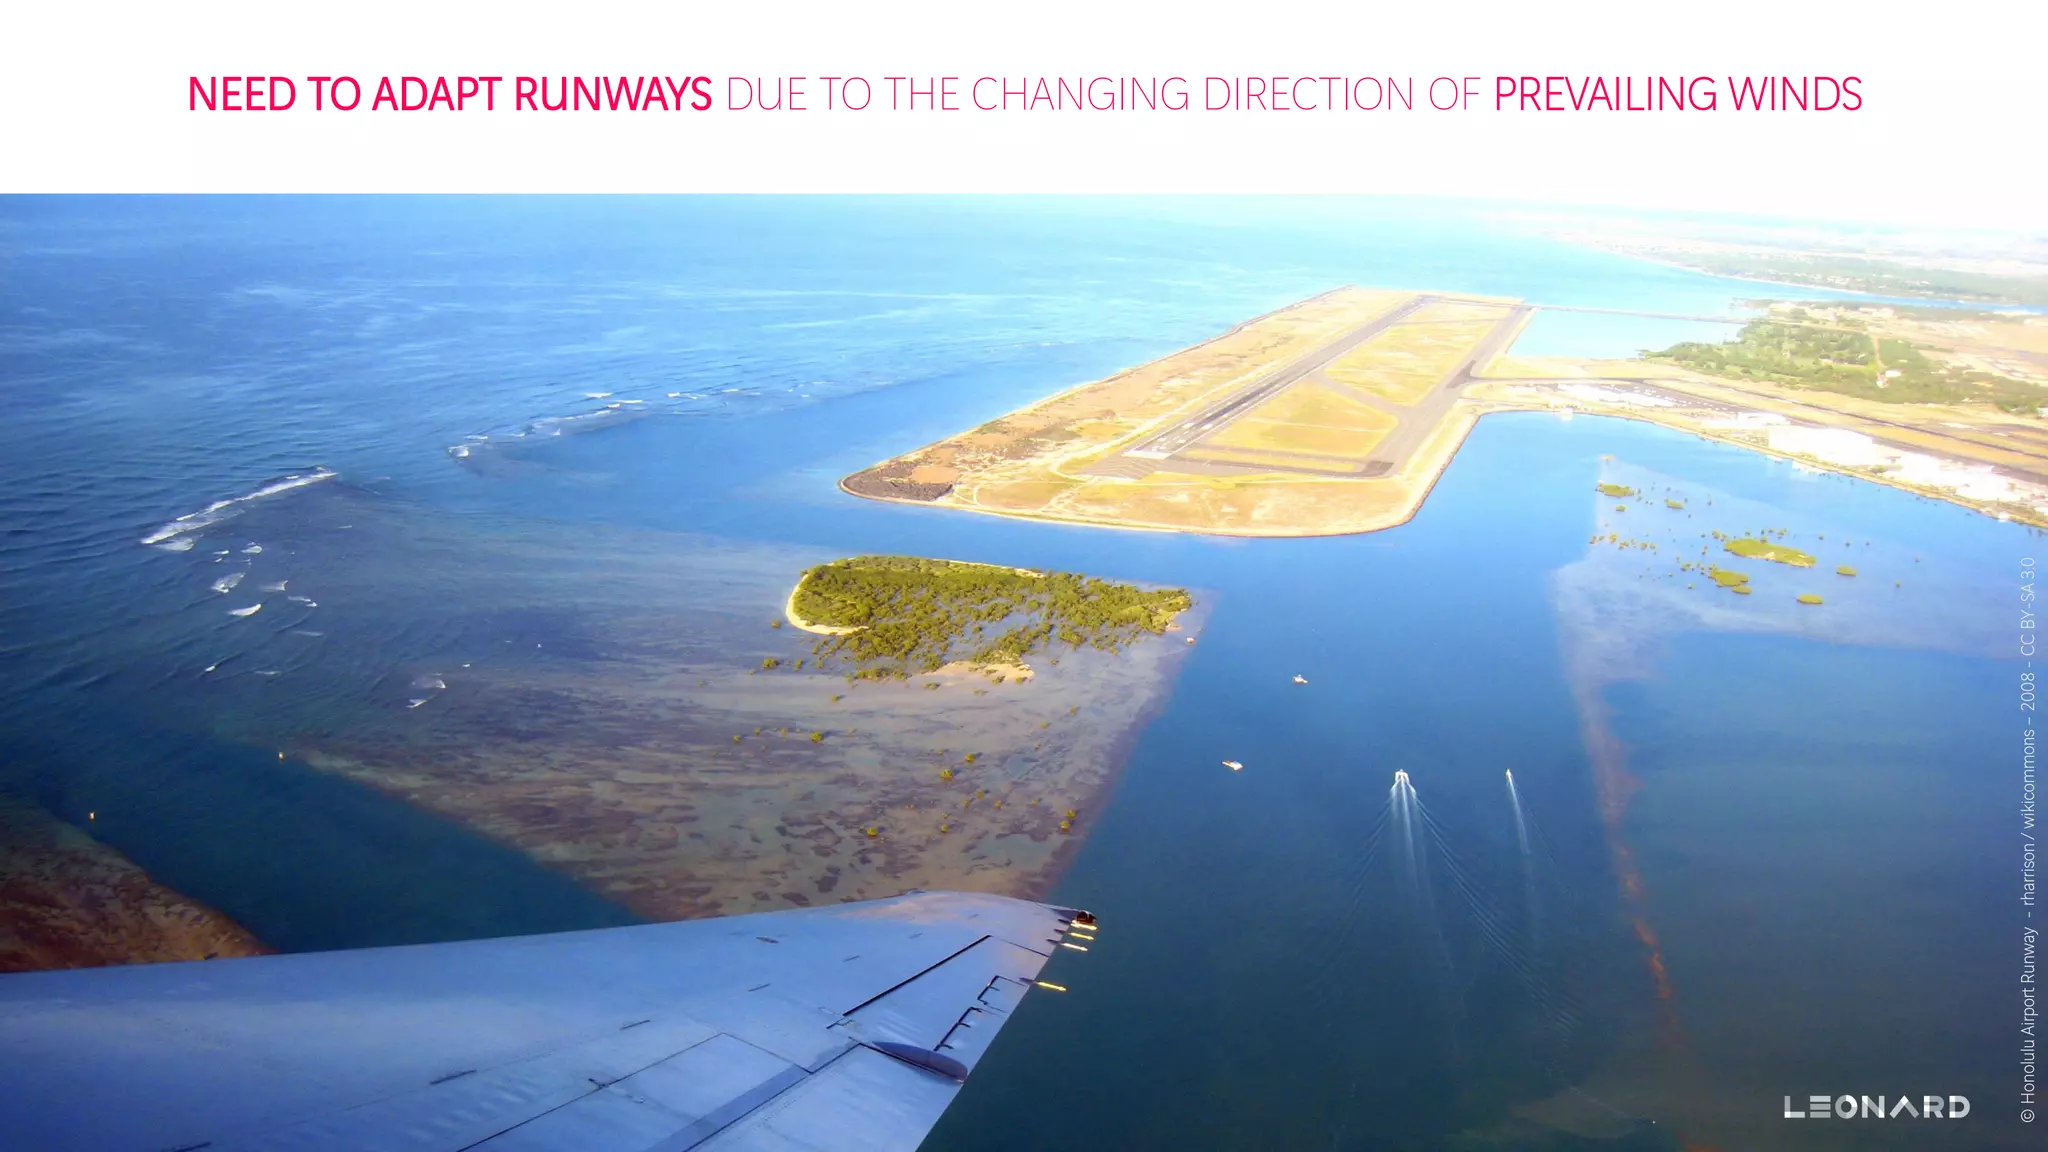


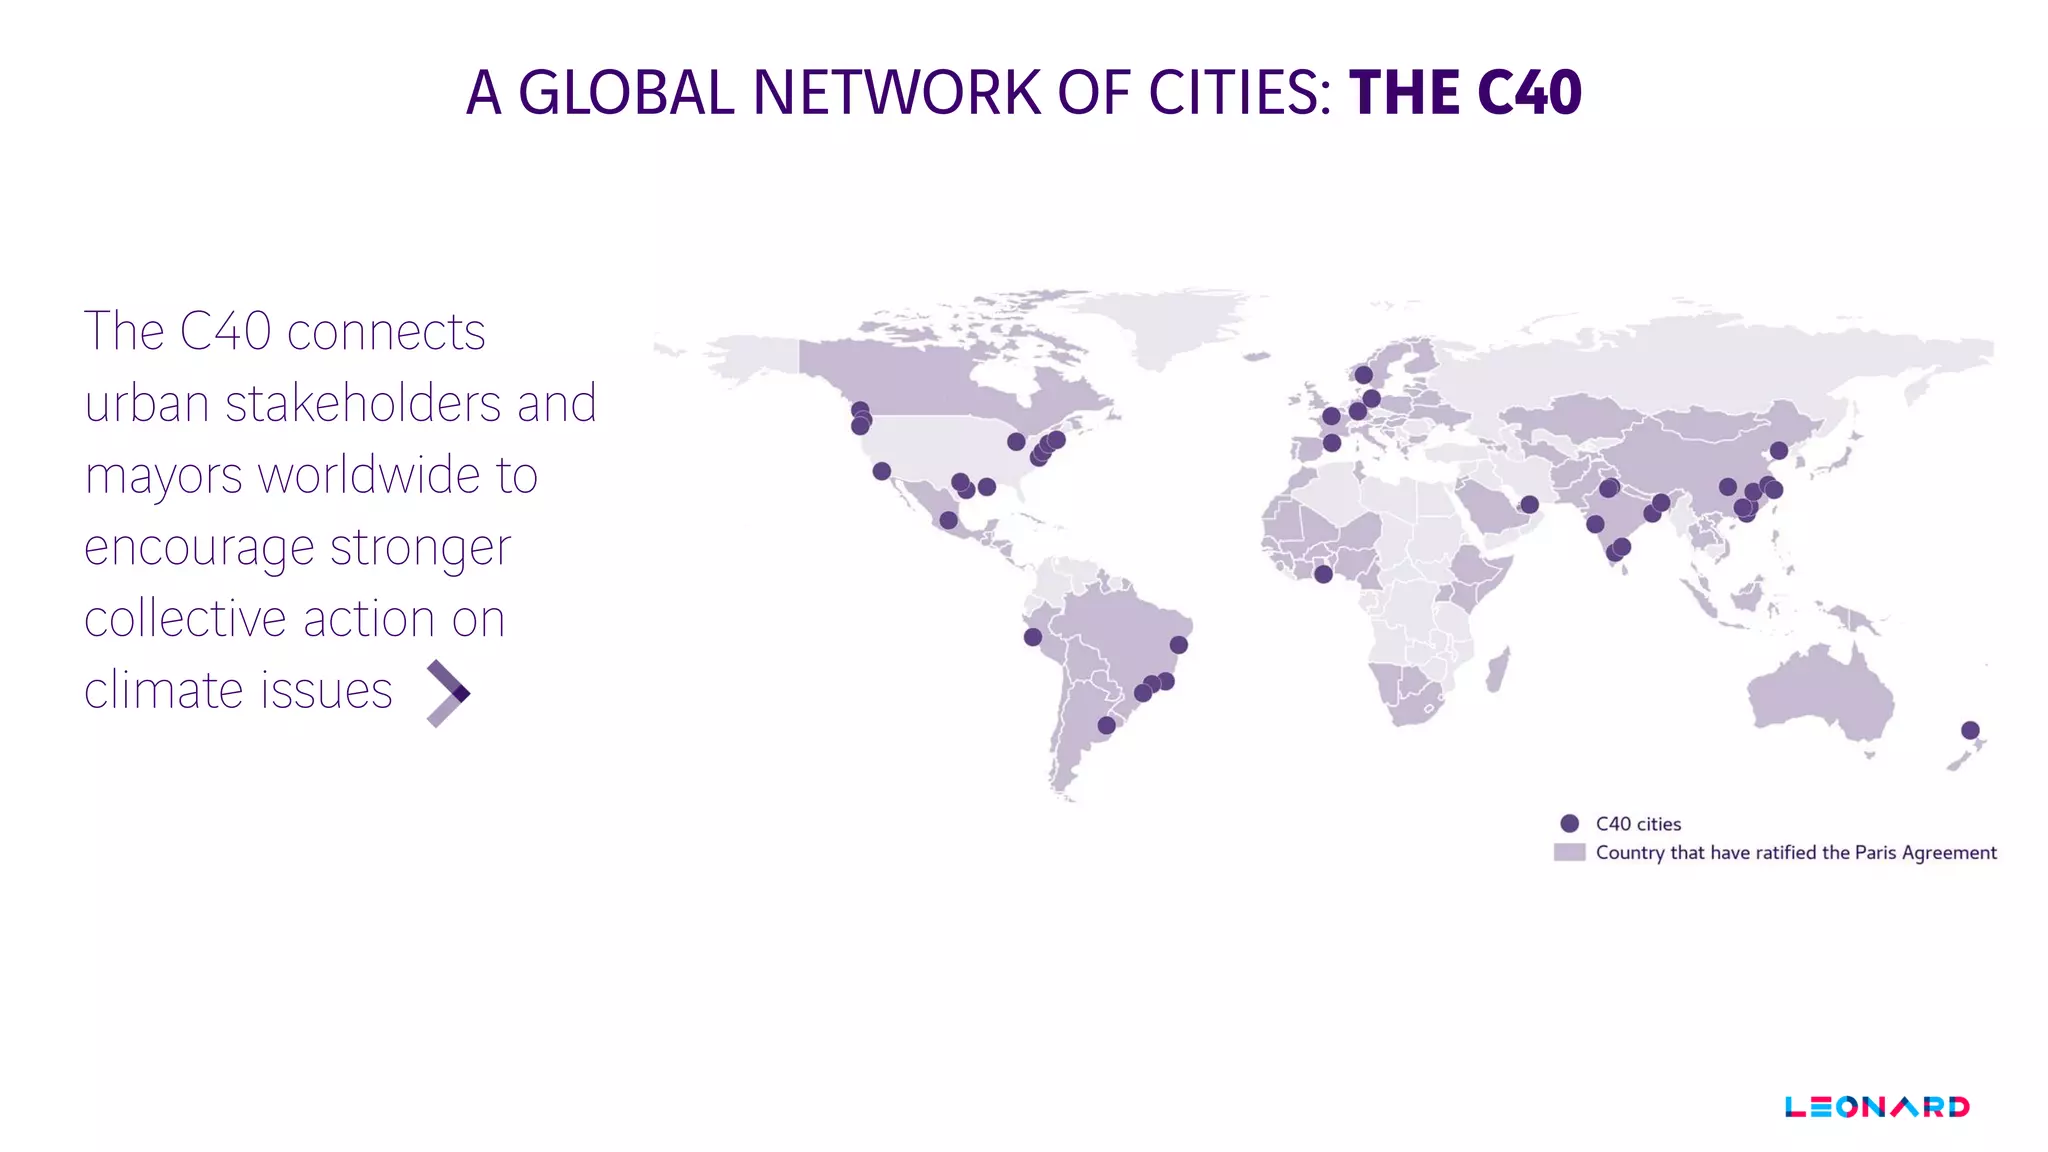
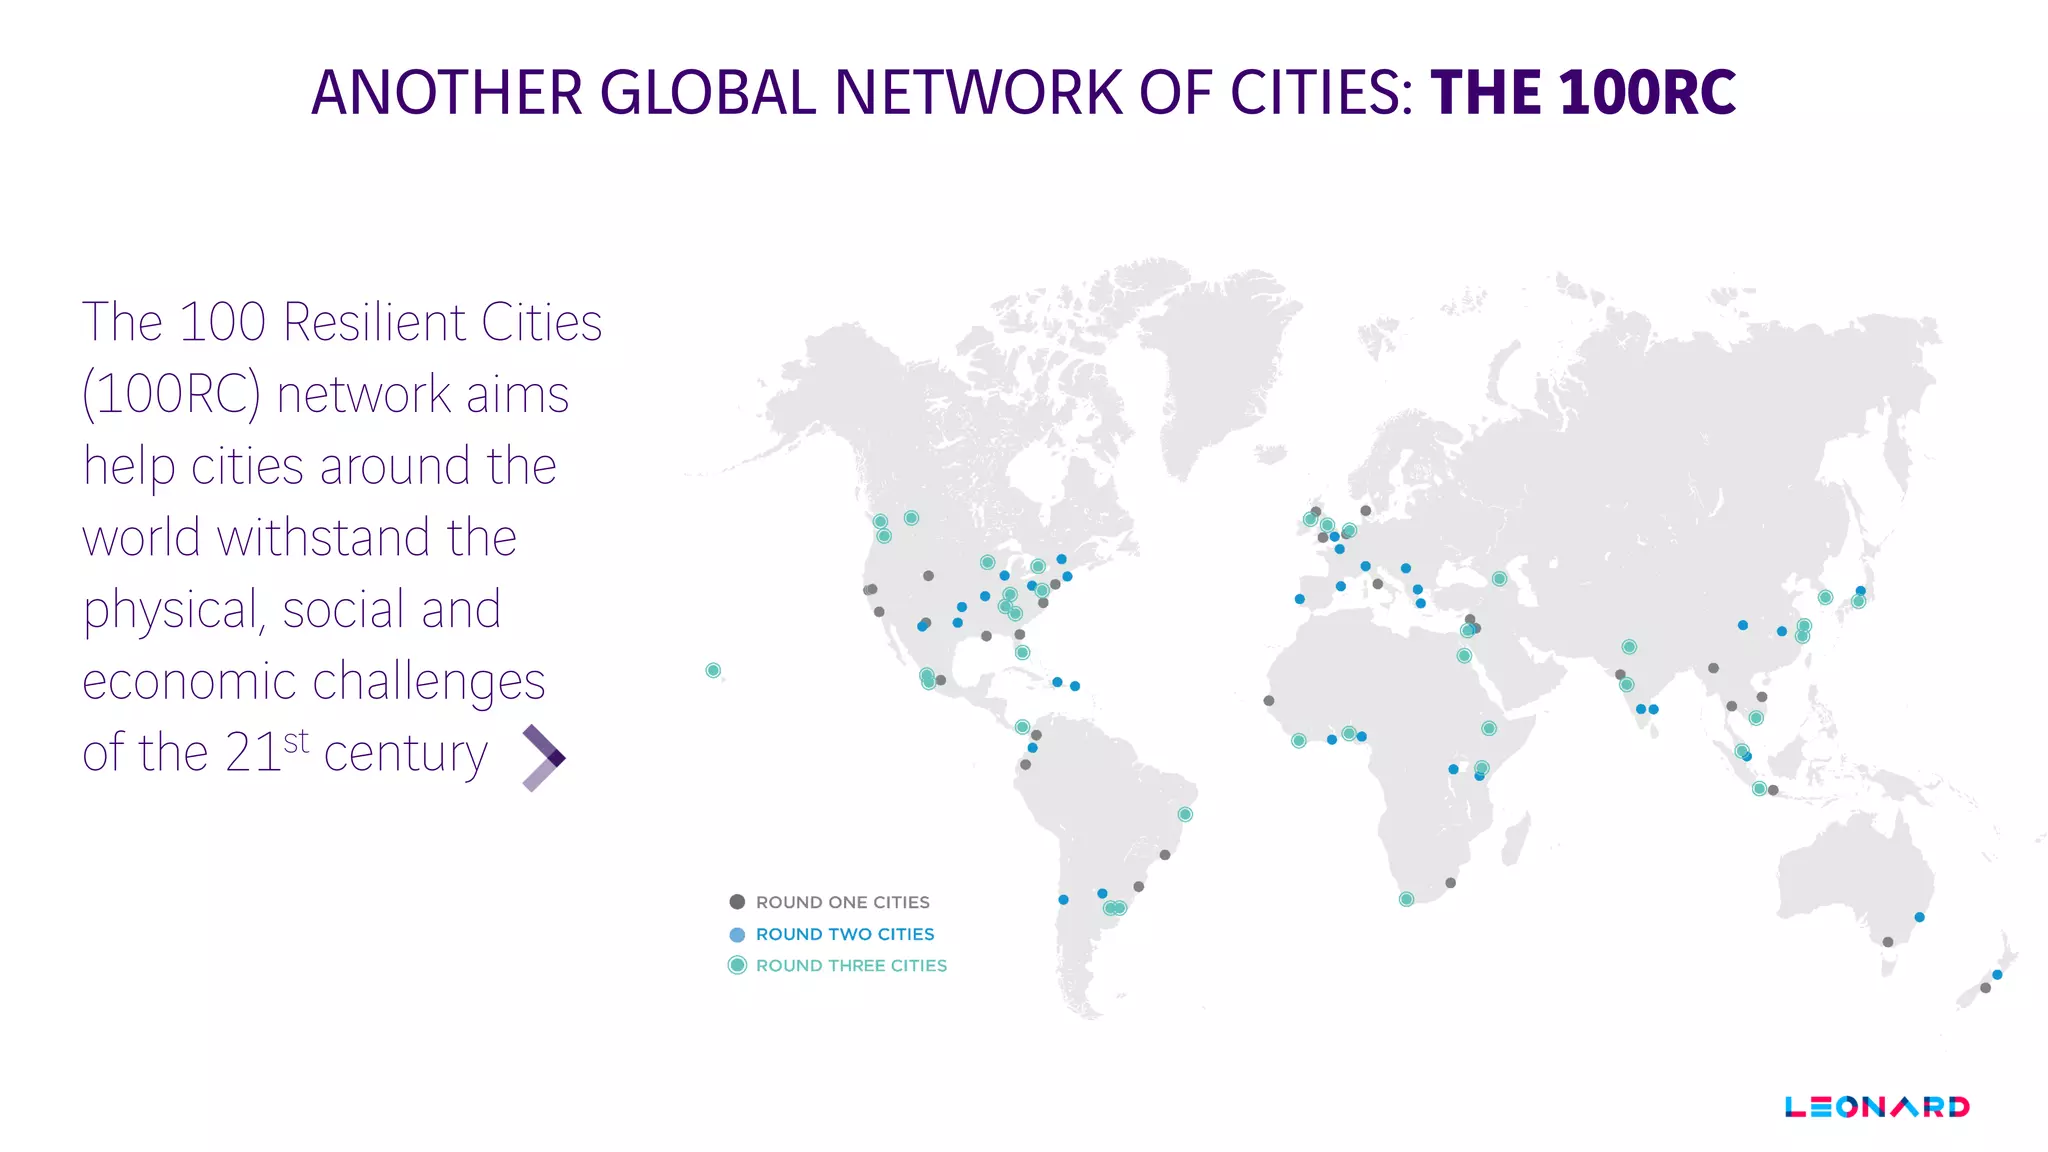


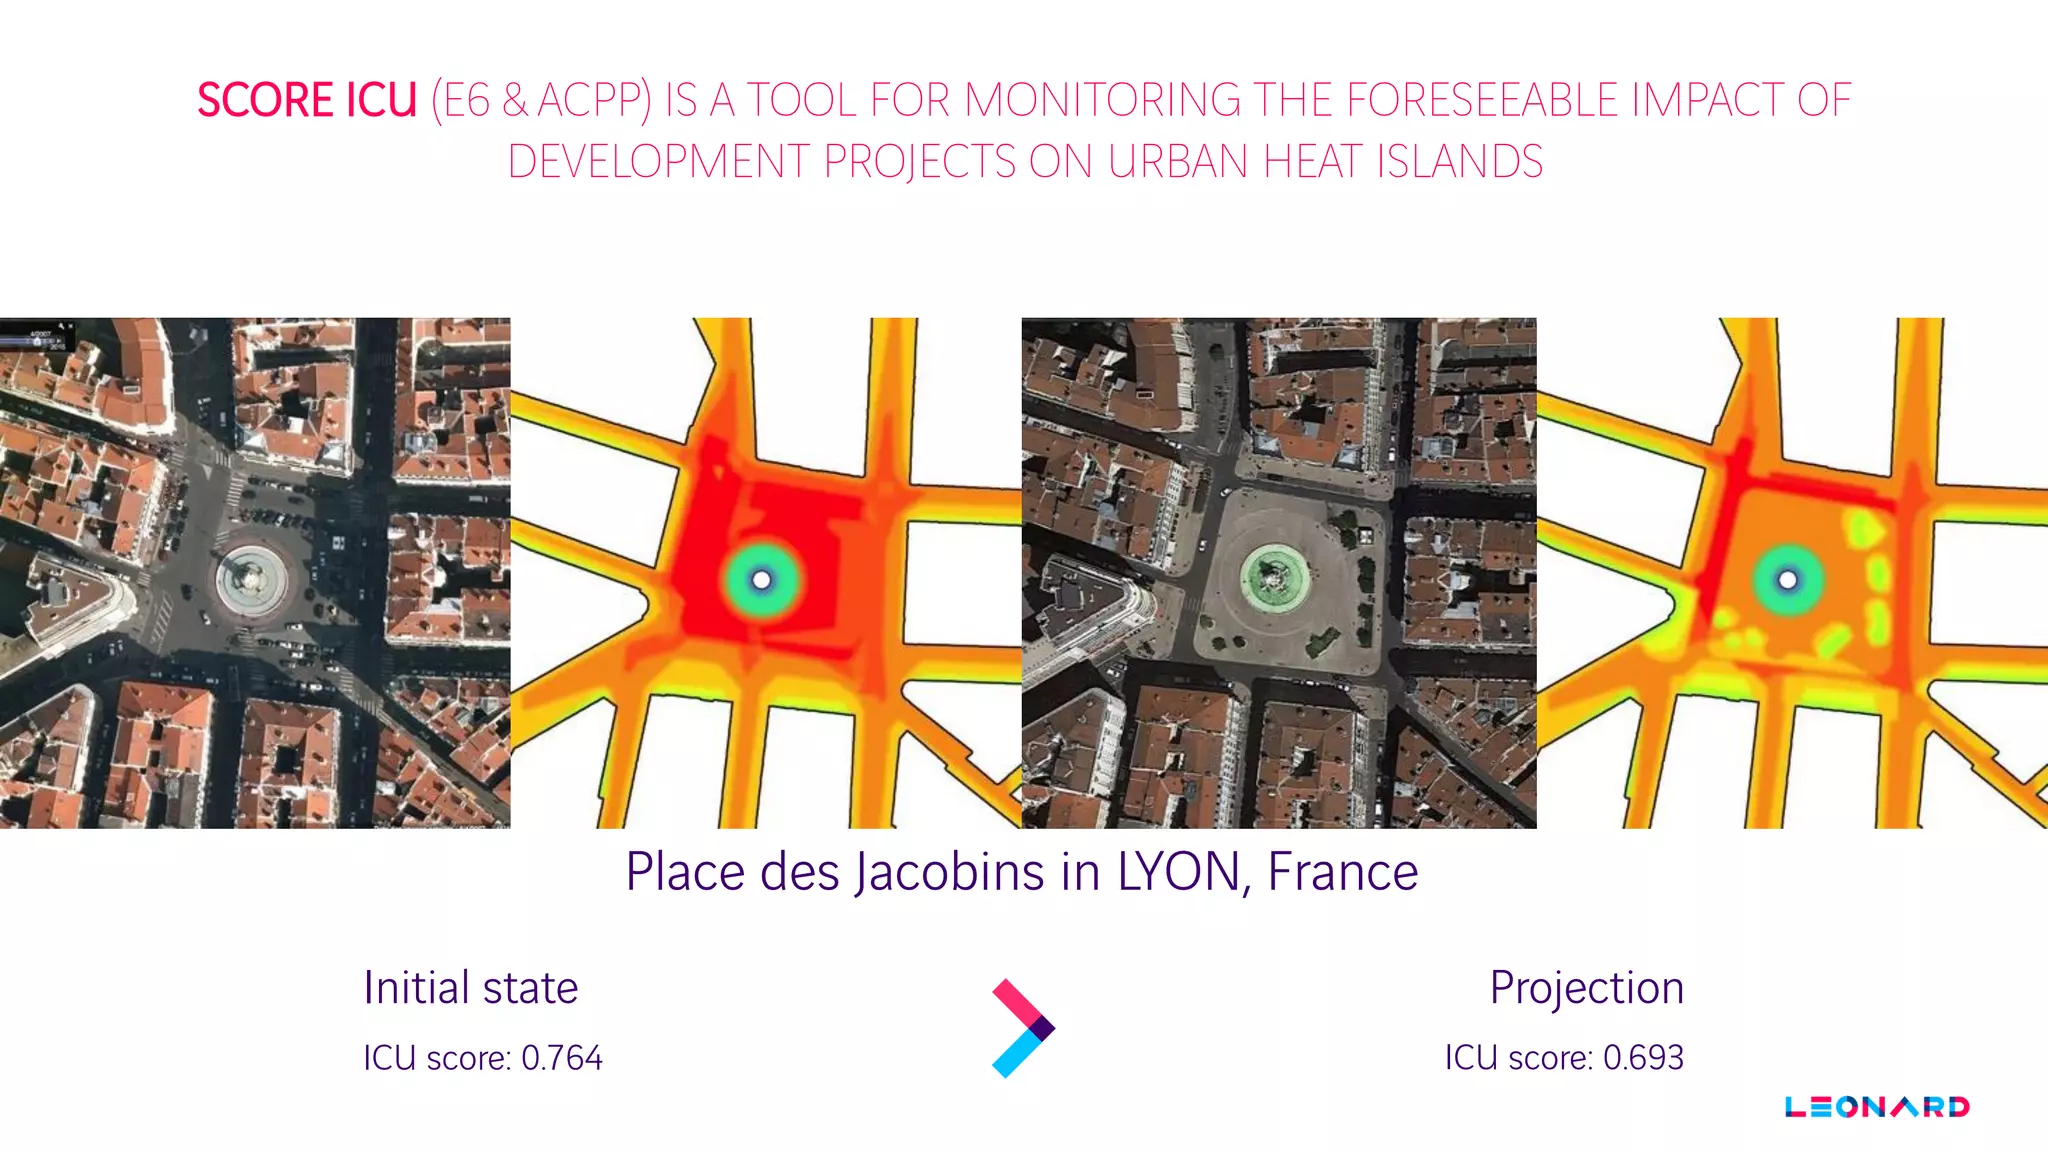
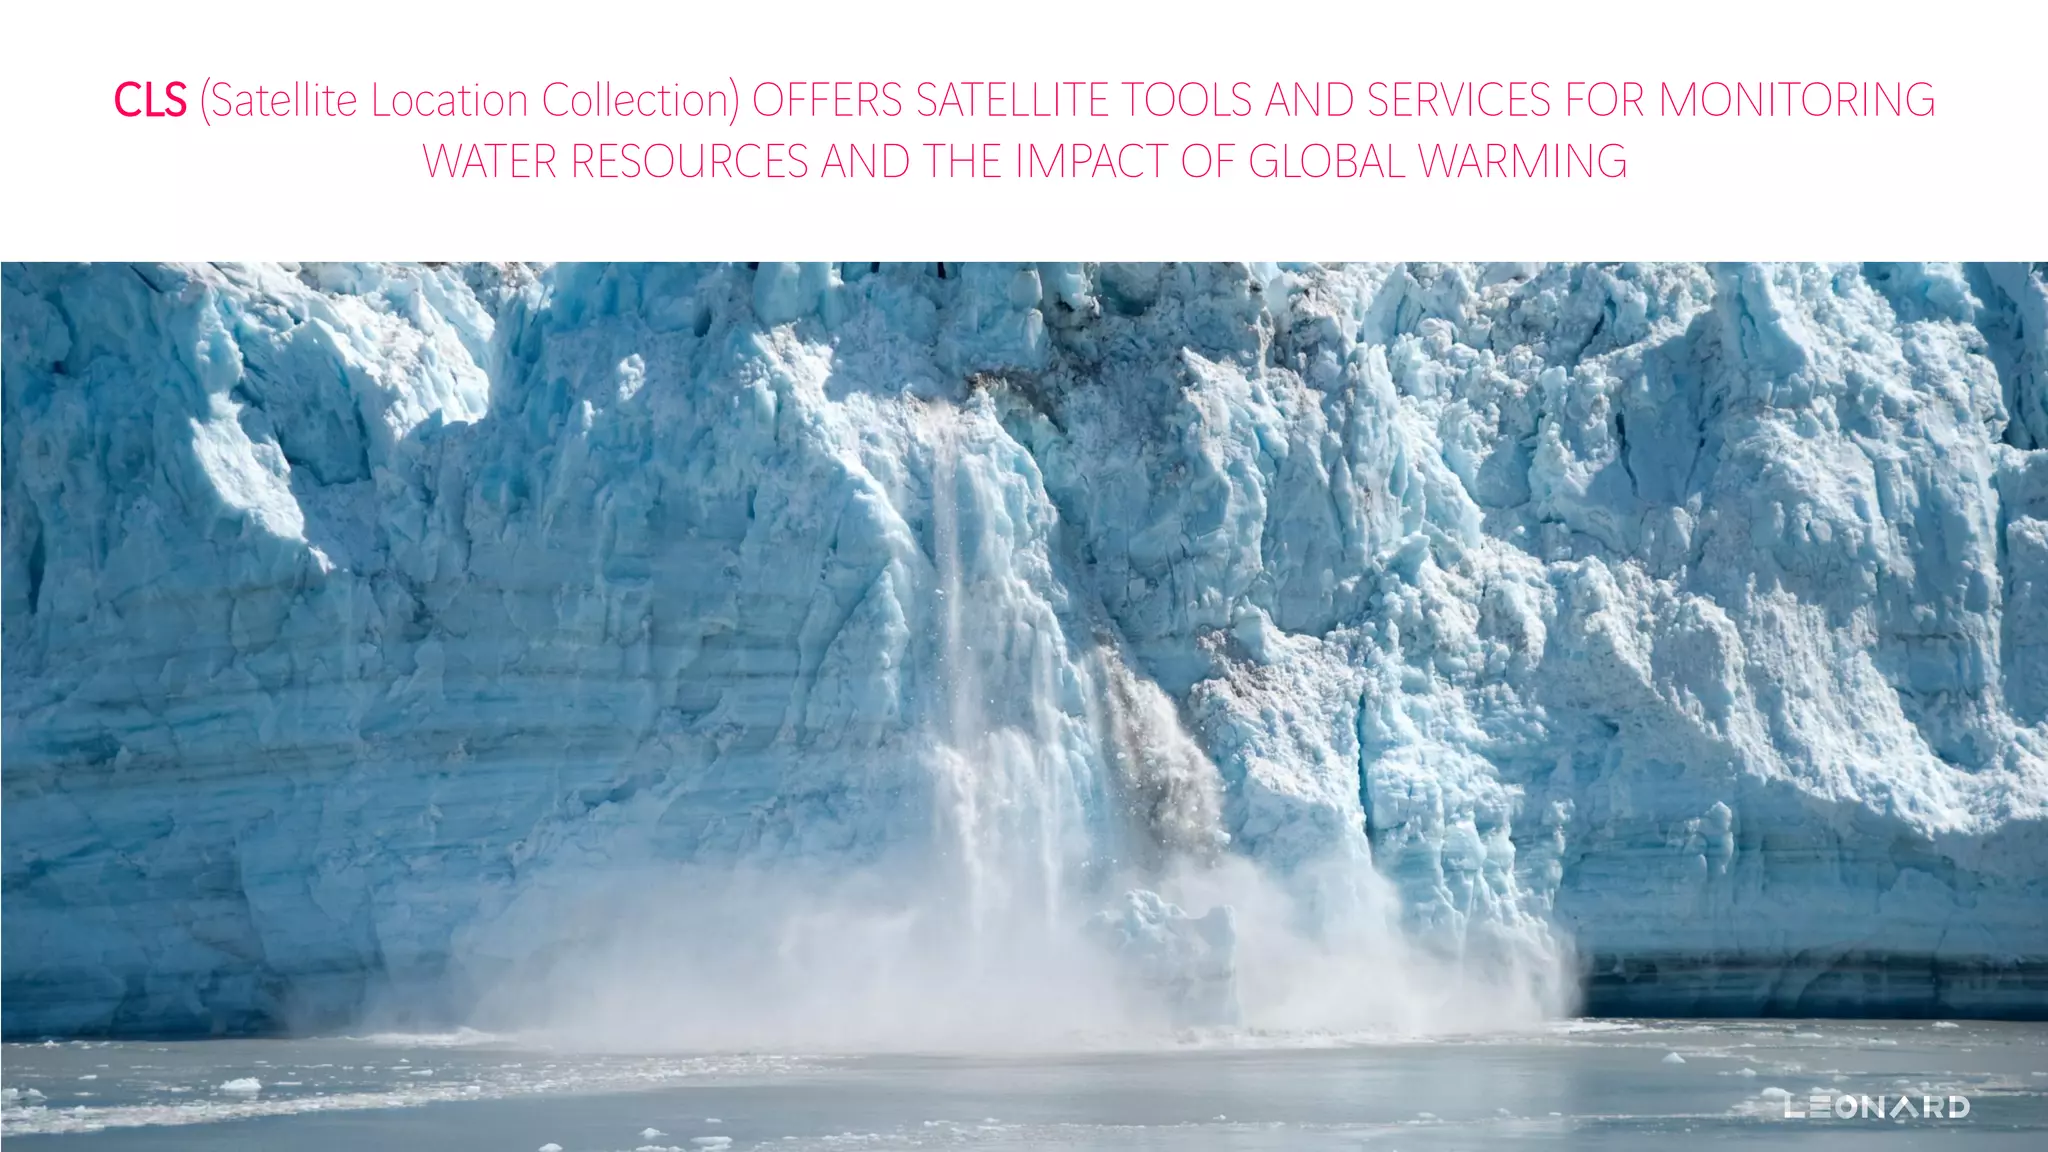
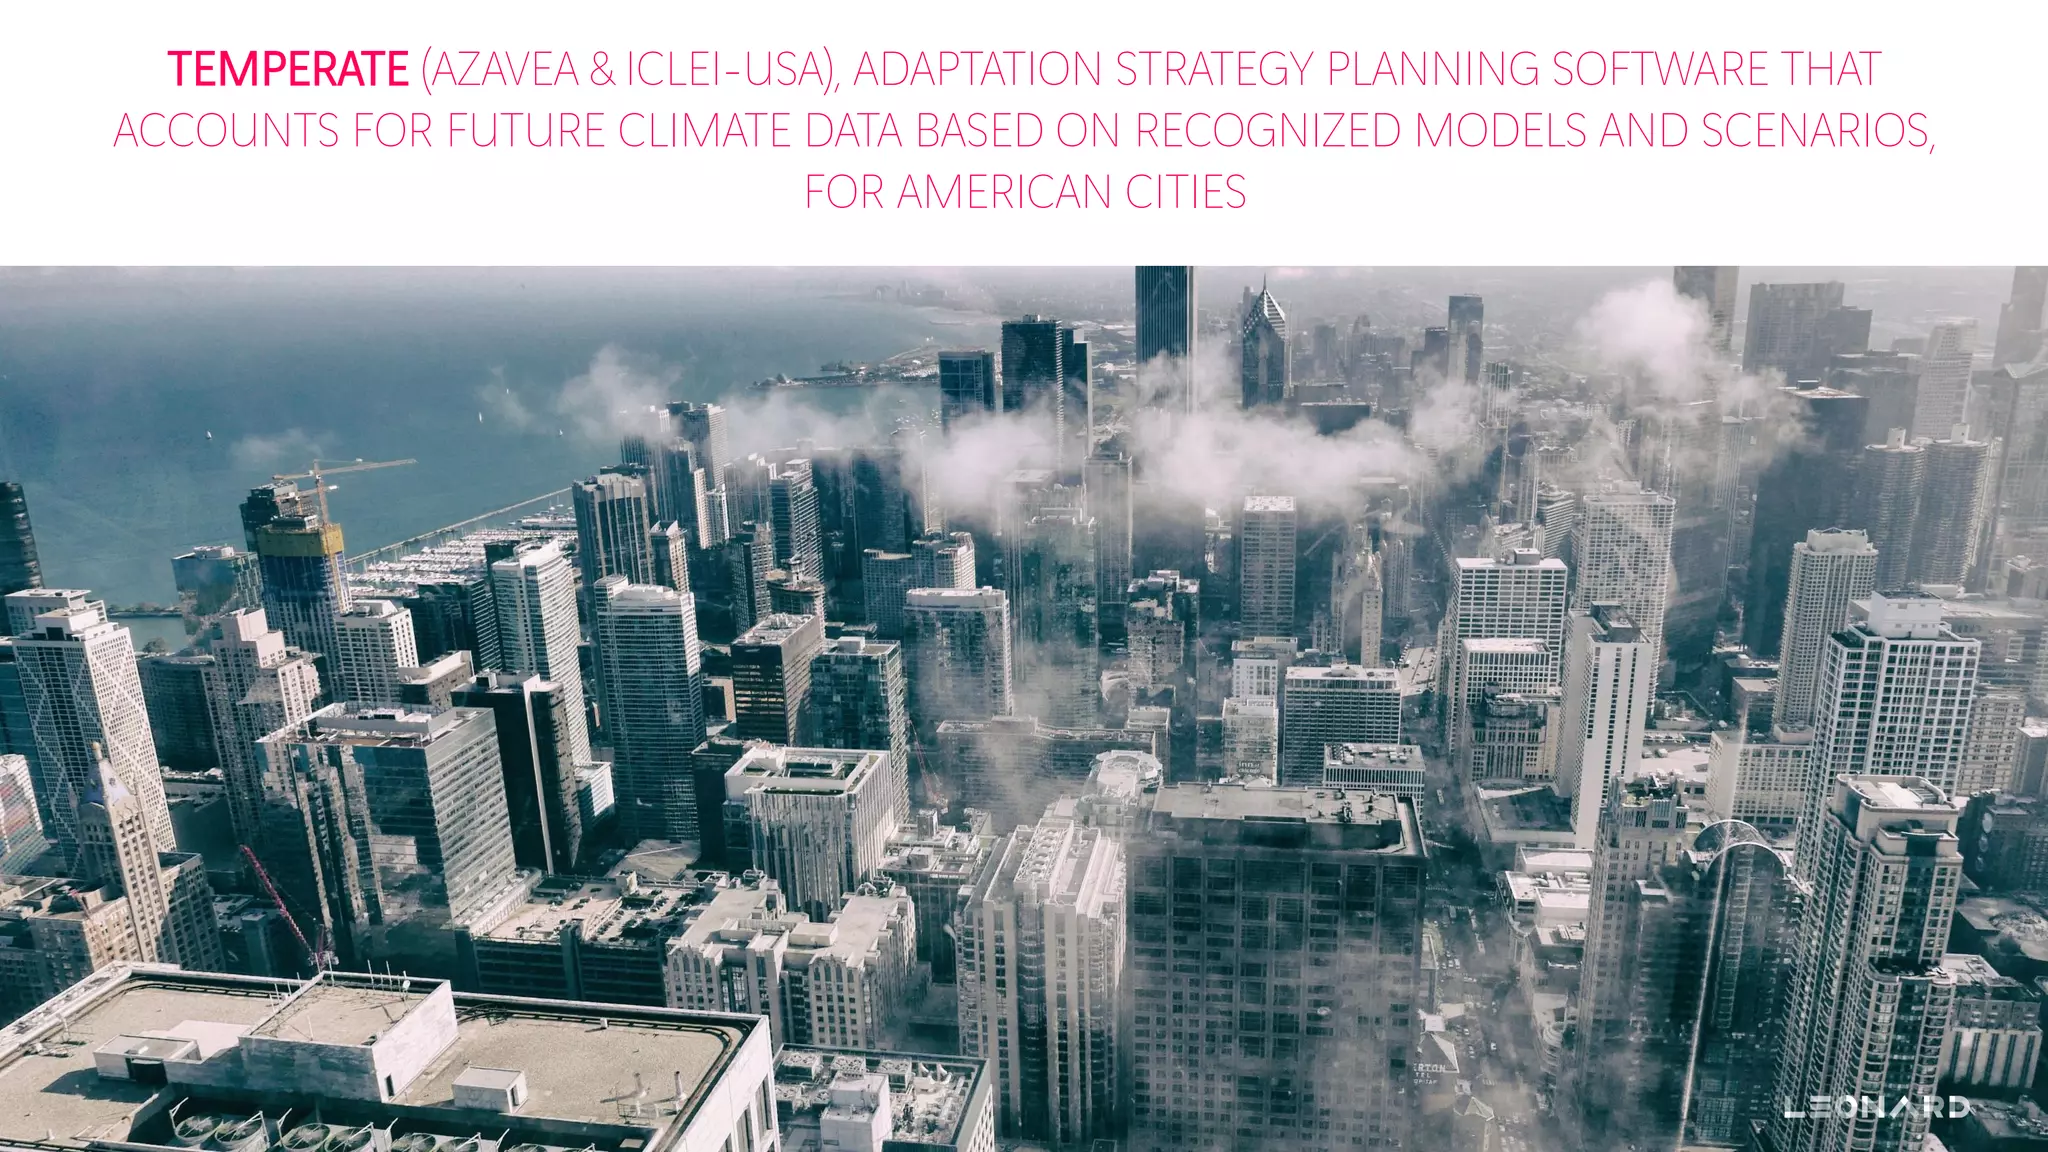


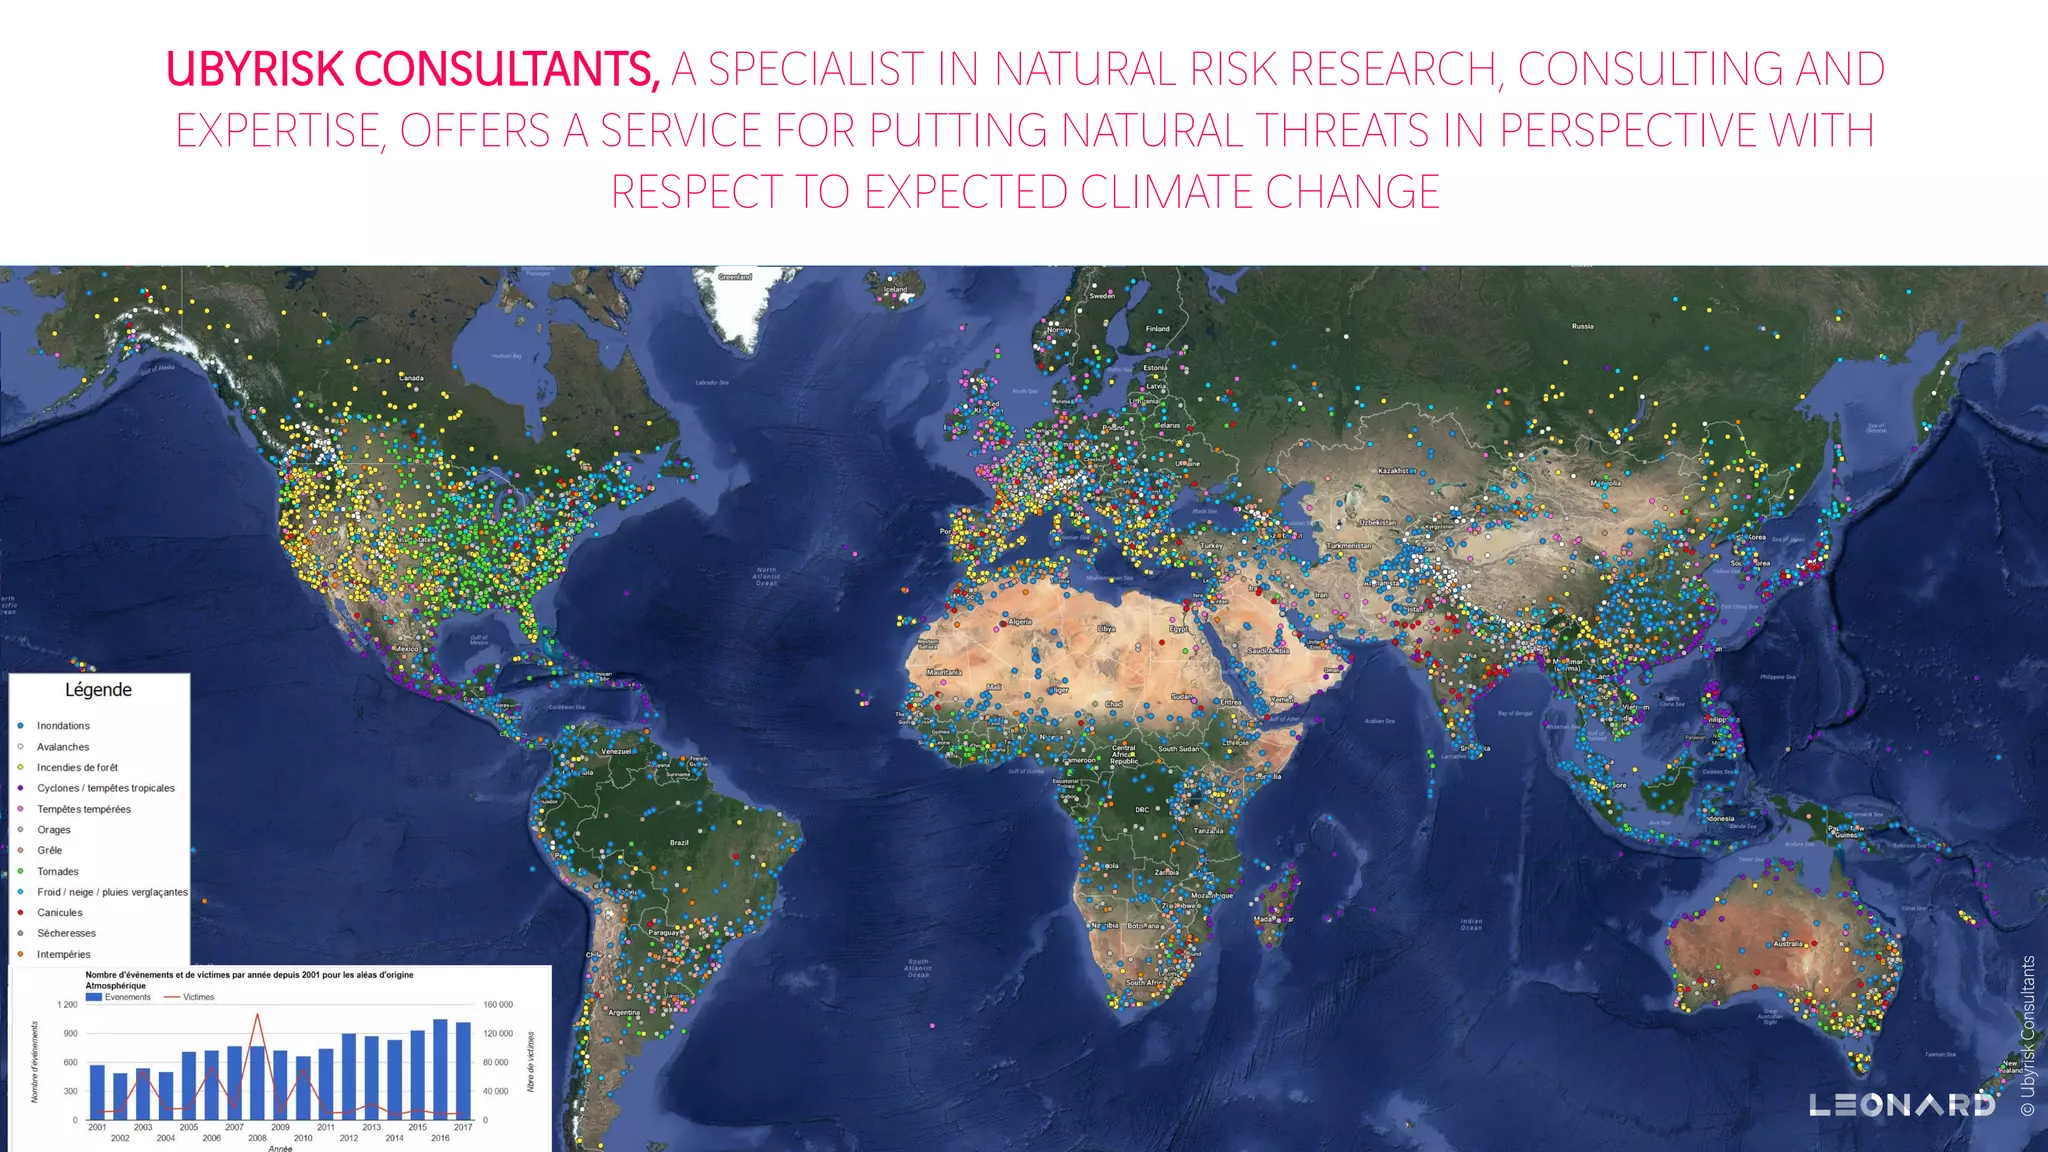


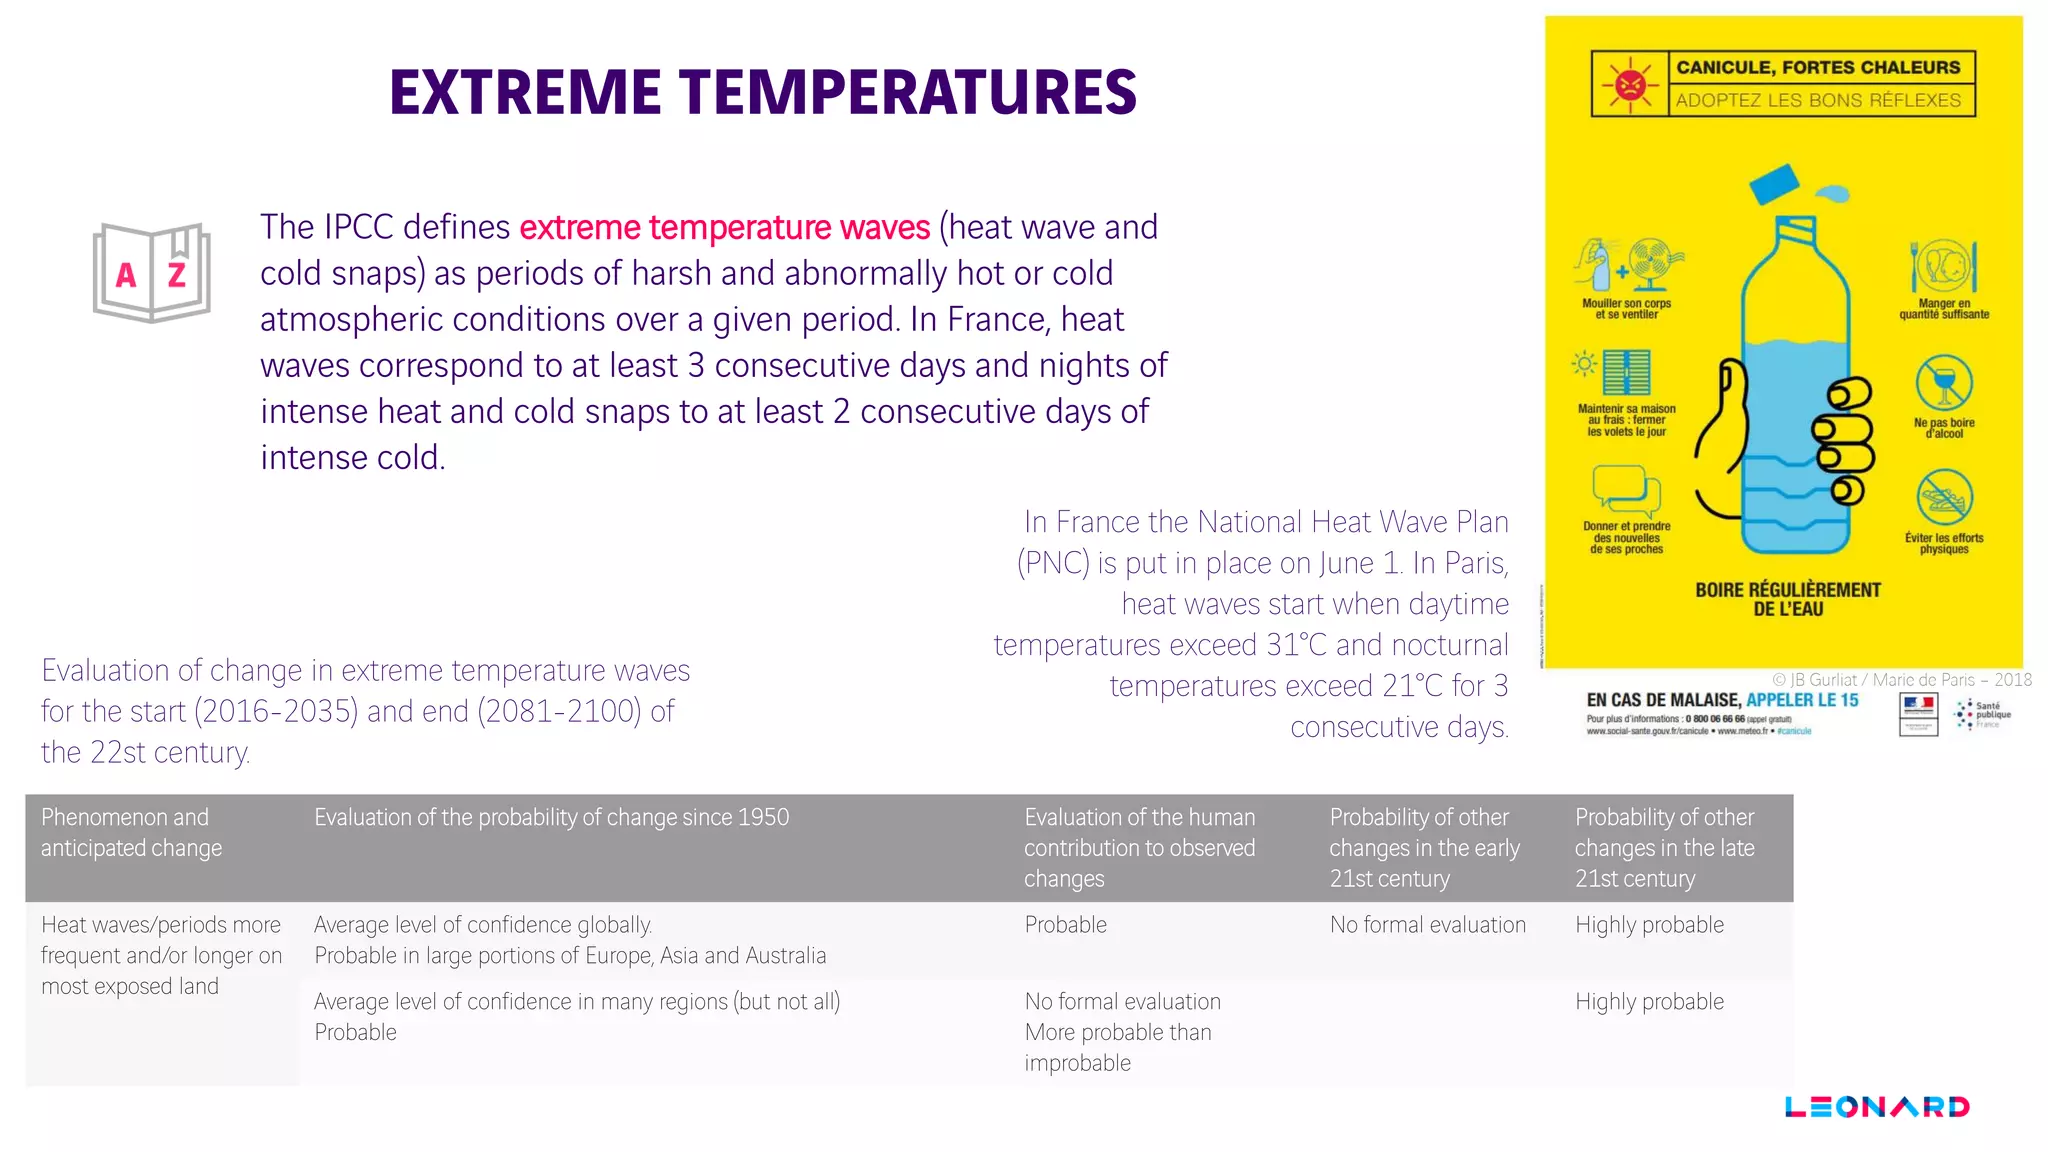


The document discusses climate resilience and infrastructure challenges posed by climate change. It notes increasing natural disasters are causing billions in damages annually. The need for resilient infrastructure to withstand gradual climate changes and periodic shocks is discussed. Challenges include uncertainty around projections, high adaptation costs, difficulty coordinating stakeholders, and economic risks to business from disruptions. Solutions proposed include standards, certification programs, insurance products, international city networks, and innovative infrastructure technologies and monitoring tools to enhance resilience.