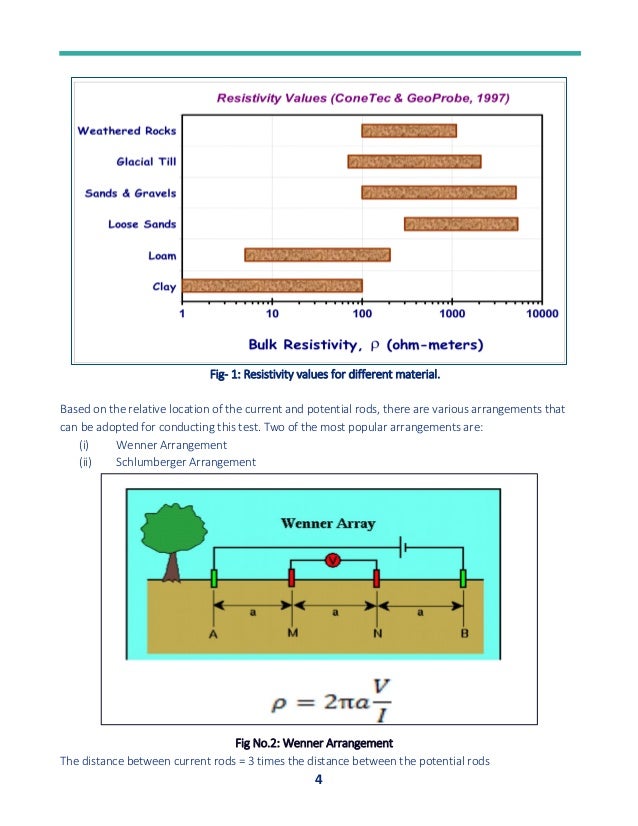
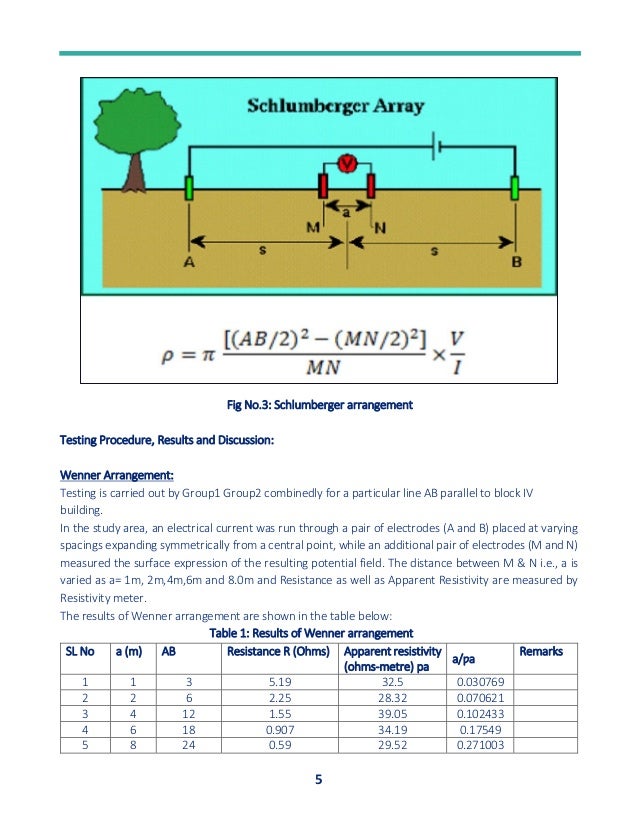
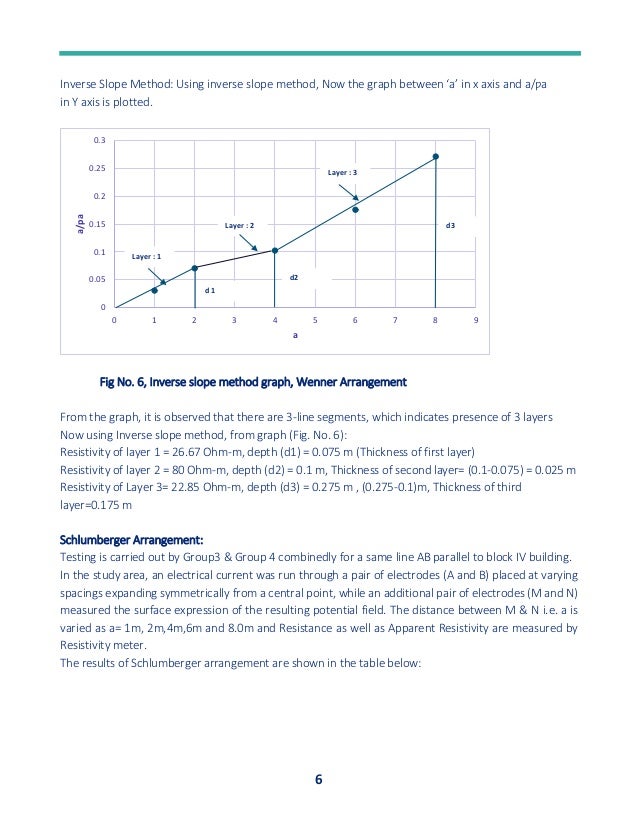
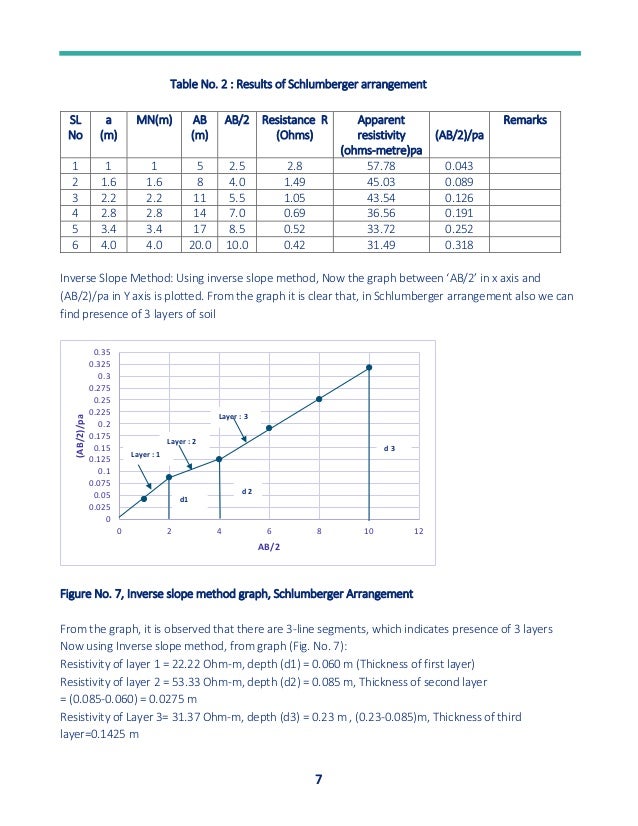
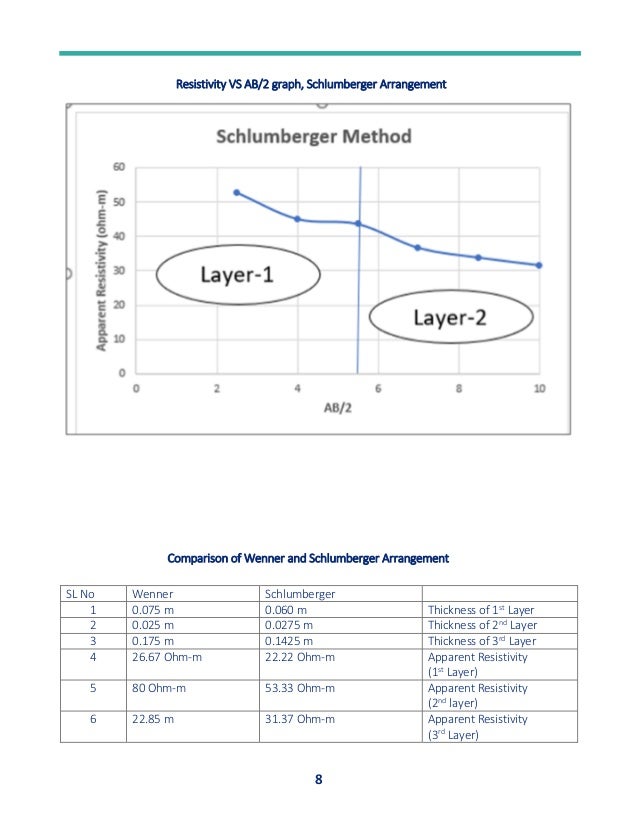
SlideShare a Scribd company logo
1
Department of Civil Engineering, IIT Delhi
Submitted By:
Abhinav Kumar
Soil Engineering Lab
REPORT TITLE (07)
Electrical Resistivity Test
Disclaimer: This presentation is for educational purposes only. Opinions or points of
view expressed in this presentation represent the view of the presenter, and does not
necessarily represent the official position or policies of IIT Delhi. Nothing in this
presentation constitutes legal advice. The individuals appearing in this presentation, if
any, are depicted for illustrative purposes only and are presumed innocent until proven
guilty in a court of law. Under no circumstance shall we have any liability to you for any
loss or damage of any kind incurred as a result of the use of the data or reliance on any
information provided. Your use of the document and your reliance on any information is
solely at your own risk
2
Objective: To perform geological exploration by the geophysical method of electrical resistivity near
block IV area of IIT Delhi
Equipments :
Resistivity Meter: An instrument used to carry out
resistivity surveys that usually has a current
transmitter and voltage-measuring circuitry.
Electrodes
3
Measuring tape, Hammer, Pegs, Wires for connections.
Theory:
The purpose of the electrical resistivity survey is to determine the subsurface resistivity distribution by
making measurements on the ground surface. It measures the resistance to the flow of electrons. This
method does not say anything about the engineering properties/strength of the soil. From these
measurements, the true resistivity of the subsurface can be estimated. The ground resistivity is related
to various geological parameters, such as the mineral and fluid content, porosity, and degree of water
saturation in rock.
It has the following purposes:
a. To rapidly explore the subsurface conditions in order to locate groundwater, the
thickness of overburden, depth to different rock types, and stratigraphic
features.
b. To delineate the zones of seepage & identify the source around various
structures of river valley projects.
c. Assessment of groundwater potential, quality, and determination of aquifer
characteristics.
d. To correlate data from resistivity survey with those obtained from borehole and
trial pit logs.
Based on the relative location of the current and potential rods, there are various
arrangements that can be adopted for conducting this test. Two of the most popular
arrangements are:
a. Wenner method
b. Schlumberger method
This method primarily measures the resistance to the flow of electrons. This method does not say
anything about the engineering properties / strength of soil. As the flow of current is effected by the
presence of ions, thus electrical resistivity is sensitive to moisture and salinity. The more the moisture
content, the lesser the resistivity. Thus, dry soil has the highest resistivity while the saturated soil has
the least. Also, the more the concentration of dissolved salts, the lesser the resistivity. The value of
electrical resistivity also gets effected by the presence of underground conducting material like drains,
pipes etc. The graph below shows value of Resistivity for different type of material.
4
Fig- 1: Resistivity values for different material.
Based on the relative location of the current and potential rods, there are various arrangements that
can be adopted for conducting this test. Two of the most popular arrangements are:
(i) Wenner Arrangement
(ii) Schlumberger Arrangement
Fig No.2: Wenner Arrangement
The distance between current rods = 3 times the distance between the potential rods
5
Fig No.3: Schlumberger arrangement
Testing Procedure, Results and Discussion:
Wenner Arrangement:
Testing is carried out by Group1 Group2 combinedly for a particular line AB parallel to block IV
building.
In the study area, an electrical current was run through a pair of electrodes (A and B) placed at varying
spacings expanding symmetrically from a central point, while an additional pair of electrodes (M and N)
measured the surface expression of the resulting potential field. The distance between M & N i.e., a is
varied as a= 1m, 2m,4m,6m and 8.0m and Resistance as well as Apparent Resistivity are measured by
Resistivity meter.
The results of Wenner arrangement are shown in the table below:
Table 1: Results of Wenner arrangement
SL No a (m) AB Resistance R (Ohms) Apparent resistivity
(ohms-metre) pa
a/ƿa
Remarks
1 1 3 5.19 32.5 0.030769
2 2 6 2.25 28.32 0.070621
3 4 12 1.55 39.05 0.102433
4 6 18 0.907 34.19 0.17549
5 8 24 0.59 29.52 0.271003
6
Inverse Slope Method: Using inverse slope method, Now the graph between ‘a’ in x axis and a/ƿa
in Y axis is plotted.
Fig No. 6, Inverse slope method graph, Wenner Arrangement
From the graph, it is observed that there are 3-line segments, which indicates presence of 3 layers
Now using Inverse slope method, from graph (Fig. No. 6):
Resistivity of layer 1 = 26.67 Ohm-m, depth (d1) = 0.075 m (Thickness of first layer)
Resistivity of layer 2 = 80 Ohm-m, depth (d2) = 0.1 m, Thickness of second layer= (0.1-0.075) = 0.025 m
Resistivity of Layer 3= 22.85 Ohm-m, depth (d3) = 0.275 m , (0.275-0.1)m, Thickness of third
layer=0.175 m
Schlumberger Arrangement:
Testing is carried out by Group3 & Group 4 combinedly for a same line AB parallel to block IV building.
In the study area, an electrical current was run through a pair of electrodes (A and B) placed at varying
spacings expanding symmetrically from a central point, while an additional pair of electrodes (M and N)
measured the surface expression of the resulting potential field. The distance between M & N i.e. a is
varied as a= 1m, 2m,4m,6m and 8.0m and Resistance as well as Apparent Resistivity are measured by
Resistivity meter.
The results of Schlumberger arrangement are shown in the table below:
0
0.05
0.1
0.15
0.2
0.25
0.3
0 1 2 3 4 5 6 7 8 9
a/pa
a
Layer : 1
Layer : 2
Layer : 3
d3
d2
d 1
7
Table No. 2 : Results of Schlumberger arrangement
SL
No
a
(m)
MN(m) AB
(m)
AB/2 Resistance R
(Ohms)
Apparent
resistivity
(ohms-metre)ƿa
(AB/2)/ƿa
Remarks
1 1 1 5 2.5 2.8 57.78 0.043
2 1.6 1.6 8 4.0 1.49 45.03 0.089
3 2.2 2.2 11 5.5 1.05 43.54 0.126
4 2.8 2.8 14 7.0 0.69 36.56 0.191
5 3.4 3.4 17 8.5 0.52 33.72 0.252
6 4.0 4.0 20.0 10.0 0.42 31.49 0.318
Inverse Slope Method: Using inverse slope method, Now the graph between ‘AB/2’ in x axis and
(AB/2)/ƿa in Y axis is plotted. From the graph it is clear that, in Schlumberger arrangement also we can
find presence of 3 layers of soil
Figure No. 7, Inverse slope method graph, Schlumberger Arrangement
From the graph, it is observed that there are 3-line segments, which indicates presence of 3 layers
Now using Inverse slope method, from graph (Fig. No. 7):
Resistivity of layer 1 = 22.22 Ohm-m, depth (d1) = 0.060 m (Thickness of first layer)
Resistivity of layer 2 = 53.33 Ohm-m, depth (d2) = 0.085 m, Thickness of second layer
= (0.085-0.060) = 0.0275 m
Resistivity of Layer 3= 31.37 Ohm-m, depth (d3) = 0.23 m , (0.23-0.085)m, Thickness of third
layer=0.1425 m
0
0.025
0.05
0.075
0.1
0.125
0.15
0.175
0.2
0.225
0.25
0.275
0.3
0.325
0.35
0 2 4 6 8 10 12
(AB/2)/pa
AB/2
Layer : 1
Layer : 2
Layer : 3
d1
d 2
d 3
8
Resistivity VS AB/2 graph, Schlumberger Arrangement
Comparison of Wenner and Schlumberger Arrangement
SL No Wenner Schlumberger
1 0.075 m 0.060 m Thickness of 1st Layer
2 0.025 m 0.0275 m Thickness of 2nd Layer
3 0.175 m 0.1425 m Thickness of 3rd Layer
4 26.67 Ohm-m 22.22 Ohm-m Apparent Resistivity
(1st Layer)
5 80 Ohm-m 53.33 Ohm-m Apparent Resistivity
(2nd layer)
6 22.85 m 31.37 Ohm-m Apparent Resistivity
(3rd Layer)
9
Electrical Resistivity Tomography:
All the groups combinedly have performed Electrical Resistivity Tomography on Demo basis. In this
process, 18 electrodes have been placed in the ground @ 1.0 m interval. The model generated by
using software is shown below as
Fig No. 8: Model developed by Electrical Resistivity Method
As per above model, the apparent resistivity varies from 29.2 Ohm-m to 52.9 Ohm-m.
Discussion:
1. The objective of this research is to evaluate the water potential of the study area by
investigating the shallow subsurface aquifer material properties and moisture distribution using
2D ERT techniques. During the shallow tube well design and development in the study area,
some patches of land does have good potential and some does not, which motivated to
understand the aquifer properties, aquifer material, and response. Hence the 2D ERT was
carried out, oriented around the pond in the center and five ERT profiles.
10
Reference:
IS 15736: 2007

More Related Content

Similar to Electrical Resistivity Test

Characterization Techniques for Electronic Devices.pptx
Characterization Techniques for Electronic Devices.pptxCharacterization Techniques for Electronic Devices.pptx
Characterization Techniques for Electronic Devices.pptx
alqohilihamed
 
Afm electrical mode - parametric testing(i-v ,c-v)
Afm   electrical mode - parametric testing(i-v ,c-v)Afm   electrical mode - parametric testing(i-v ,c-v)
Afm electrical mode - parametric testing(i-v ,c-v)
Abhishek Kumar
 
RESISTANCE.pptx
RESISTANCE.pptxRESISTANCE.pptx
RESISTANCE.pptx
CarlLouiseCapute
 
Diodes and semiconductors - an introduction
Diodes and semiconductors - an introductionDiodes and semiconductors - an introduction
Diodes and semiconductors - an introduction
University of Essex
 
sheet resistivity
sheet resistivitysheet resistivity
sheet resistivity
paneliya sagar
 
IPI2win 1..pdf
IPI2win 1..pdfIPI2win 1..pdf
IPI2win 1..pdf
DrAsemAhmed
 
intoduction to electronics and communication
intoduction to electronics and communicationintoduction to electronics and communication
intoduction to electronics and communication
GeethaPriya555088
 
Resistivity of semiconductor by four probe method.pptx
Resistivity of semiconductor by four probe method.pptxResistivity of semiconductor by four probe method.pptx
Resistivity of semiconductor by four probe method.pptx
AadityaPandey16
 
Analysis of transient enclosure voltages in gis (emtp simulation studies)
Analysis of transient enclosure voltages in gis (emtp simulation studies)Analysis of transient enclosure voltages in gis (emtp simulation studies)
Analysis of transient enclosure voltages in gis (emtp simulation studies)
eSAT Publishing House
 
Analysis of transient enclosure voltages in gis (emtp simulation studies)
Analysis of transient enclosure voltages in gis (emtp simulation studies)Analysis of transient enclosure voltages in gis (emtp simulation studies)
Analysis of transient enclosure voltages in gis (emtp simulation studies)
eSAT Journals
 
Development of A 3d Model Eddy Current Testing
Development of A 3d Model Eddy Current TestingDevelopment of A 3d Model Eddy Current Testing
Development of A 3d Model Eddy Current Testing
inventionjournals
 
Measurement of energy loss of light ions using silicon surface barrier detector
Measurement of energy loss of light ions using silicon surface barrier detectorMeasurement of energy loss of light ions using silicon surface barrier detector
Measurement of energy loss of light ions using silicon surface barrier detector
eSAT Publishing House
 
ESA Module 1 Part-B ME832. by Dr. Mohammed Imran
ESA Module 1 Part-B ME832. by Dr. Mohammed ImranESA Module 1 Part-B ME832. by Dr. Mohammed Imran
ESA Module 1 Part-B ME832. by Dr. Mohammed Imran
Mohammed Imran
 
Cbse Class 12 Physics Sample Paper 2010 Model 1
Cbse Class 12 Physics Sample Paper 2010 Model 1Cbse Class 12 Physics Sample Paper 2010 Model 1
Cbse Class 12 Physics Sample Paper 2010 Model 1
Sunaina Rawat
 
A5230104
A5230104A5230104
A5230104
IOSR-JEN
 
Experimental stress analysis BE notes by mohammed imran
Experimental stress analysis BE notes by mohammed imranExperimental stress analysis BE notes by mohammed imran
Experimental stress analysis BE notes by mohammed imran
Mohammed Imran
 
Measurement of Strain and Temperature
Measurement of Strain and TemperatureMeasurement of Strain and Temperature
Measurement of Strain and TemperatureAbhishek Turamandi
 
Four probe Method.pptx
Four probe Method.pptxFour probe Method.pptx
Four probe Method.pptx
JatinMahato1
 
Measurements of high voltage dc
Measurements of high voltage dcMeasurements of high voltage dc
Measurements of high voltage dc
aswanthmrajeev112
 
Experimental evaluation of strain in concrete elements
Experimental evaluation of strain in concrete elementsExperimental evaluation of strain in concrete elements
Experimental evaluation of strain in concrete elements
nisarg gandhi
 

Similar to Electrical Resistivity Test (20)

Characterization Techniques for Electronic Devices.pptx
Characterization Techniques for Electronic Devices.pptxCharacterization Techniques for Electronic Devices.pptx
Characterization Techniques for Electronic Devices.pptx
 
Afm electrical mode - parametric testing(i-v ,c-v)
Afm   electrical mode - parametric testing(i-v ,c-v)Afm   electrical mode - parametric testing(i-v ,c-v)
Afm electrical mode - parametric testing(i-v ,c-v)
 
RESISTANCE.pptx
RESISTANCE.pptxRESISTANCE.pptx
RESISTANCE.pptx
 
Diodes and semiconductors - an introduction
Diodes and semiconductors - an introductionDiodes and semiconductors - an introduction
Diodes and semiconductors - an introduction
 
sheet resistivity
sheet resistivitysheet resistivity
sheet resistivity
 
IPI2win 1..pdf
IPI2win 1..pdfIPI2win 1..pdf
IPI2win 1..pdf
 
intoduction to electronics and communication
intoduction to electronics and communicationintoduction to electronics and communication
intoduction to electronics and communication
 
Resistivity of semiconductor by four probe method.pptx
Resistivity of semiconductor by four probe method.pptxResistivity of semiconductor by four probe method.pptx
Resistivity of semiconductor by four probe method.pptx
 
Analysis of transient enclosure voltages in gis (emtp simulation studies)
Analysis of transient enclosure voltages in gis (emtp simulation studies)Analysis of transient enclosure voltages in gis (emtp simulation studies)
Analysis of transient enclosure voltages in gis (emtp simulation studies)
 
Analysis of transient enclosure voltages in gis (emtp simulation studies)
Analysis of transient enclosure voltages in gis (emtp simulation studies)Analysis of transient enclosure voltages in gis (emtp simulation studies)
Analysis of transient enclosure voltages in gis (emtp simulation studies)
 
Development of A 3d Model Eddy Current Testing
Development of A 3d Model Eddy Current TestingDevelopment of A 3d Model Eddy Current Testing
Development of A 3d Model Eddy Current Testing
 
Measurement of energy loss of light ions using silicon surface barrier detector
Measurement of energy loss of light ions using silicon surface barrier detectorMeasurement of energy loss of light ions using silicon surface barrier detector
Measurement of energy loss of light ions using silicon surface barrier detector
 
ESA Module 1 Part-B ME832. by Dr. Mohammed Imran
ESA Module 1 Part-B ME832. by Dr. Mohammed ImranESA Module 1 Part-B ME832. by Dr. Mohammed Imran
ESA Module 1 Part-B ME832. by Dr. Mohammed Imran
 
Cbse Class 12 Physics Sample Paper 2010 Model 1
Cbse Class 12 Physics Sample Paper 2010 Model 1Cbse Class 12 Physics Sample Paper 2010 Model 1
Cbse Class 12 Physics Sample Paper 2010 Model 1
 
A5230104
A5230104A5230104
A5230104
 
Experimental stress analysis BE notes by mohammed imran
Experimental stress analysis BE notes by mohammed imranExperimental stress analysis BE notes by mohammed imran
Experimental stress analysis BE notes by mohammed imran
 
Measurement of Strain and Temperature
Measurement of Strain and TemperatureMeasurement of Strain and Temperature
Measurement of Strain and Temperature
 
Four probe Method.pptx
Four probe Method.pptxFour probe Method.pptx
Four probe Method.pptx
 
Measurements of high voltage dc
Measurements of high voltage dcMeasurements of high voltage dc
Measurements of high voltage dc
 
Experimental evaluation of strain in concrete elements
Experimental evaluation of strain in concrete elementsExperimental evaluation of strain in concrete elements
Experimental evaluation of strain in concrete elements
 

More from A K

Consolidated Drained (CD) Triaxial Test.pdf
Consolidated Drained (CD) Triaxial Test.pdfConsolidated Drained (CD) Triaxial Test.pdf
Consolidated Drained (CD) Triaxial Test.pdf
A K
 
Unconsolidated Undrained (UU) Triaxial Test
Unconsolidated Undrained (UU) Triaxial TestUnconsolidated Undrained (UU) Triaxial Test
Unconsolidated Undrained (UU) Triaxial Test
A K
 
1-D Consolidation Test
1-D Consolidation Test1-D Consolidation Test
1-D Consolidation Test
A K
 
Laboratory Vane Shear Test
Laboratory Vane Shear TestLaboratory Vane Shear Test
Laboratory Vane Shear Test
A K
 
Direct Shear Test
Direct Shear TestDirect Shear Test
Direct Shear Test
A K
 
Atterberg Limits Test
Atterberg Limits TestAtterberg Limits Test
Atterberg Limits Test
A K
 
Proctor Compaction Test
Proctor Compaction TestProctor Compaction Test
Proctor Compaction Test
A K
 
Min and Max Density of Soil
Min and Max Density of SoilMin and Max Density of Soil
Min and Max Density of Soil
A K
 

More from A K (8)

Consolidated Drained (CD) Triaxial Test.pdf
Consolidated Drained (CD) Triaxial Test.pdfConsolidated Drained (CD) Triaxial Test.pdf
Consolidated Drained (CD) Triaxial Test.pdf
 
Unconsolidated Undrained (UU) Triaxial Test
Unconsolidated Undrained (UU) Triaxial TestUnconsolidated Undrained (UU) Triaxial Test
Unconsolidated Undrained (UU) Triaxial Test
 
1-D Consolidation Test
1-D Consolidation Test1-D Consolidation Test
1-D Consolidation Test
 
Laboratory Vane Shear Test
Laboratory Vane Shear TestLaboratory Vane Shear Test
Laboratory Vane Shear Test
 
Direct Shear Test
Direct Shear TestDirect Shear Test
Direct Shear Test
 
Atterberg Limits Test
Atterberg Limits TestAtterberg Limits Test
Atterberg Limits Test
 
Proctor Compaction Test
Proctor Compaction TestProctor Compaction Test
Proctor Compaction Test
 
Min and Max Density of Soil
Min and Max Density of SoilMin and Max Density of Soil
Min and Max Density of Soil
 

Recently uploaded

HYDROPOWER - Hydroelectric power generation
HYDROPOWER - Hydroelectric power generationHYDROPOWER - Hydroelectric power generation
HYDROPOWER - Hydroelectric power generation
Robbie Edward Sayers
 
Investor-Presentation-Q1FY2024 investor presentation document.pptx
Investor-Presentation-Q1FY2024 investor presentation document.pptxInvestor-Presentation-Q1FY2024 investor presentation document.pptx
Investor-Presentation-Q1FY2024 investor presentation document.pptx
AmarGB2
 
DESIGN A COTTON SEED SEPARATION MACHINE.docx
DESIGN A COTTON SEED SEPARATION MACHINE.docxDESIGN A COTTON SEED SEPARATION MACHINE.docx
DESIGN A COTTON SEED SEPARATION MACHINE.docx
FluxPrime1
 
Water Industry Process Automation and Control Monthly - May 2024.pdf
Water Industry Process Automation and Control Monthly - May 2024.pdfWater Industry Process Automation and Control Monthly - May 2024.pdf
Water Industry Process Automation and Control Monthly - May 2024.pdf
Water Industry Process Automation & Control
 
Cosmetic shop management system project report.pdf
Cosmetic shop management system project report.pdfCosmetic shop management system project report.pdf
Cosmetic shop management system project report.pdf
Kamal Acharya
 
block diagram and signal flow graph representation
block diagram and signal flow graph representationblock diagram and signal flow graph representation
block diagram and signal flow graph representation
Divya Somashekar
 
Pile Foundation by Venkatesh Taduvai (Sub Geotechnical Engineering II)-conver...
Pile Foundation by Venkatesh Taduvai (Sub Geotechnical Engineering II)-conver...Pile Foundation by Venkatesh Taduvai (Sub Geotechnical Engineering II)-conver...
Pile Foundation by Venkatesh Taduvai (Sub Geotechnical Engineering II)-conver...
AJAYKUMARPUND1
 
Hierarchical Digital Twin of a Naval Power System
Hierarchical Digital Twin of a Naval Power SystemHierarchical Digital Twin of a Naval Power System
Hierarchical Digital Twin of a Naval Power System
Kerry Sado
 
Sachpazis:Terzaghi Bearing Capacity Estimation in simple terms with Calculati...
Sachpazis:Terzaghi Bearing Capacity Estimation in simple terms with Calculati...Sachpazis:Terzaghi Bearing Capacity Estimation in simple terms with Calculati...
Sachpazis:Terzaghi Bearing Capacity Estimation in simple terms with Calculati...
Dr.Costas Sachpazis
 
space technology lecture notes on satellite
space technology lecture notes on satellitespace technology lecture notes on satellite
space technology lecture notes on satellite
ongomchris
 
Fundamentals of Electric Drives and its applications.pptx
Fundamentals of Electric Drives and its applications.pptxFundamentals of Electric Drives and its applications.pptx
Fundamentals of Electric Drives and its applications.pptx
manasideore6
 
J.Yang, ICLR 2024, MLILAB, KAIST AI.pdf
J.Yang,  ICLR 2024, MLILAB, KAIST AI.pdfJ.Yang,  ICLR 2024, MLILAB, KAIST AI.pdf
J.Yang, ICLR 2024, MLILAB, KAIST AI.pdf
MLILAB
 
English lab ppt no titlespecENG PPTt.pdf
English lab ppt no titlespecENG PPTt.pdfEnglish lab ppt no titlespecENG PPTt.pdf
English lab ppt no titlespecENG PPTt.pdf
BrazilAccount1
 
NO1 Uk best vashikaran specialist in delhi vashikaran baba near me online vas...
NO1 Uk best vashikaran specialist in delhi vashikaran baba near me online vas...NO1 Uk best vashikaran specialist in delhi vashikaran baba near me online vas...
NO1 Uk best vashikaran specialist in delhi vashikaran baba near me online vas...
Amil Baba Dawood bangali
 
WATER CRISIS and its solutions-pptx 1234
WATER CRISIS and its solutions-pptx 1234WATER CRISIS and its solutions-pptx 1234
WATER CRISIS and its solutions-pptx 1234
AafreenAbuthahir2
 
Architectural Portfolio Sean Lockwood
Architectural Portfolio Sean LockwoodArchitectural Portfolio Sean Lockwood
Architectural Portfolio Sean Lockwood
seandesed
 
Immunizing Image Classifiers Against Localized Adversary Attacks
Immunizing Image Classifiers Against Localized Adversary AttacksImmunizing Image Classifiers Against Localized Adversary Attacks
Immunizing Image Classifiers Against Localized Adversary Attacks
gerogepatton
 
Industrial Training at Shahjalal Fertilizer Company Limited (SFCL)
Industrial Training at Shahjalal Fertilizer Company Limited (SFCL)Industrial Training at Shahjalal Fertilizer Company Limited (SFCL)
Industrial Training at Shahjalal Fertilizer Company Limited (SFCL)
MdTanvirMahtab2
 
Hybrid optimization of pumped hydro system and solar- Engr. Abdul-Azeez.pdf
Hybrid optimization of pumped hydro system and solar- Engr. Abdul-Azeez.pdfHybrid optimization of pumped hydro system and solar- Engr. Abdul-Azeez.pdf
Hybrid optimization of pumped hydro system and solar- Engr. Abdul-Azeez.pdf
fxintegritypublishin
 
Governing Equations for Fundamental Aerodynamics_Anderson2010.pdf
Governing Equations for Fundamental Aerodynamics_Anderson2010.pdfGoverning Equations for Fundamental Aerodynamics_Anderson2010.pdf
Governing Equations for Fundamental Aerodynamics_Anderson2010.pdf
WENKENLI1
 

Recently uploaded (20)

HYDROPOWER - Hydroelectric power generation
HYDROPOWER - Hydroelectric power generationHYDROPOWER - Hydroelectric power generation
HYDROPOWER - Hydroelectric power generation
 
Investor-Presentation-Q1FY2024 investor presentation document.pptx
Investor-Presentation-Q1FY2024 investor presentation document.pptxInvestor-Presentation-Q1FY2024 investor presentation document.pptx
Investor-Presentation-Q1FY2024 investor presentation document.pptx
 
DESIGN A COTTON SEED SEPARATION MACHINE.docx
DESIGN A COTTON SEED SEPARATION MACHINE.docxDESIGN A COTTON SEED SEPARATION MACHINE.docx
DESIGN A COTTON SEED SEPARATION MACHINE.docx
 
Water Industry Process Automation and Control Monthly - May 2024.pdf
Water Industry Process Automation and Control Monthly - May 2024.pdfWater Industry Process Automation and Control Monthly - May 2024.pdf
Water Industry Process Automation and Control Monthly - May 2024.pdf
 
Cosmetic shop management system project report.pdf
Cosmetic shop management system project report.pdfCosmetic shop management system project report.pdf
Cosmetic shop management system project report.pdf
 
block diagram and signal flow graph representation
block diagram and signal flow graph representationblock diagram and signal flow graph representation
block diagram and signal flow graph representation
 
Pile Foundation by Venkatesh Taduvai (Sub Geotechnical Engineering II)-conver...
Pile Foundation by Venkatesh Taduvai (Sub Geotechnical Engineering II)-conver...Pile Foundation by Venkatesh Taduvai (Sub Geotechnical Engineering II)-conver...
Pile Foundation by Venkatesh Taduvai (Sub Geotechnical Engineering II)-conver...
 
Hierarchical Digital Twin of a Naval Power System
Hierarchical Digital Twin of a Naval Power SystemHierarchical Digital Twin of a Naval Power System
Hierarchical Digital Twin of a Naval Power System
 
Sachpazis:Terzaghi Bearing Capacity Estimation in simple terms with Calculati...
Sachpazis:Terzaghi Bearing Capacity Estimation in simple terms with Calculati...Sachpazis:Terzaghi Bearing Capacity Estimation in simple terms with Calculati...
Sachpazis:Terzaghi Bearing Capacity Estimation in simple terms with Calculati...
 
space technology lecture notes on satellite
space technology lecture notes on satellitespace technology lecture notes on satellite
space technology lecture notes on satellite
 
Fundamentals of Electric Drives and its applications.pptx
Fundamentals of Electric Drives and its applications.pptxFundamentals of Electric Drives and its applications.pptx
Fundamentals of Electric Drives and its applications.pptx
 
J.Yang, ICLR 2024, MLILAB, KAIST AI.pdf
J.Yang,  ICLR 2024, MLILAB, KAIST AI.pdfJ.Yang,  ICLR 2024, MLILAB, KAIST AI.pdf
J.Yang, ICLR 2024, MLILAB, KAIST AI.pdf
 
English lab ppt no titlespecENG PPTt.pdf
English lab ppt no titlespecENG PPTt.pdfEnglish lab ppt no titlespecENG PPTt.pdf
English lab ppt no titlespecENG PPTt.pdf
 
NO1 Uk best vashikaran specialist in delhi vashikaran baba near me online vas...
NO1 Uk best vashikaran specialist in delhi vashikaran baba near me online vas...NO1 Uk best vashikaran specialist in delhi vashikaran baba near me online vas...
NO1 Uk best vashikaran specialist in delhi vashikaran baba near me online vas...
 
WATER CRISIS and its solutions-pptx 1234
WATER CRISIS and its solutions-pptx 1234WATER CRISIS and its solutions-pptx 1234
WATER CRISIS and its solutions-pptx 1234
 
Architectural Portfolio Sean Lockwood
Architectural Portfolio Sean LockwoodArchitectural Portfolio Sean Lockwood
Architectural Portfolio Sean Lockwood
 
Immunizing Image Classifiers Against Localized Adversary Attacks
Immunizing Image Classifiers Against Localized Adversary AttacksImmunizing Image Classifiers Against Localized Adversary Attacks
Immunizing Image Classifiers Against Localized Adversary Attacks
 
Industrial Training at Shahjalal Fertilizer Company Limited (SFCL)
Industrial Training at Shahjalal Fertilizer Company Limited (SFCL)Industrial Training at Shahjalal Fertilizer Company Limited (SFCL)
Industrial Training at Shahjalal Fertilizer Company Limited (SFCL)
 
Hybrid optimization of pumped hydro system and solar- Engr. Abdul-Azeez.pdf
Hybrid optimization of pumped hydro system and solar- Engr. Abdul-Azeez.pdfHybrid optimization of pumped hydro system and solar- Engr. Abdul-Azeez.pdf
Hybrid optimization of pumped hydro system and solar- Engr. Abdul-Azeez.pdf
 
Governing Equations for Fundamental Aerodynamics_Anderson2010.pdf
Governing Equations for Fundamental Aerodynamics_Anderson2010.pdfGoverning Equations for Fundamental Aerodynamics_Anderson2010.pdf
Governing Equations for Fundamental Aerodynamics_Anderson2010.pdf
 

Electrical Resistivity Test

  • 1. 1 Department of Civil Engineering, IIT Delhi Submitted By: Abhinav Kumar Soil Engineering Lab REPORT TITLE (07) Electrical Resistivity Test Disclaimer: This presentation is for educational purposes only. Opinions or points of view expressed in this presentation represent the view of the presenter, and does not necessarily represent the official position or policies of IIT Delhi. Nothing in this presentation constitutes legal advice. The individuals appearing in this presentation, if any, are depicted for illustrative purposes only and are presumed innocent until proven guilty in a court of law. Under no circumstance shall we have any liability to you for any loss or damage of any kind incurred as a result of the use of the data or reliance on any information provided. Your use of the document and your reliance on any information is solely at your own risk
  • 2. 2 Objective: To perform geological exploration by the geophysical method of electrical resistivity near block IV area of IIT Delhi Equipments : Resistivity Meter: An instrument used to carry out resistivity surveys that usually has a current transmitter and voltage-measuring circuitry. Electrodes
  • 3. 3 Measuring tape, Hammer, Pegs, Wires for connections. Theory: The purpose of the electrical resistivity survey is to determine the subsurface resistivity distribution by making measurements on the ground surface. It measures the resistance to the flow of electrons. This method does not say anything about the engineering properties/strength of the soil. From these measurements, the true resistivity of the subsurface can be estimated. The ground resistivity is related to various geological parameters, such as the mineral and fluid content, porosity, and degree of water saturation in rock. It has the following purposes: a. To rapidly explore the subsurface conditions in order to locate groundwater, the thickness of overburden, depth to different rock types, and stratigraphic features. b. To delineate the zones of seepage & identify the source around various structures of river valley projects. c. Assessment of groundwater potential, quality, and determination of aquifer characteristics. d. To correlate data from resistivity survey with those obtained from borehole and trial pit logs. Based on the relative location of the current and potential rods, there are various arrangements that can be adopted for conducting this test. Two of the most popular arrangements are: a. Wenner method b. Schlumberger method This method primarily measures the resistance to the flow of electrons. This method does not say anything about the engineering properties / strength of soil. As the flow of current is effected by the presence of ions, thus electrical resistivity is sensitive to moisture and salinity. The more the moisture content, the lesser the resistivity. Thus, dry soil has the highest resistivity while the saturated soil has the least. Also, the more the concentration of dissolved salts, the lesser the resistivity. The value of electrical resistivity also gets effected by the presence of underground conducting material like drains, pipes etc. The graph below shows value of Resistivity for different type of material.
  • 4. 4 Fig- 1: Resistivity values for different material. Based on the relative location of the current and potential rods, there are various arrangements that can be adopted for conducting this test. Two of the most popular arrangements are: (i) Wenner Arrangement (ii) Schlumberger Arrangement Fig No.2: Wenner Arrangement The distance between current rods = 3 times the distance between the potential rods
  • 5. 5 Fig No.3: Schlumberger arrangement Testing Procedure, Results and Discussion: Wenner Arrangement: Testing is carried out by Group1 Group2 combinedly for a particular line AB parallel to block IV building. In the study area, an electrical current was run through a pair of electrodes (A and B) placed at varying spacings expanding symmetrically from a central point, while an additional pair of electrodes (M and N) measured the surface expression of the resulting potential field. The distance between M & N i.e., a is varied as a= 1m, 2m,4m,6m and 8.0m and Resistance as well as Apparent Resistivity are measured by Resistivity meter. The results of Wenner arrangement are shown in the table below: Table 1: Results of Wenner arrangement SL No a (m) AB Resistance R (Ohms) Apparent resistivity (ohms-metre) pa a/ƿa Remarks 1 1 3 5.19 32.5 0.030769 2 2 6 2.25 28.32 0.070621 3 4 12 1.55 39.05 0.102433 4 6 18 0.907 34.19 0.17549 5 8 24 0.59 29.52 0.271003
  • 6. 6 Inverse Slope Method: Using inverse slope method, Now the graph between ‘a’ in x axis and a/ƿa in Y axis is plotted. Fig No. 6, Inverse slope method graph, Wenner Arrangement From the graph, it is observed that there are 3-line segments, which indicates presence of 3 layers Now using Inverse slope method, from graph (Fig. No. 6): Resistivity of layer 1 = 26.67 Ohm-m, depth (d1) = 0.075 m (Thickness of first layer) Resistivity of layer 2 = 80 Ohm-m, depth (d2) = 0.1 m, Thickness of second layer= (0.1-0.075) = 0.025 m Resistivity of Layer 3= 22.85 Ohm-m, depth (d3) = 0.275 m , (0.275-0.1)m, Thickness of third layer=0.175 m Schlumberger Arrangement: Testing is carried out by Group3 & Group 4 combinedly for a same line AB parallel to block IV building. In the study area, an electrical current was run through a pair of electrodes (A and B) placed at varying spacings expanding symmetrically from a central point, while an additional pair of electrodes (M and N) measured the surface expression of the resulting potential field. The distance between M & N i.e. a is varied as a= 1m, 2m,4m,6m and 8.0m and Resistance as well as Apparent Resistivity are measured by Resistivity meter. The results of Schlumberger arrangement are shown in the table below: 0 0.05 0.1 0.15 0.2 0.25 0.3 0 1 2 3 4 5 6 7 8 9 a/pa a Layer : 1 Layer : 2 Layer : 3 d3 d2 d 1
  • 7. 7 Table No. 2 : Results of Schlumberger arrangement SL No a (m) MN(m) AB (m) AB/2 Resistance R (Ohms) Apparent resistivity (ohms-metre)ƿa (AB/2)/ƿa Remarks 1 1 1 5 2.5 2.8 57.78 0.043 2 1.6 1.6 8 4.0 1.49 45.03 0.089 3 2.2 2.2 11 5.5 1.05 43.54 0.126 4 2.8 2.8 14 7.0 0.69 36.56 0.191 5 3.4 3.4 17 8.5 0.52 33.72 0.252 6 4.0 4.0 20.0 10.0 0.42 31.49 0.318 Inverse Slope Method: Using inverse slope method, Now the graph between ‘AB/2’ in x axis and (AB/2)/ƿa in Y axis is plotted. From the graph it is clear that, in Schlumberger arrangement also we can find presence of 3 layers of soil Figure No. 7, Inverse slope method graph, Schlumberger Arrangement From the graph, it is observed that there are 3-line segments, which indicates presence of 3 layers Now using Inverse slope method, from graph (Fig. No. 7): Resistivity of layer 1 = 22.22 Ohm-m, depth (d1) = 0.060 m (Thickness of first layer) Resistivity of layer 2 = 53.33 Ohm-m, depth (d2) = 0.085 m, Thickness of second layer = (0.085-0.060) = 0.0275 m Resistivity of Layer 3= 31.37 Ohm-m, depth (d3) = 0.23 m , (0.23-0.085)m, Thickness of third layer=0.1425 m 0 0.025 0.05 0.075 0.1 0.125 0.15 0.175 0.2 0.225 0.25 0.275 0.3 0.325 0.35 0 2 4 6 8 10 12 (AB/2)/pa AB/2 Layer : 1 Layer : 2 Layer : 3 d1 d 2 d 3
  • 8. 8 Resistivity VS AB/2 graph, Schlumberger Arrangement Comparison of Wenner and Schlumberger Arrangement SL No Wenner Schlumberger 1 0.075 m 0.060 m Thickness of 1st Layer 2 0.025 m 0.0275 m Thickness of 2nd Layer 3 0.175 m 0.1425 m Thickness of 3rd Layer 4 26.67 Ohm-m 22.22 Ohm-m Apparent Resistivity (1st Layer) 5 80 Ohm-m 53.33 Ohm-m Apparent Resistivity (2nd layer) 6 22.85 m 31.37 Ohm-m Apparent Resistivity (3rd Layer)
  • 9. 9 Electrical Resistivity Tomography: All the groups combinedly have performed Electrical Resistivity Tomography on Demo basis. In this process, 18 electrodes have been placed in the ground @ 1.0 m interval. The model generated by using software is shown below as Fig No. 8: Model developed by Electrical Resistivity Method As per above model, the apparent resistivity varies from 29.2 Ohm-m to 52.9 Ohm-m. Discussion: 1. The objective of this research is to evaluate the water potential of the study area by investigating the shallow subsurface aquifer material properties and moisture distribution using 2D ERT techniques. During the shallow tube well design and development in the study area, some patches of land does have good potential and some does not, which motivated to understand the aquifer properties, aquifer material, and response. Hence the 2D ERT was carried out, oriented around the pond in the center and five ERT profiles.