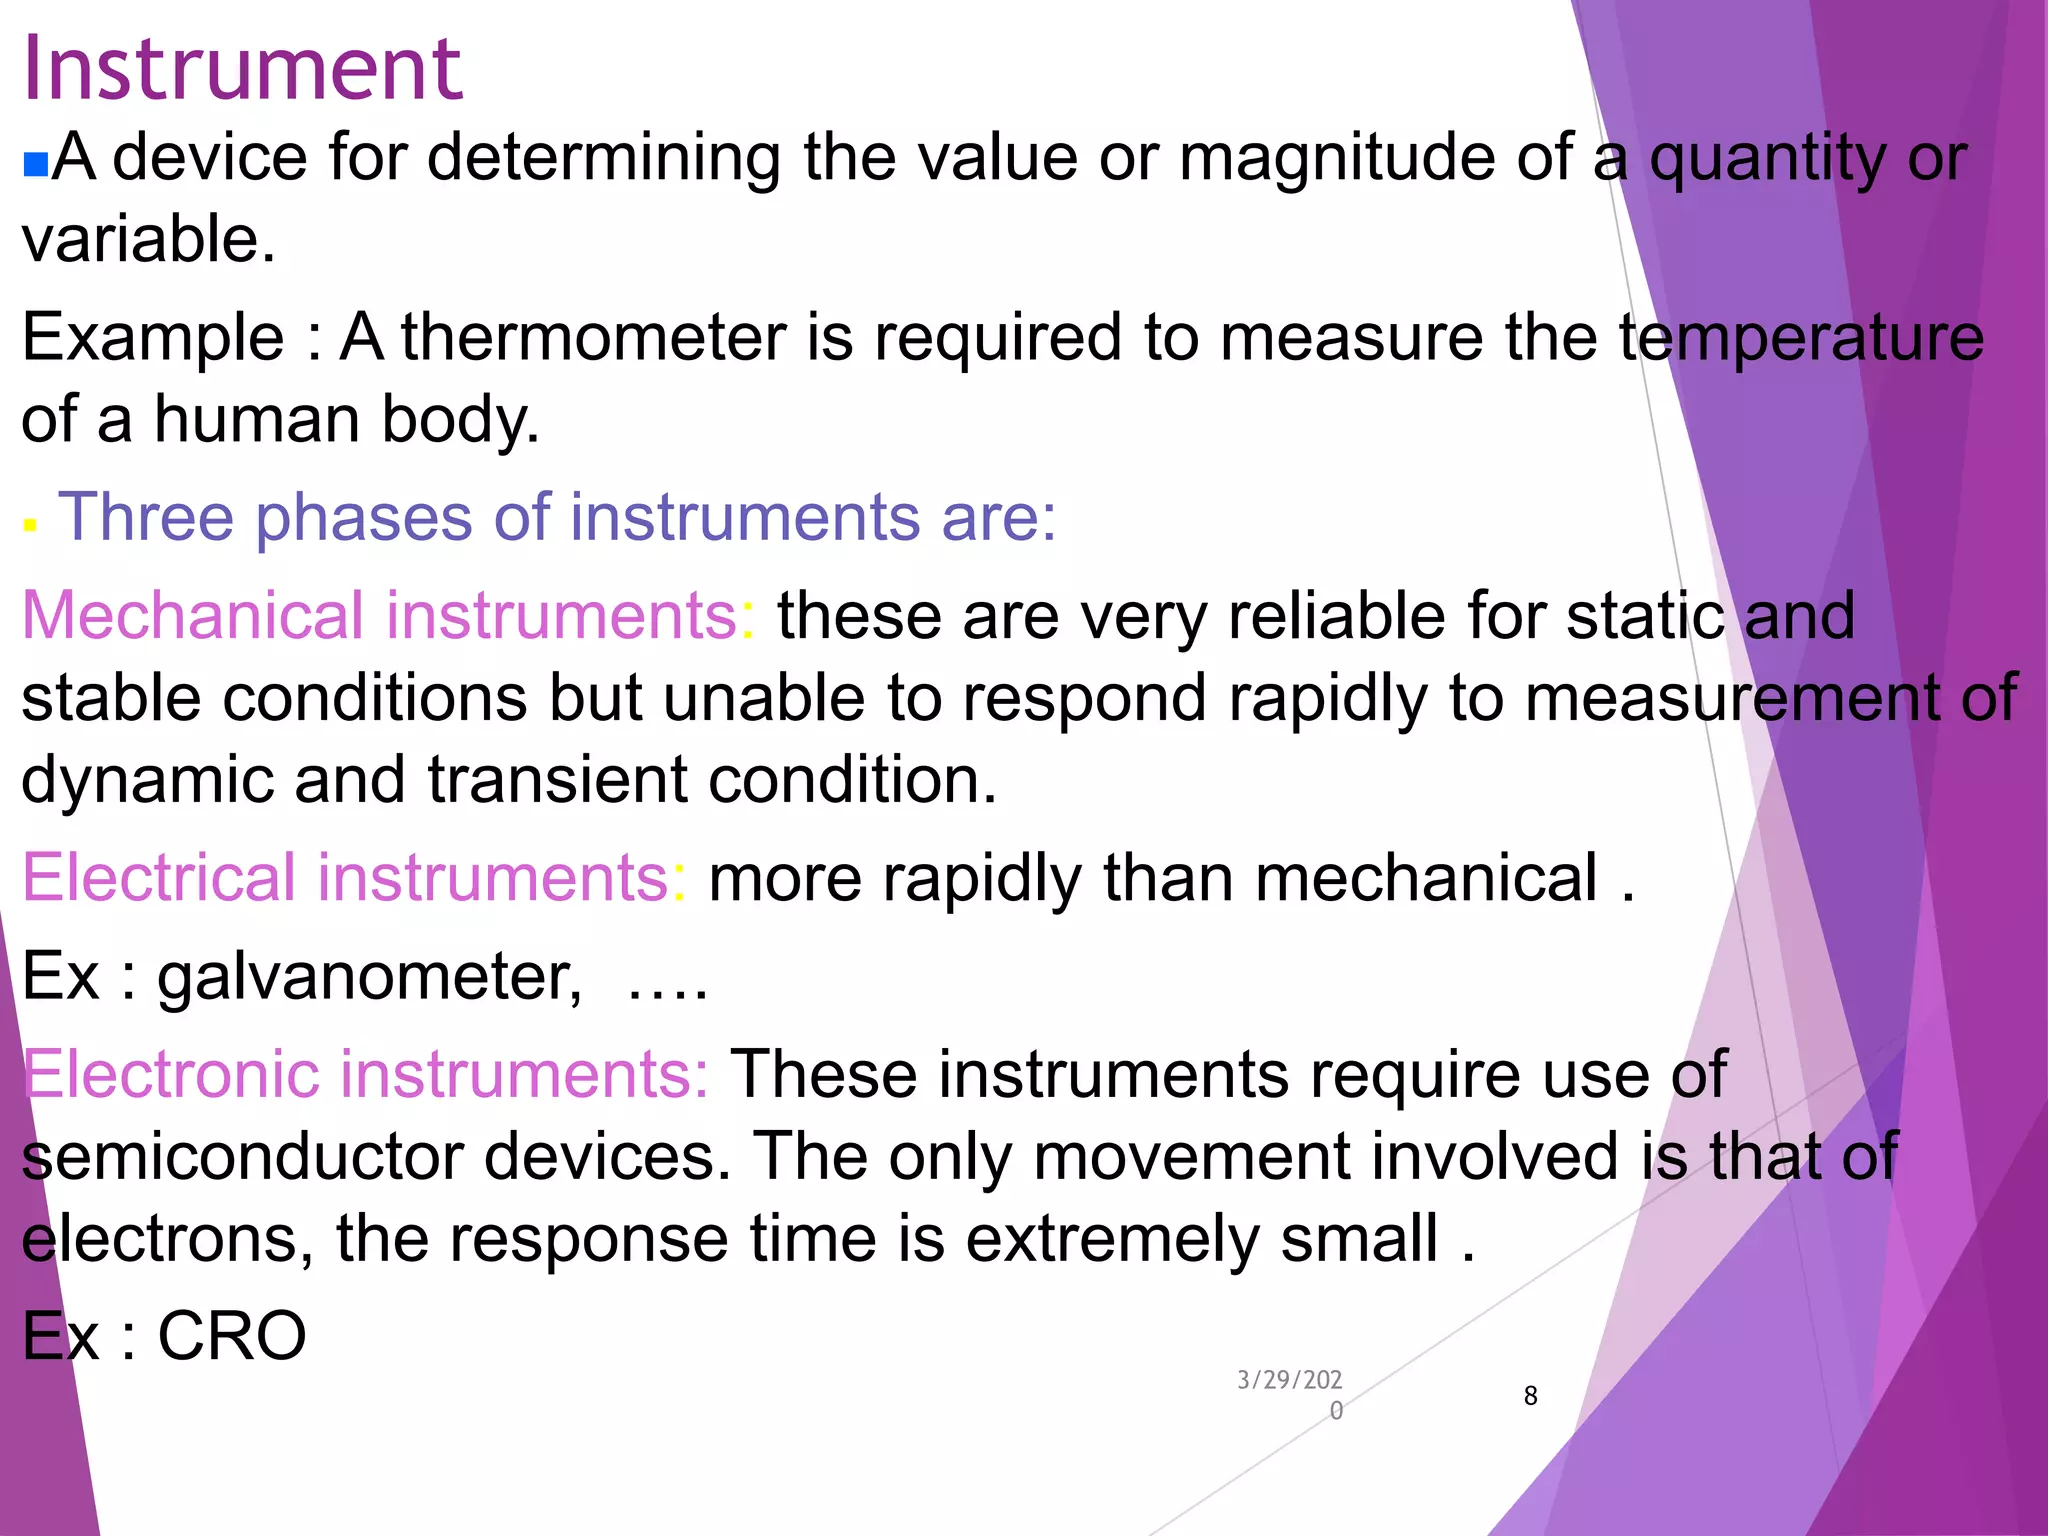
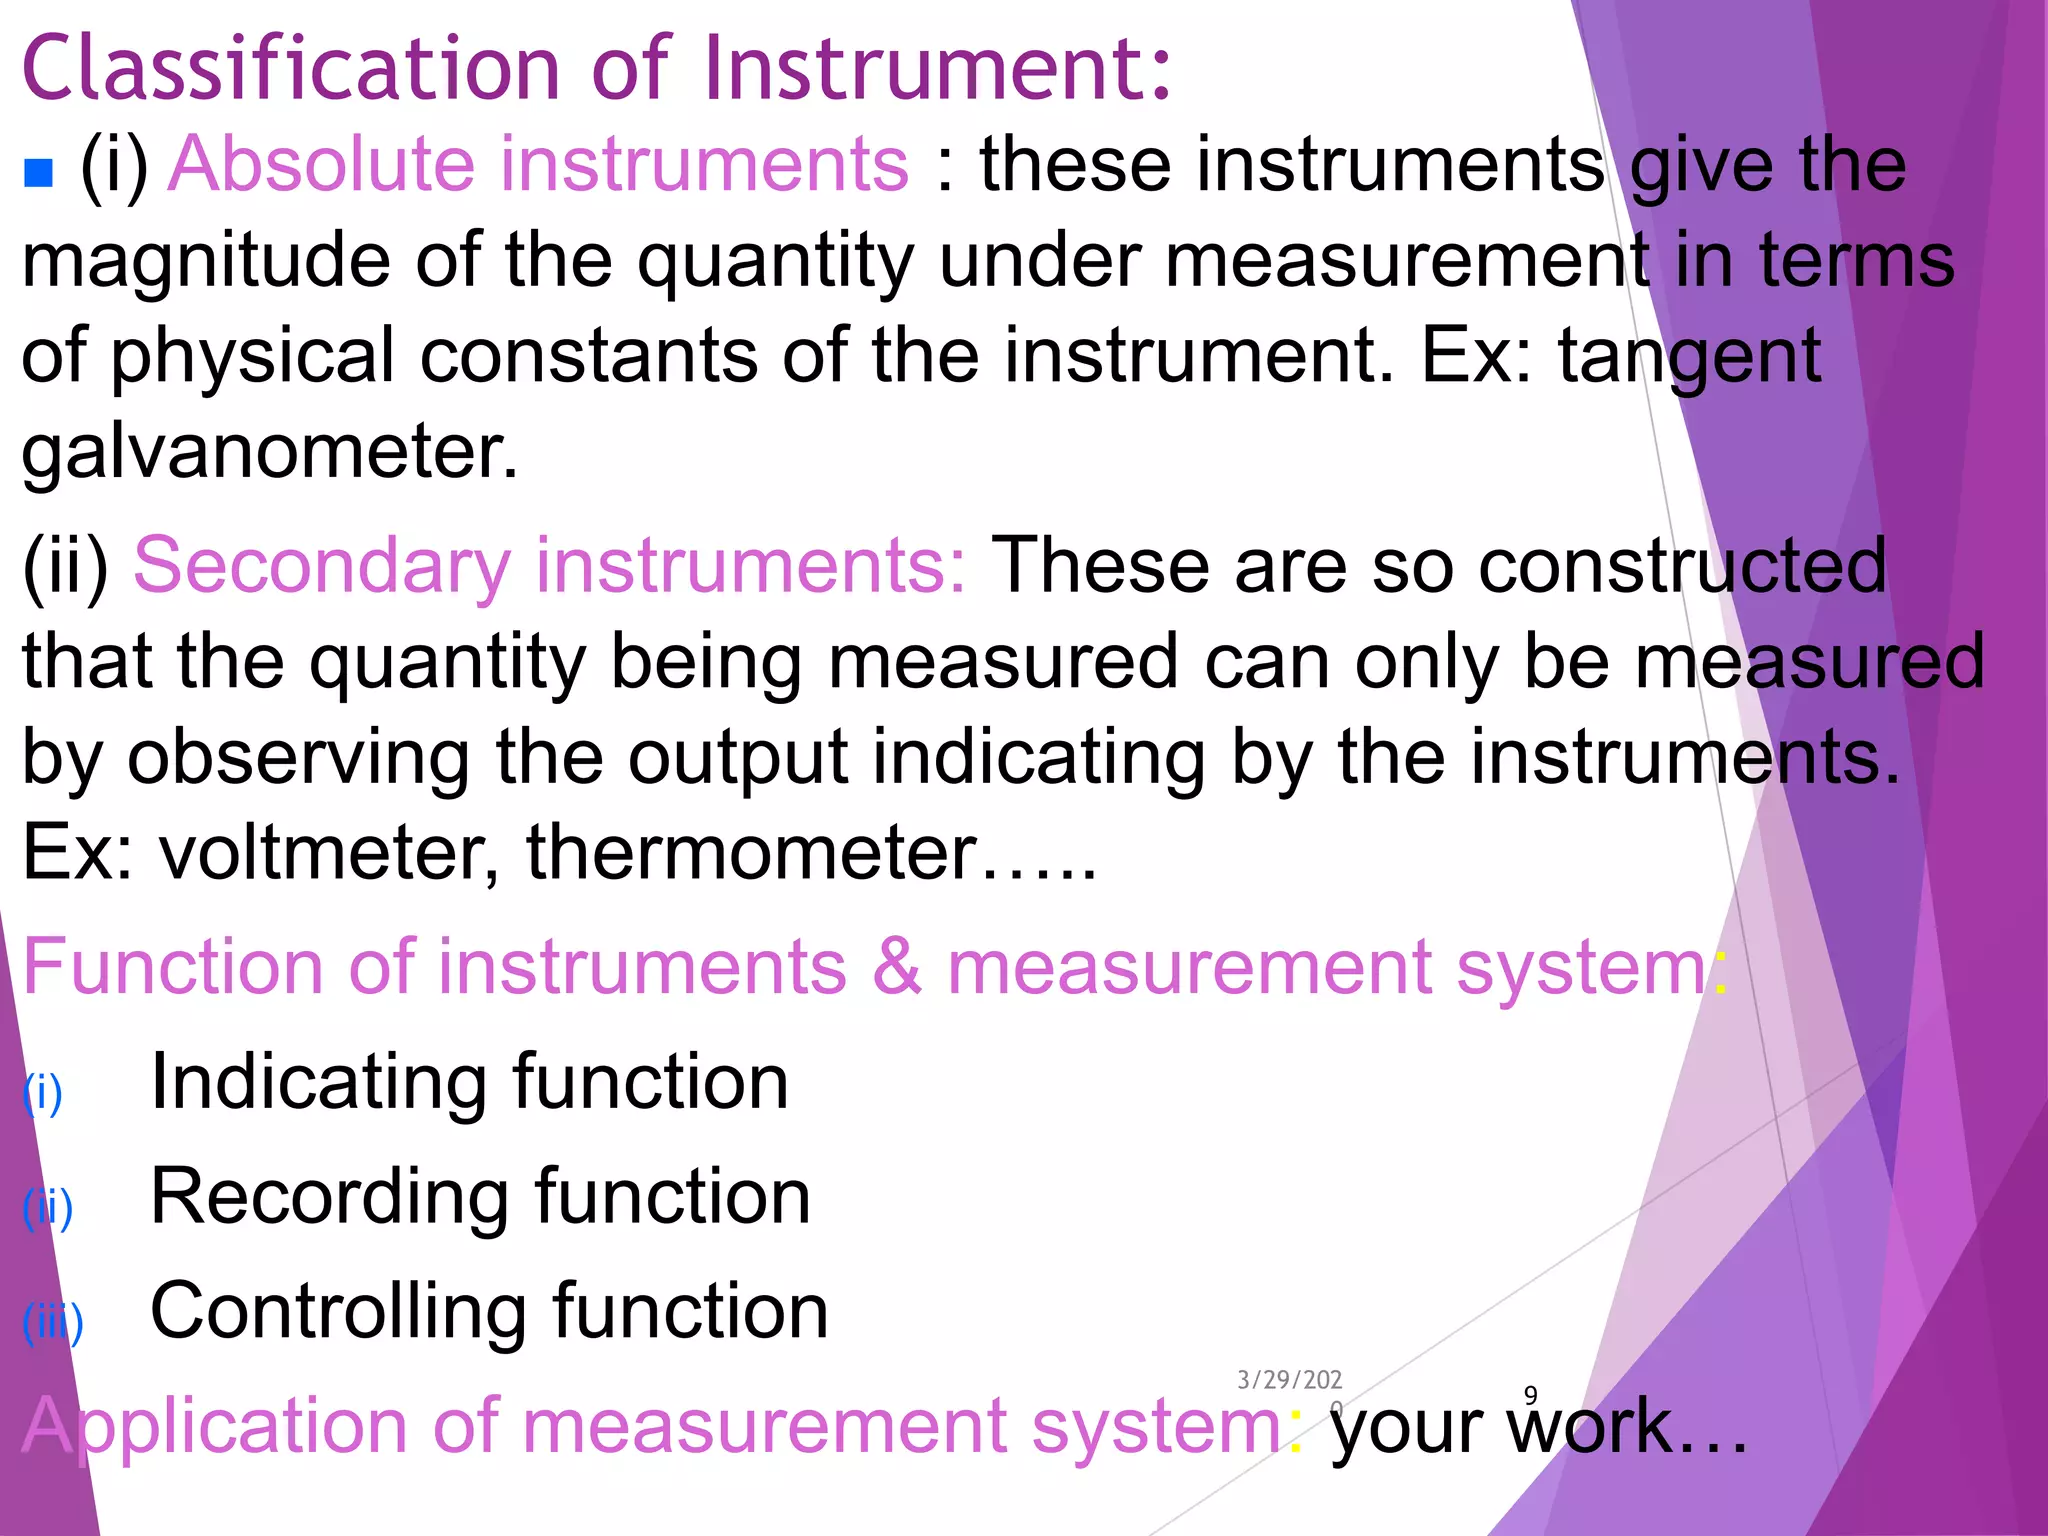
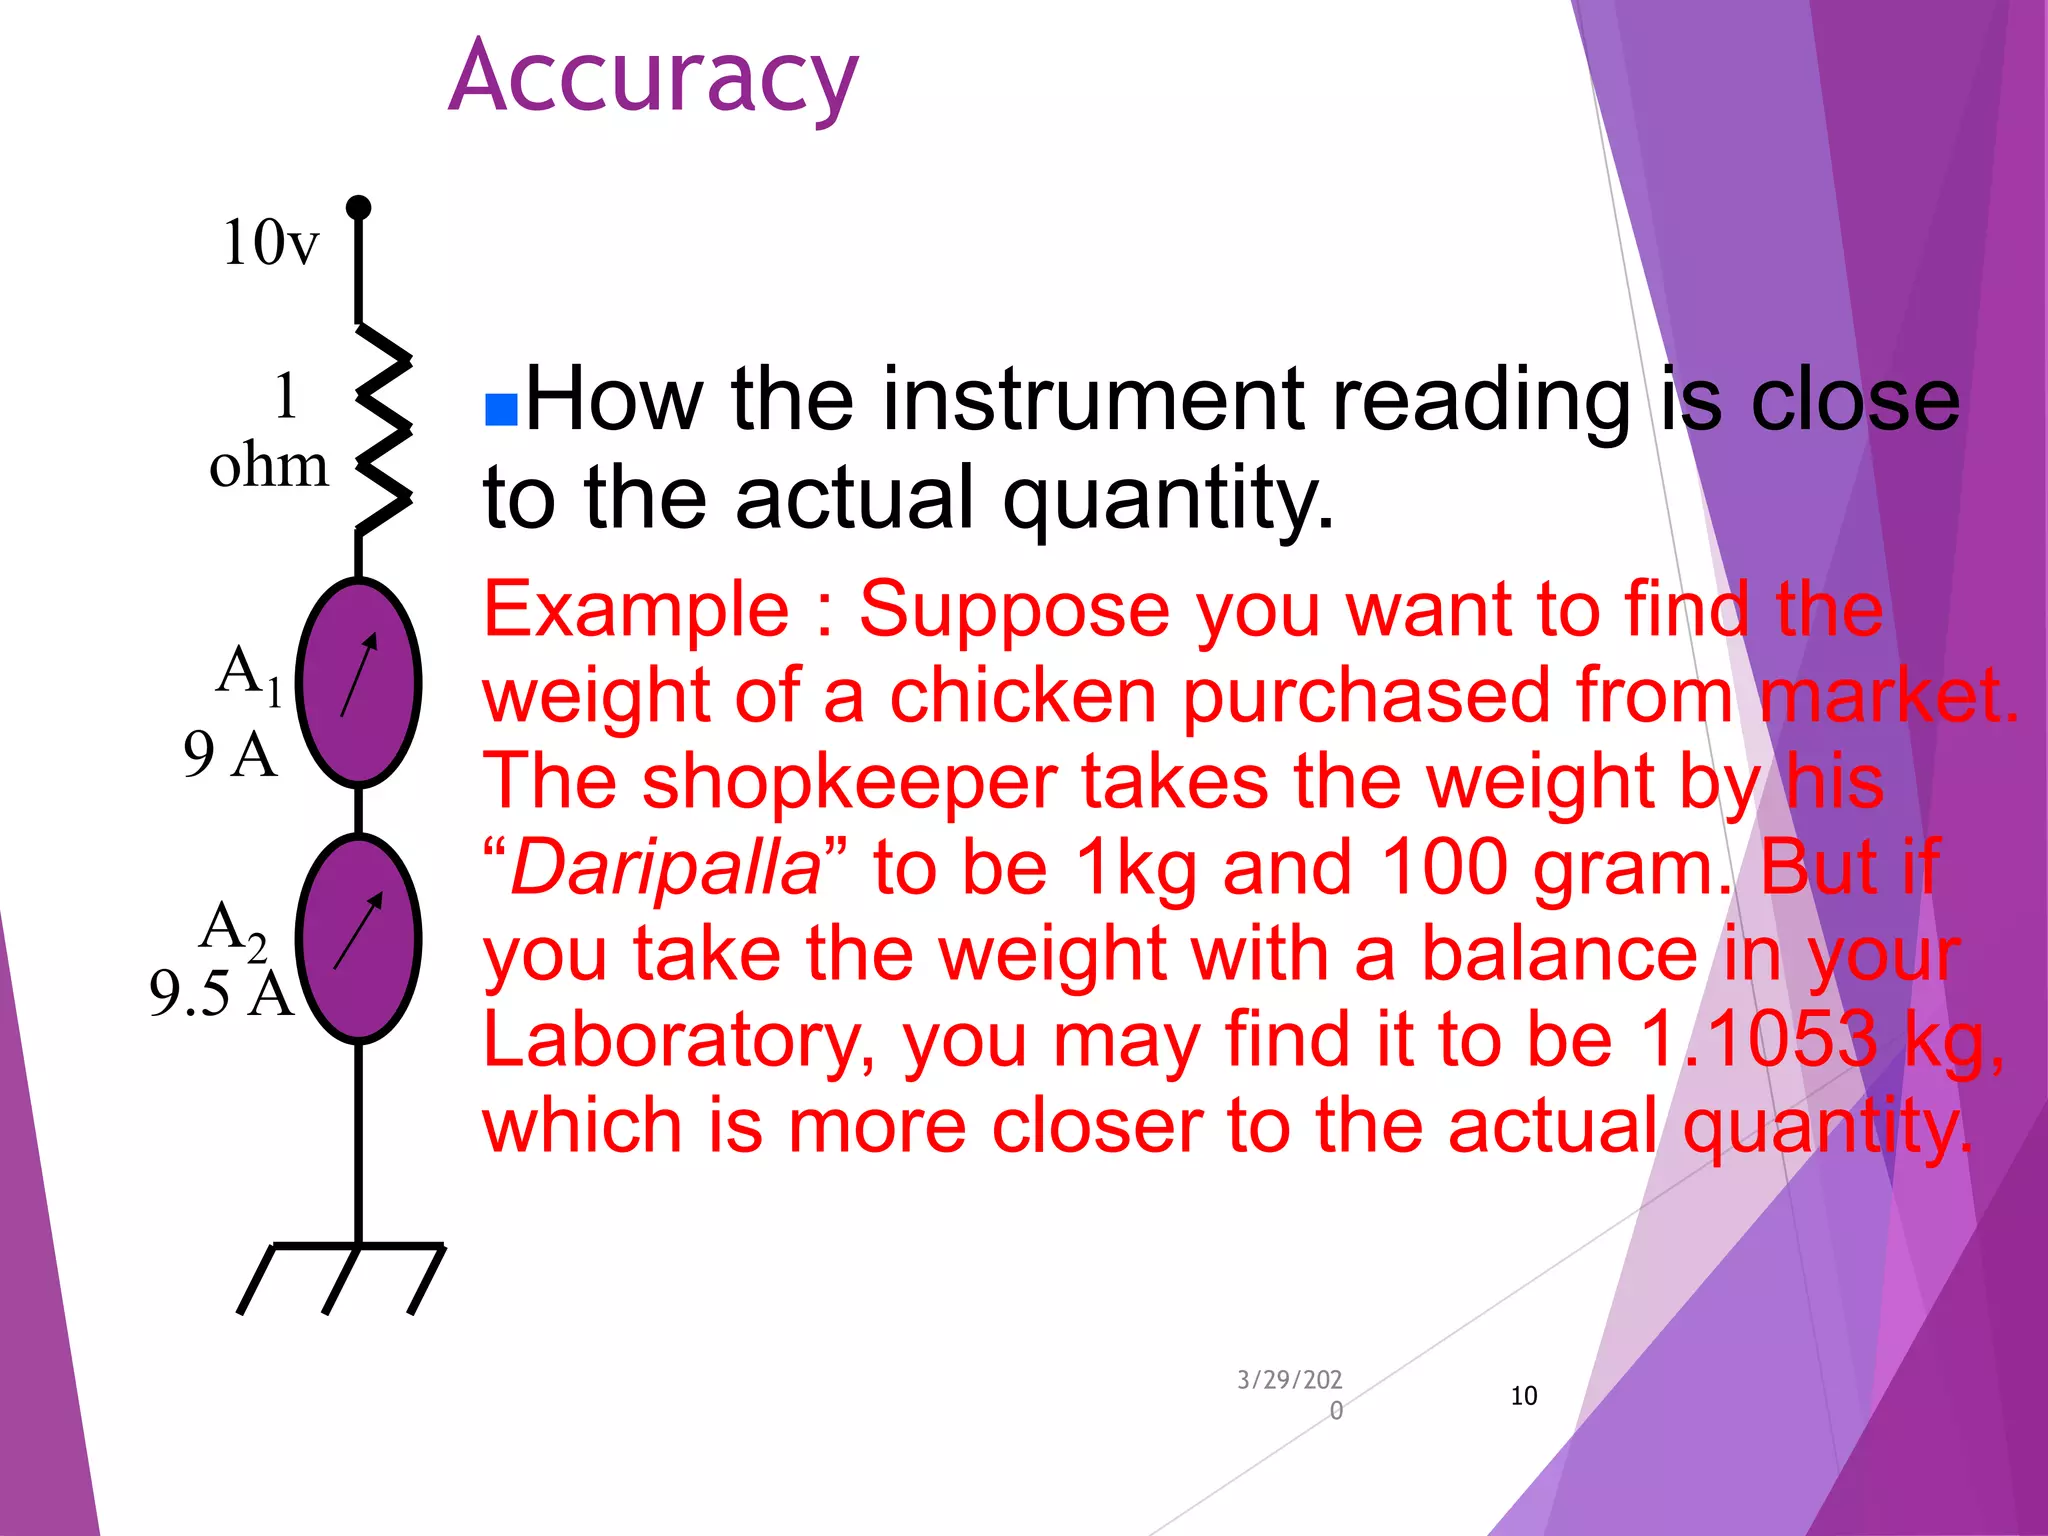
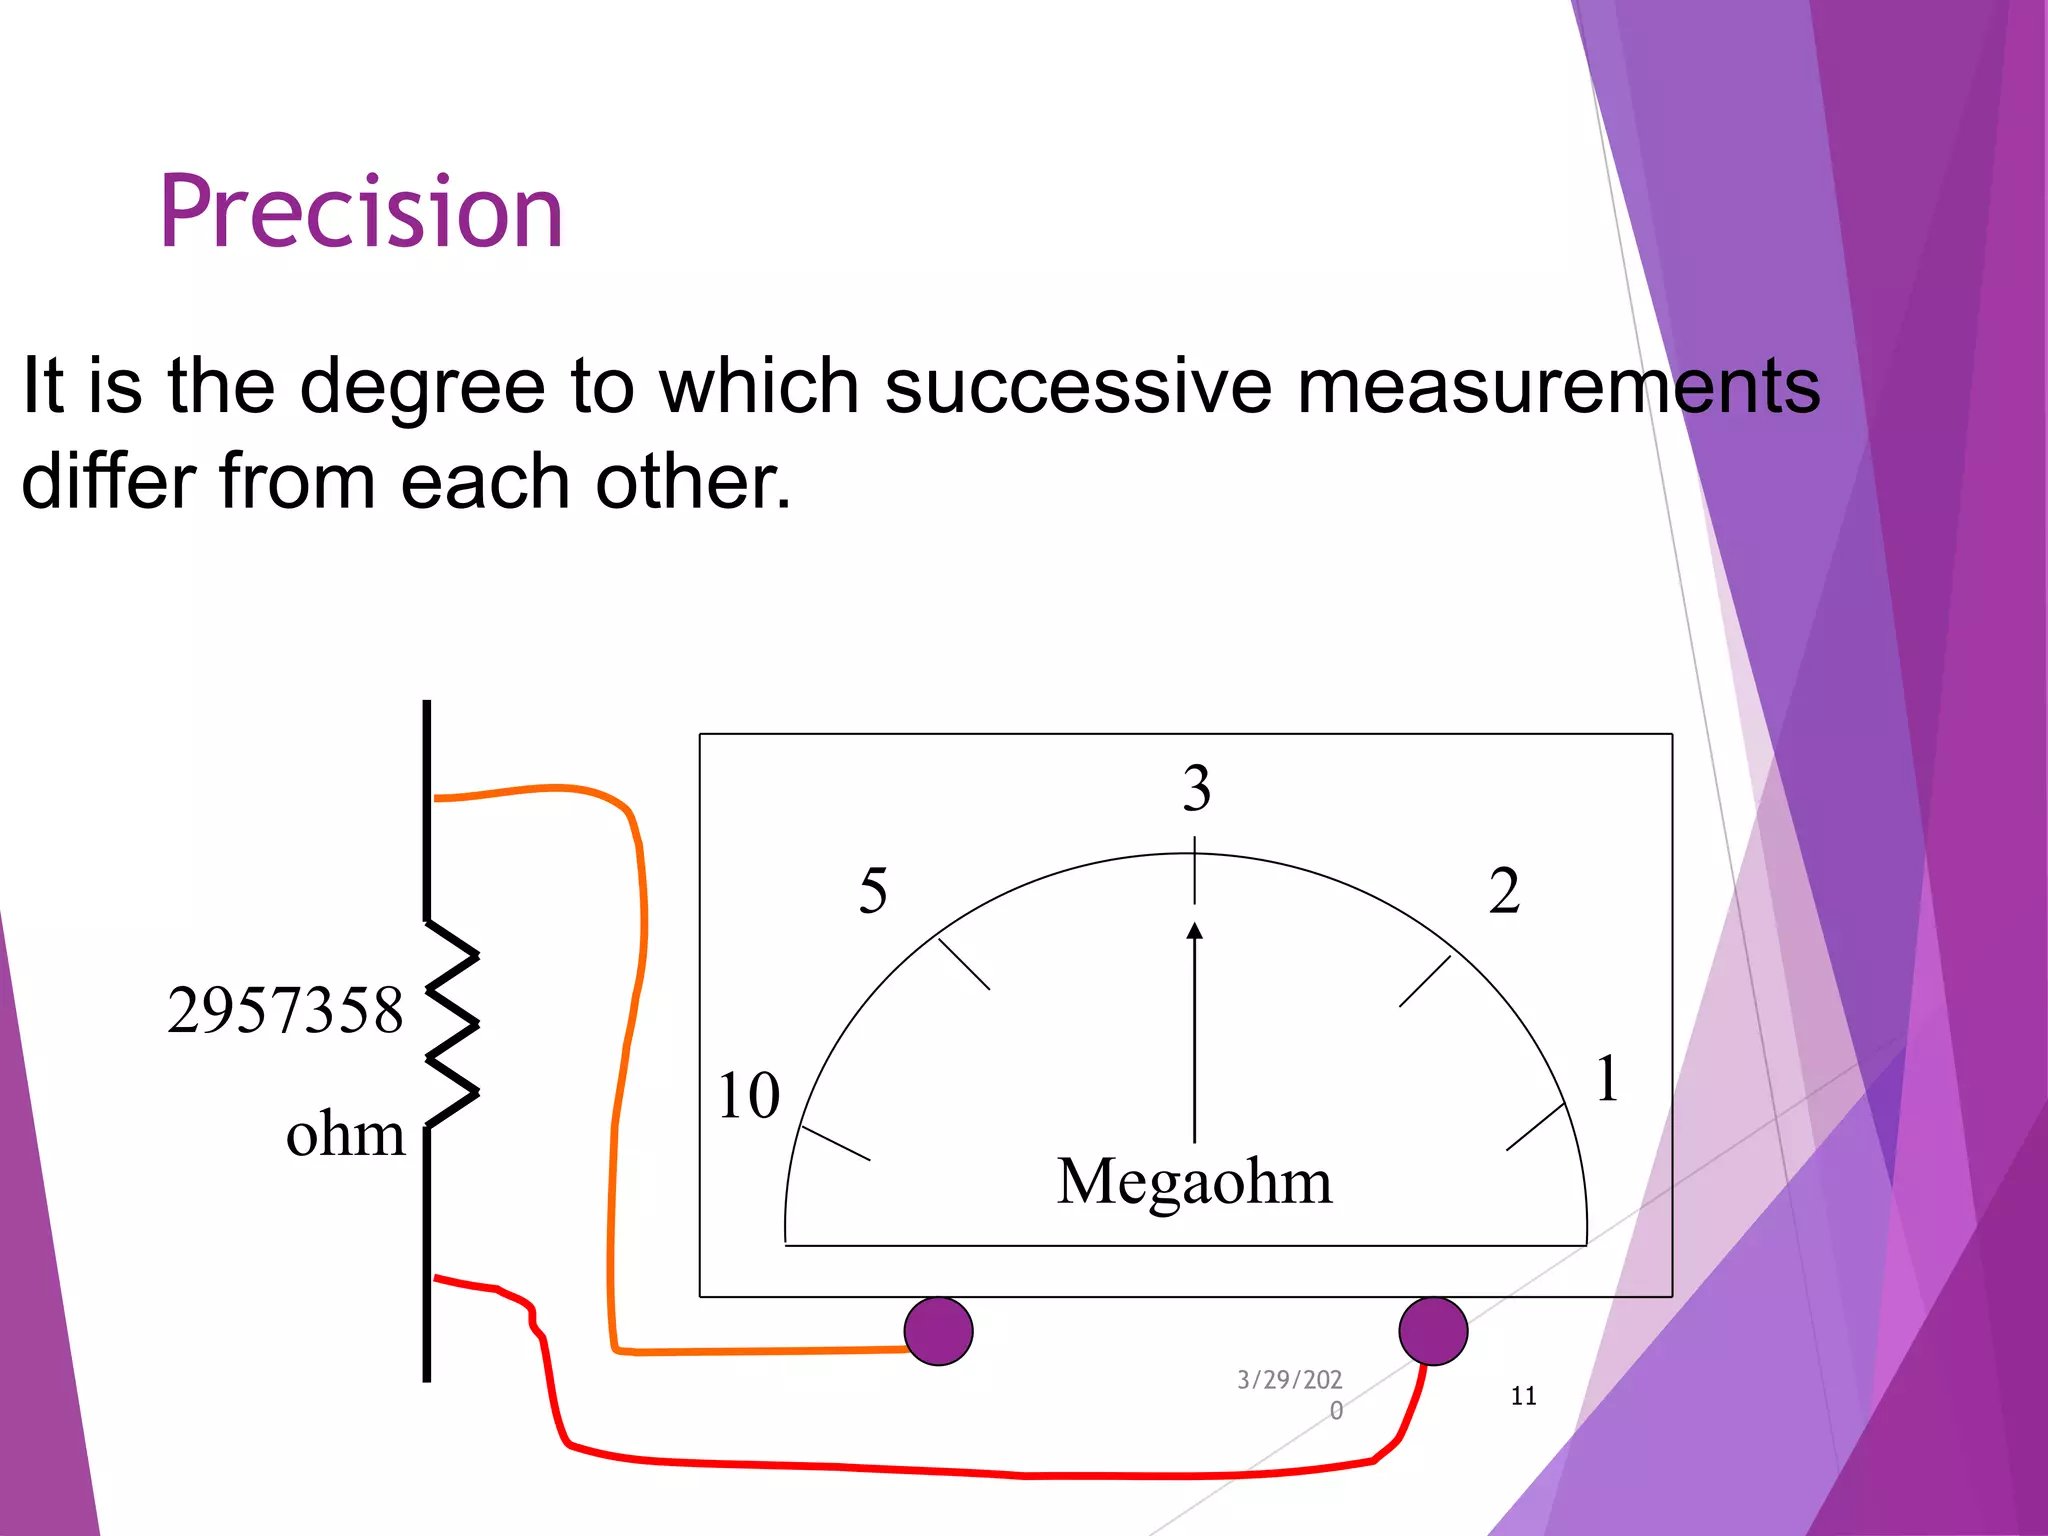
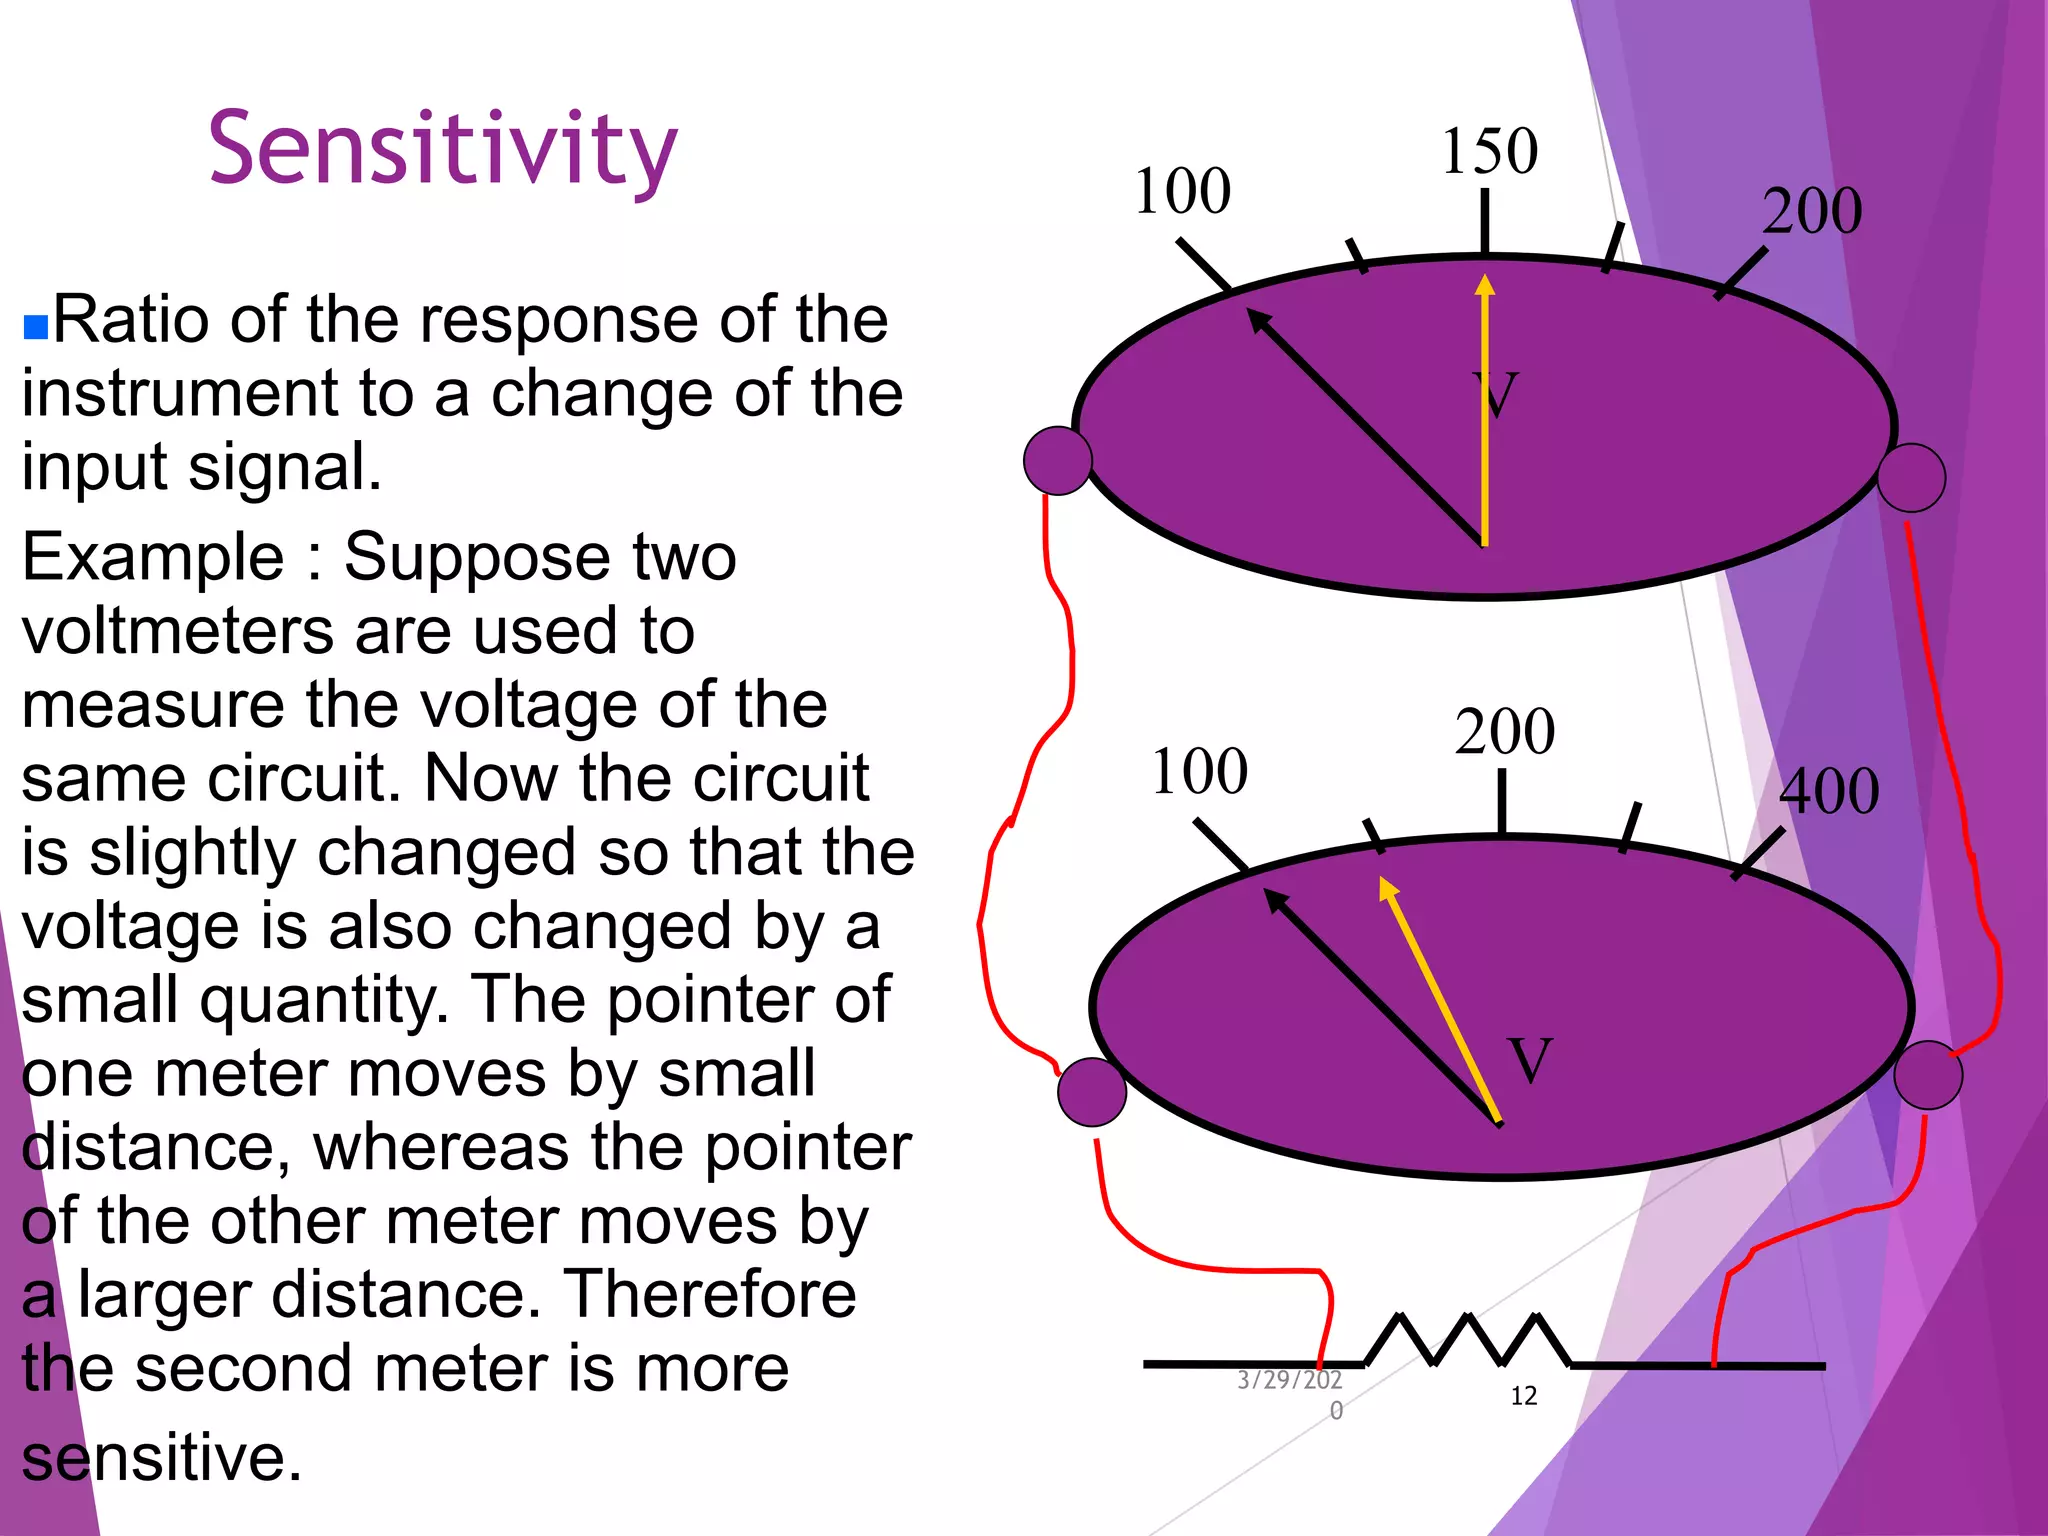
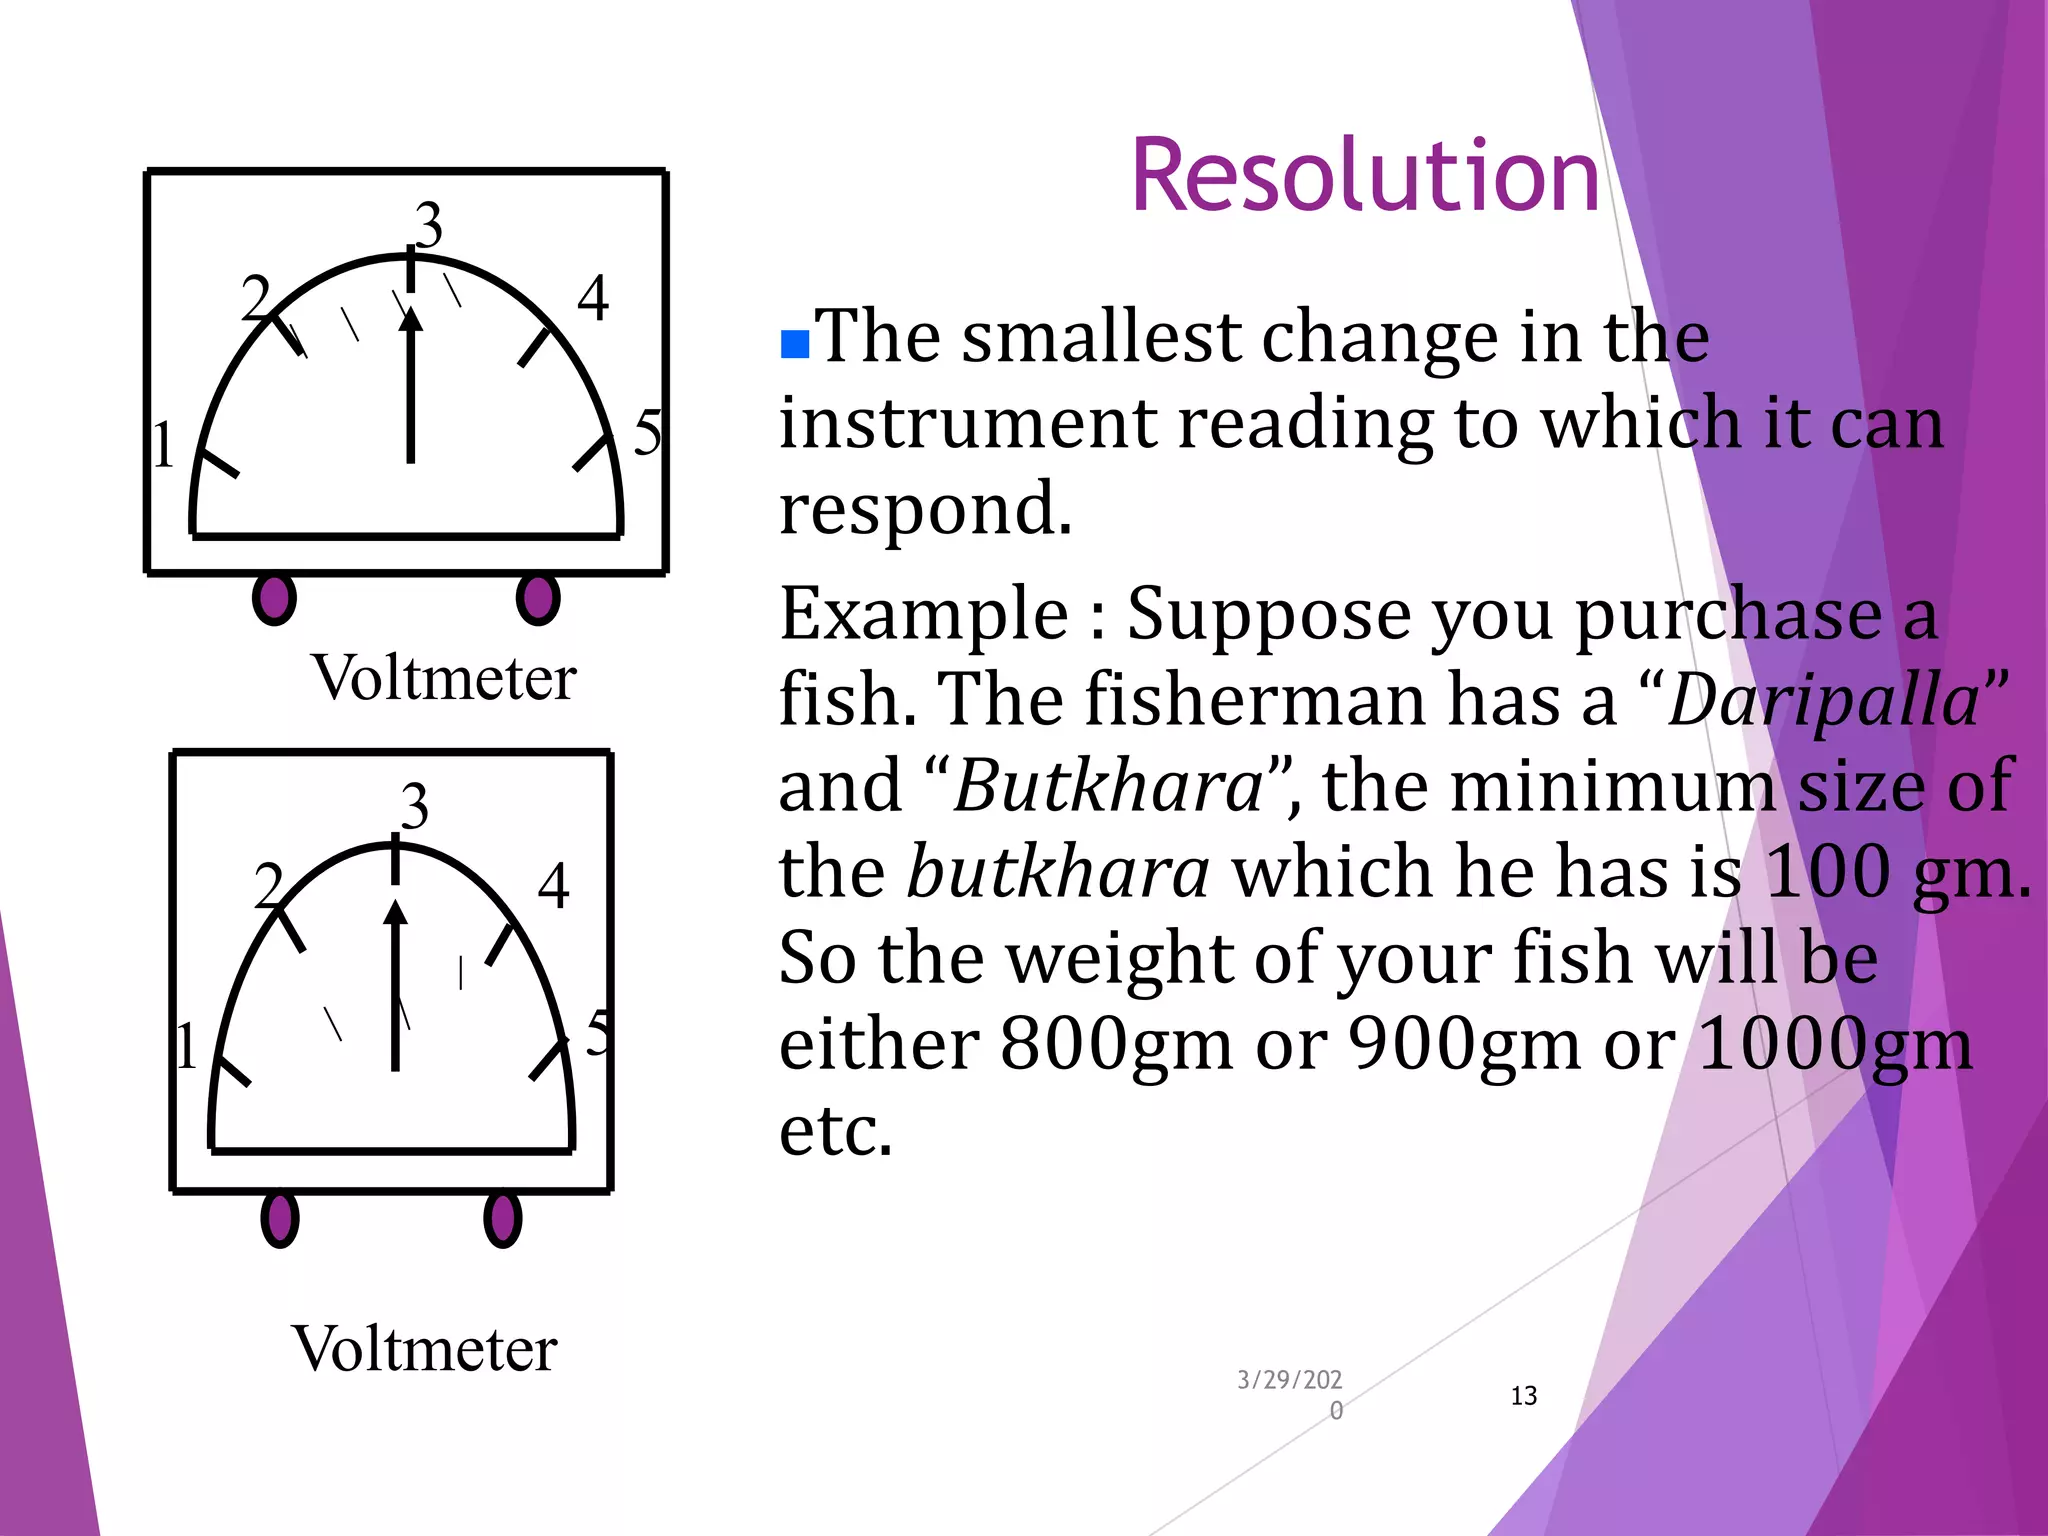
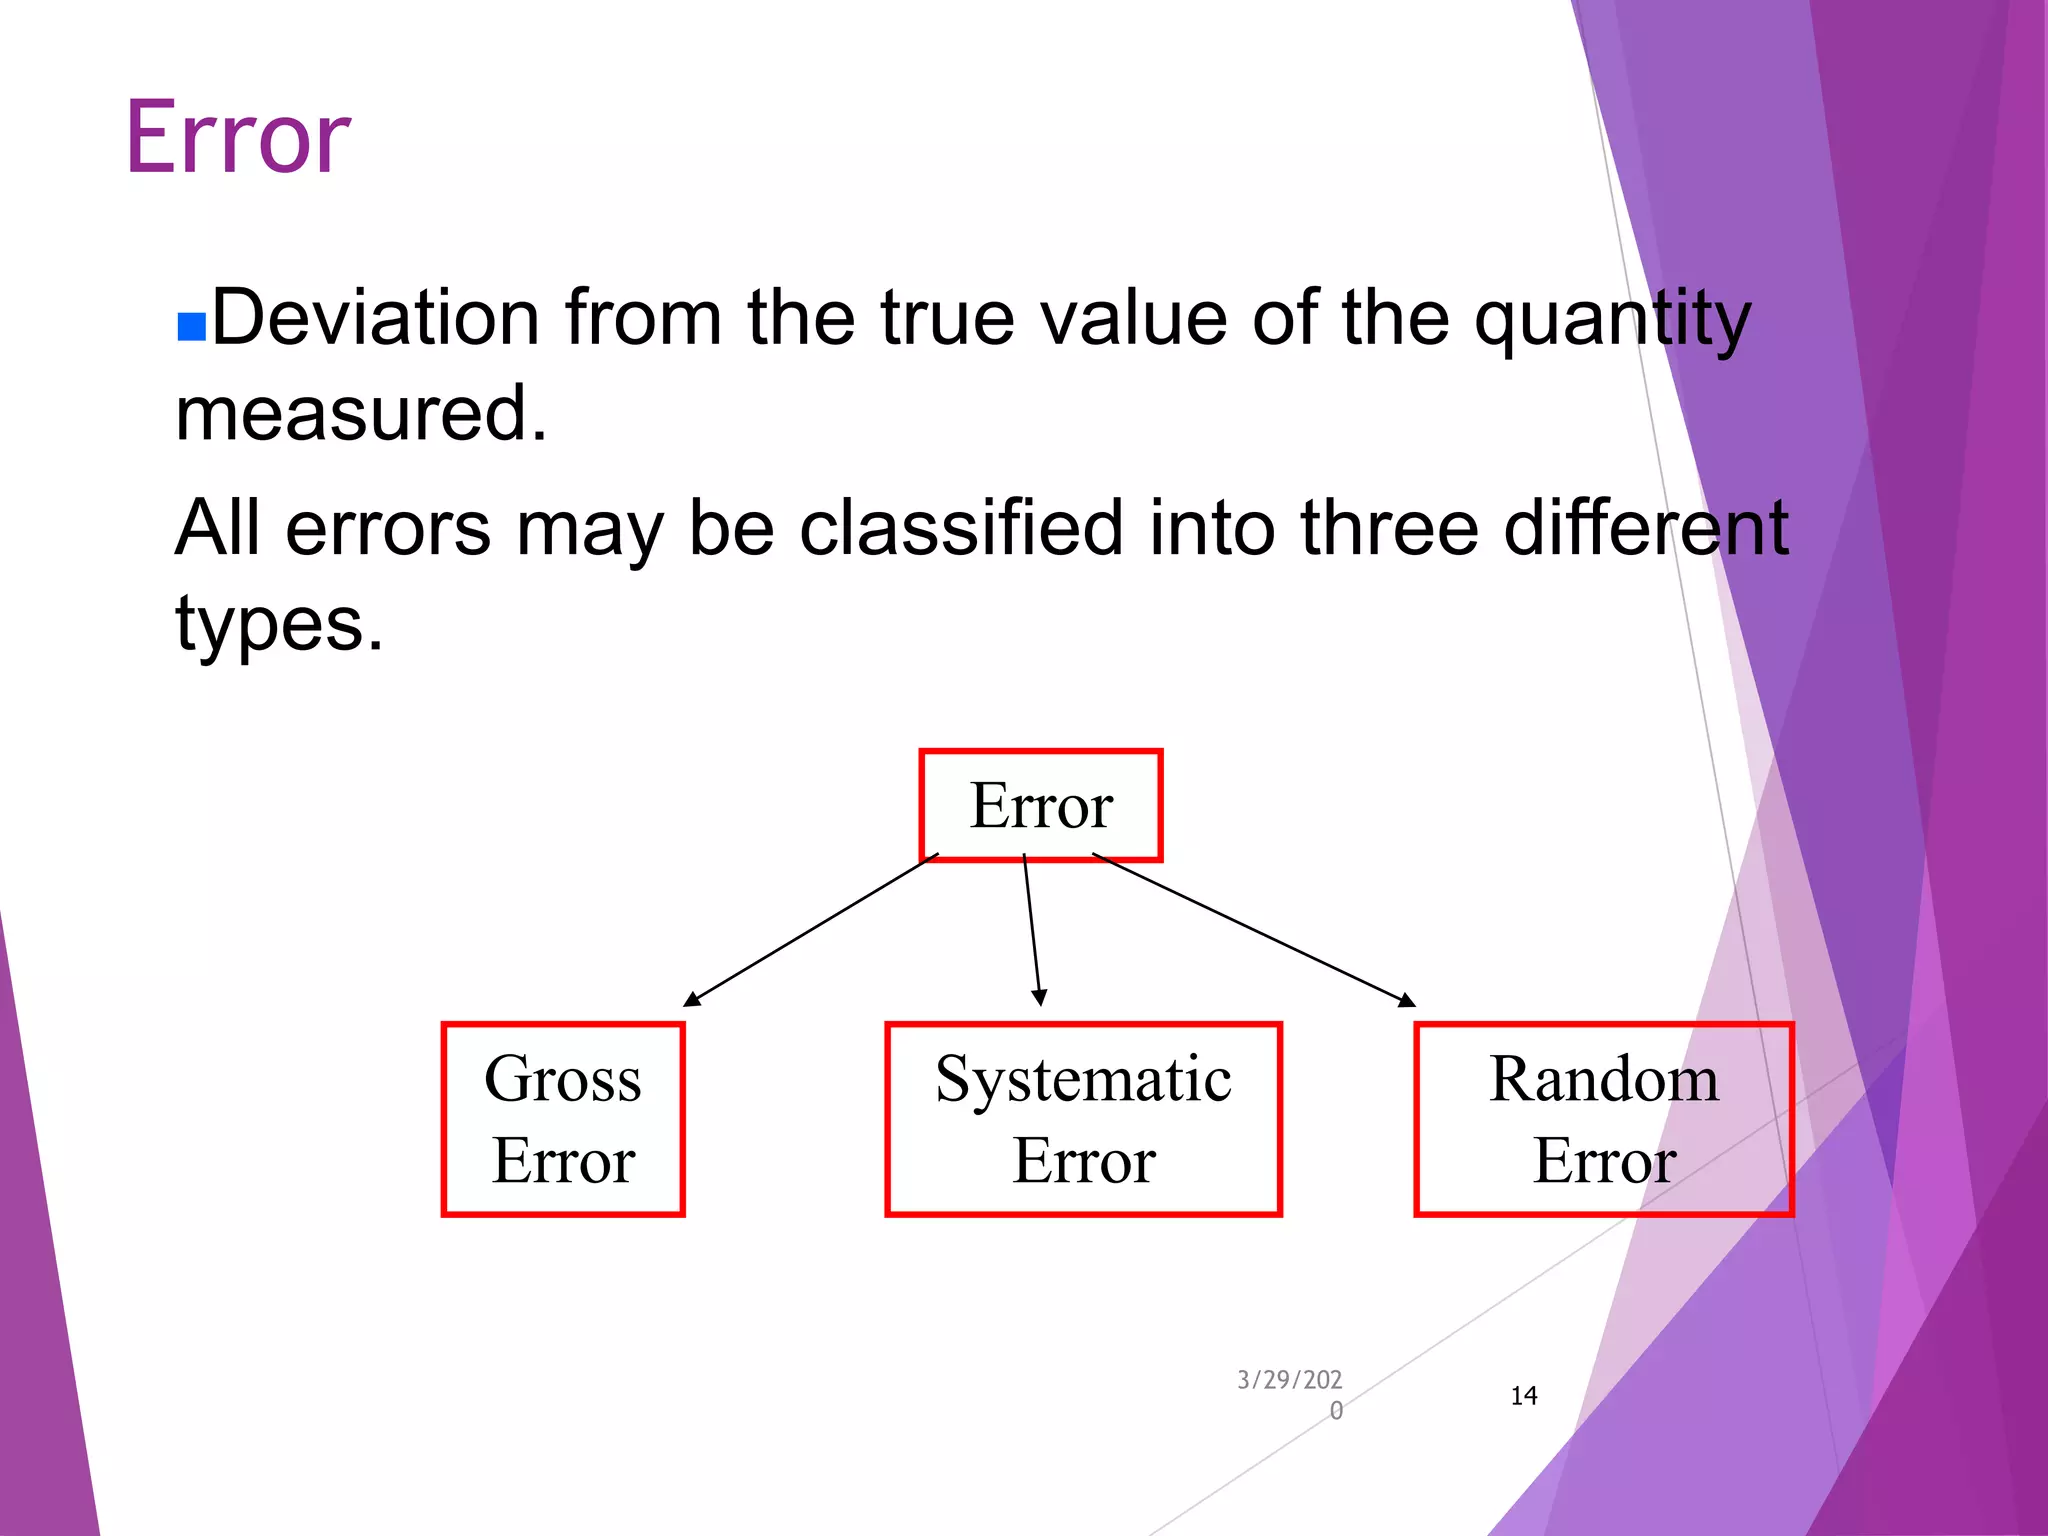
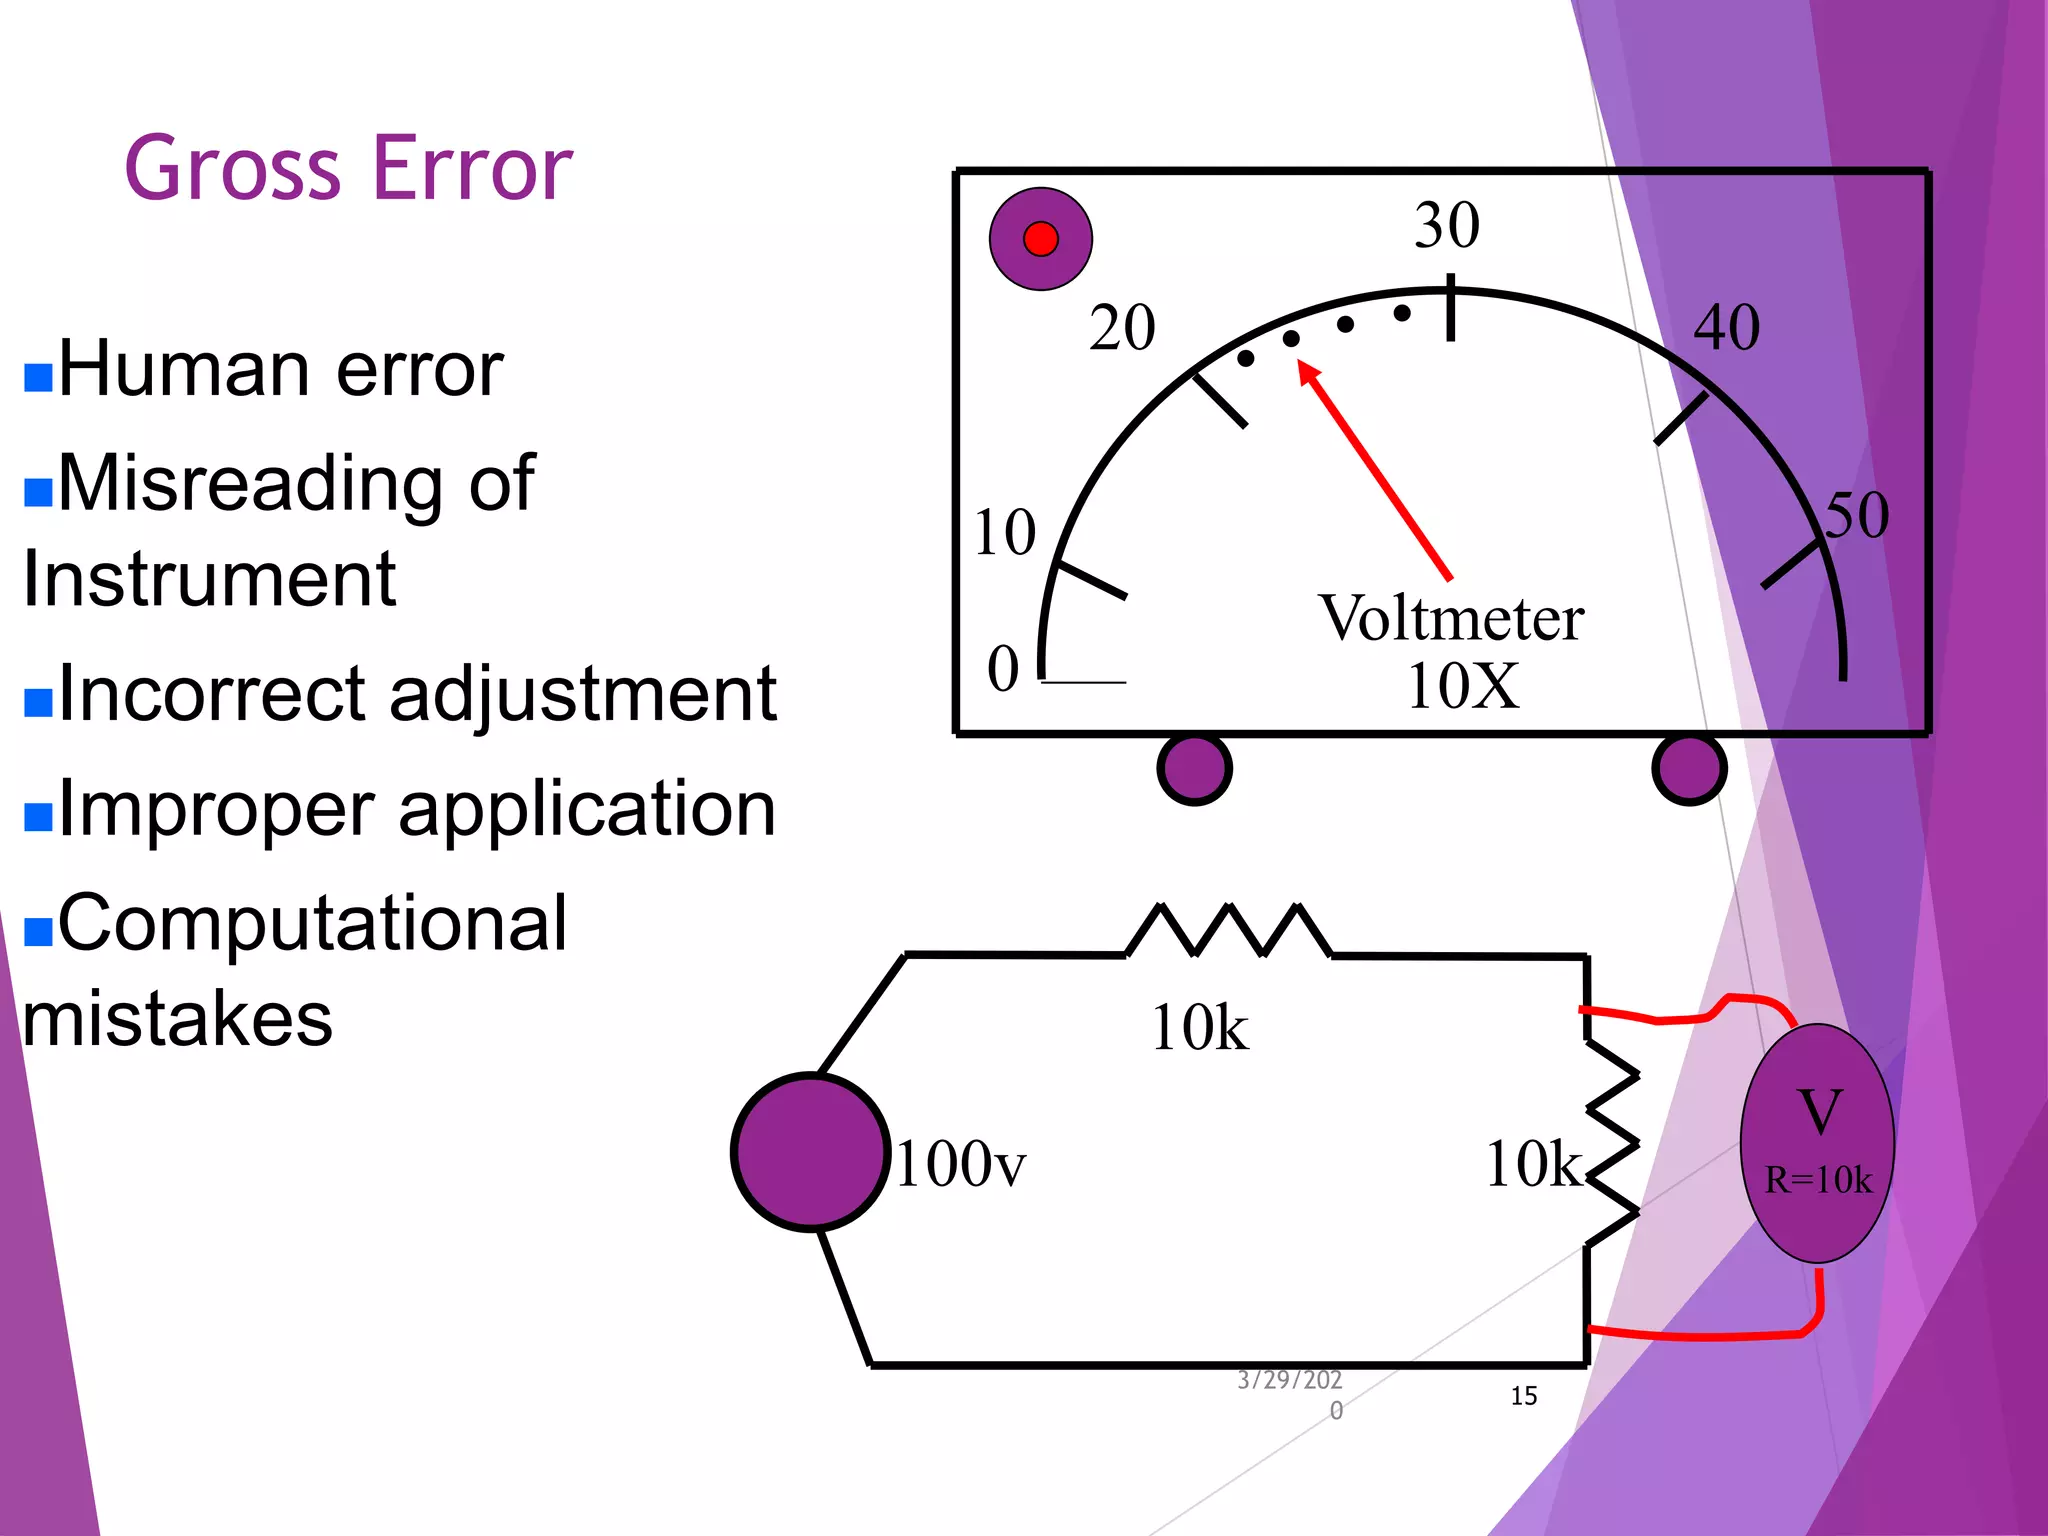
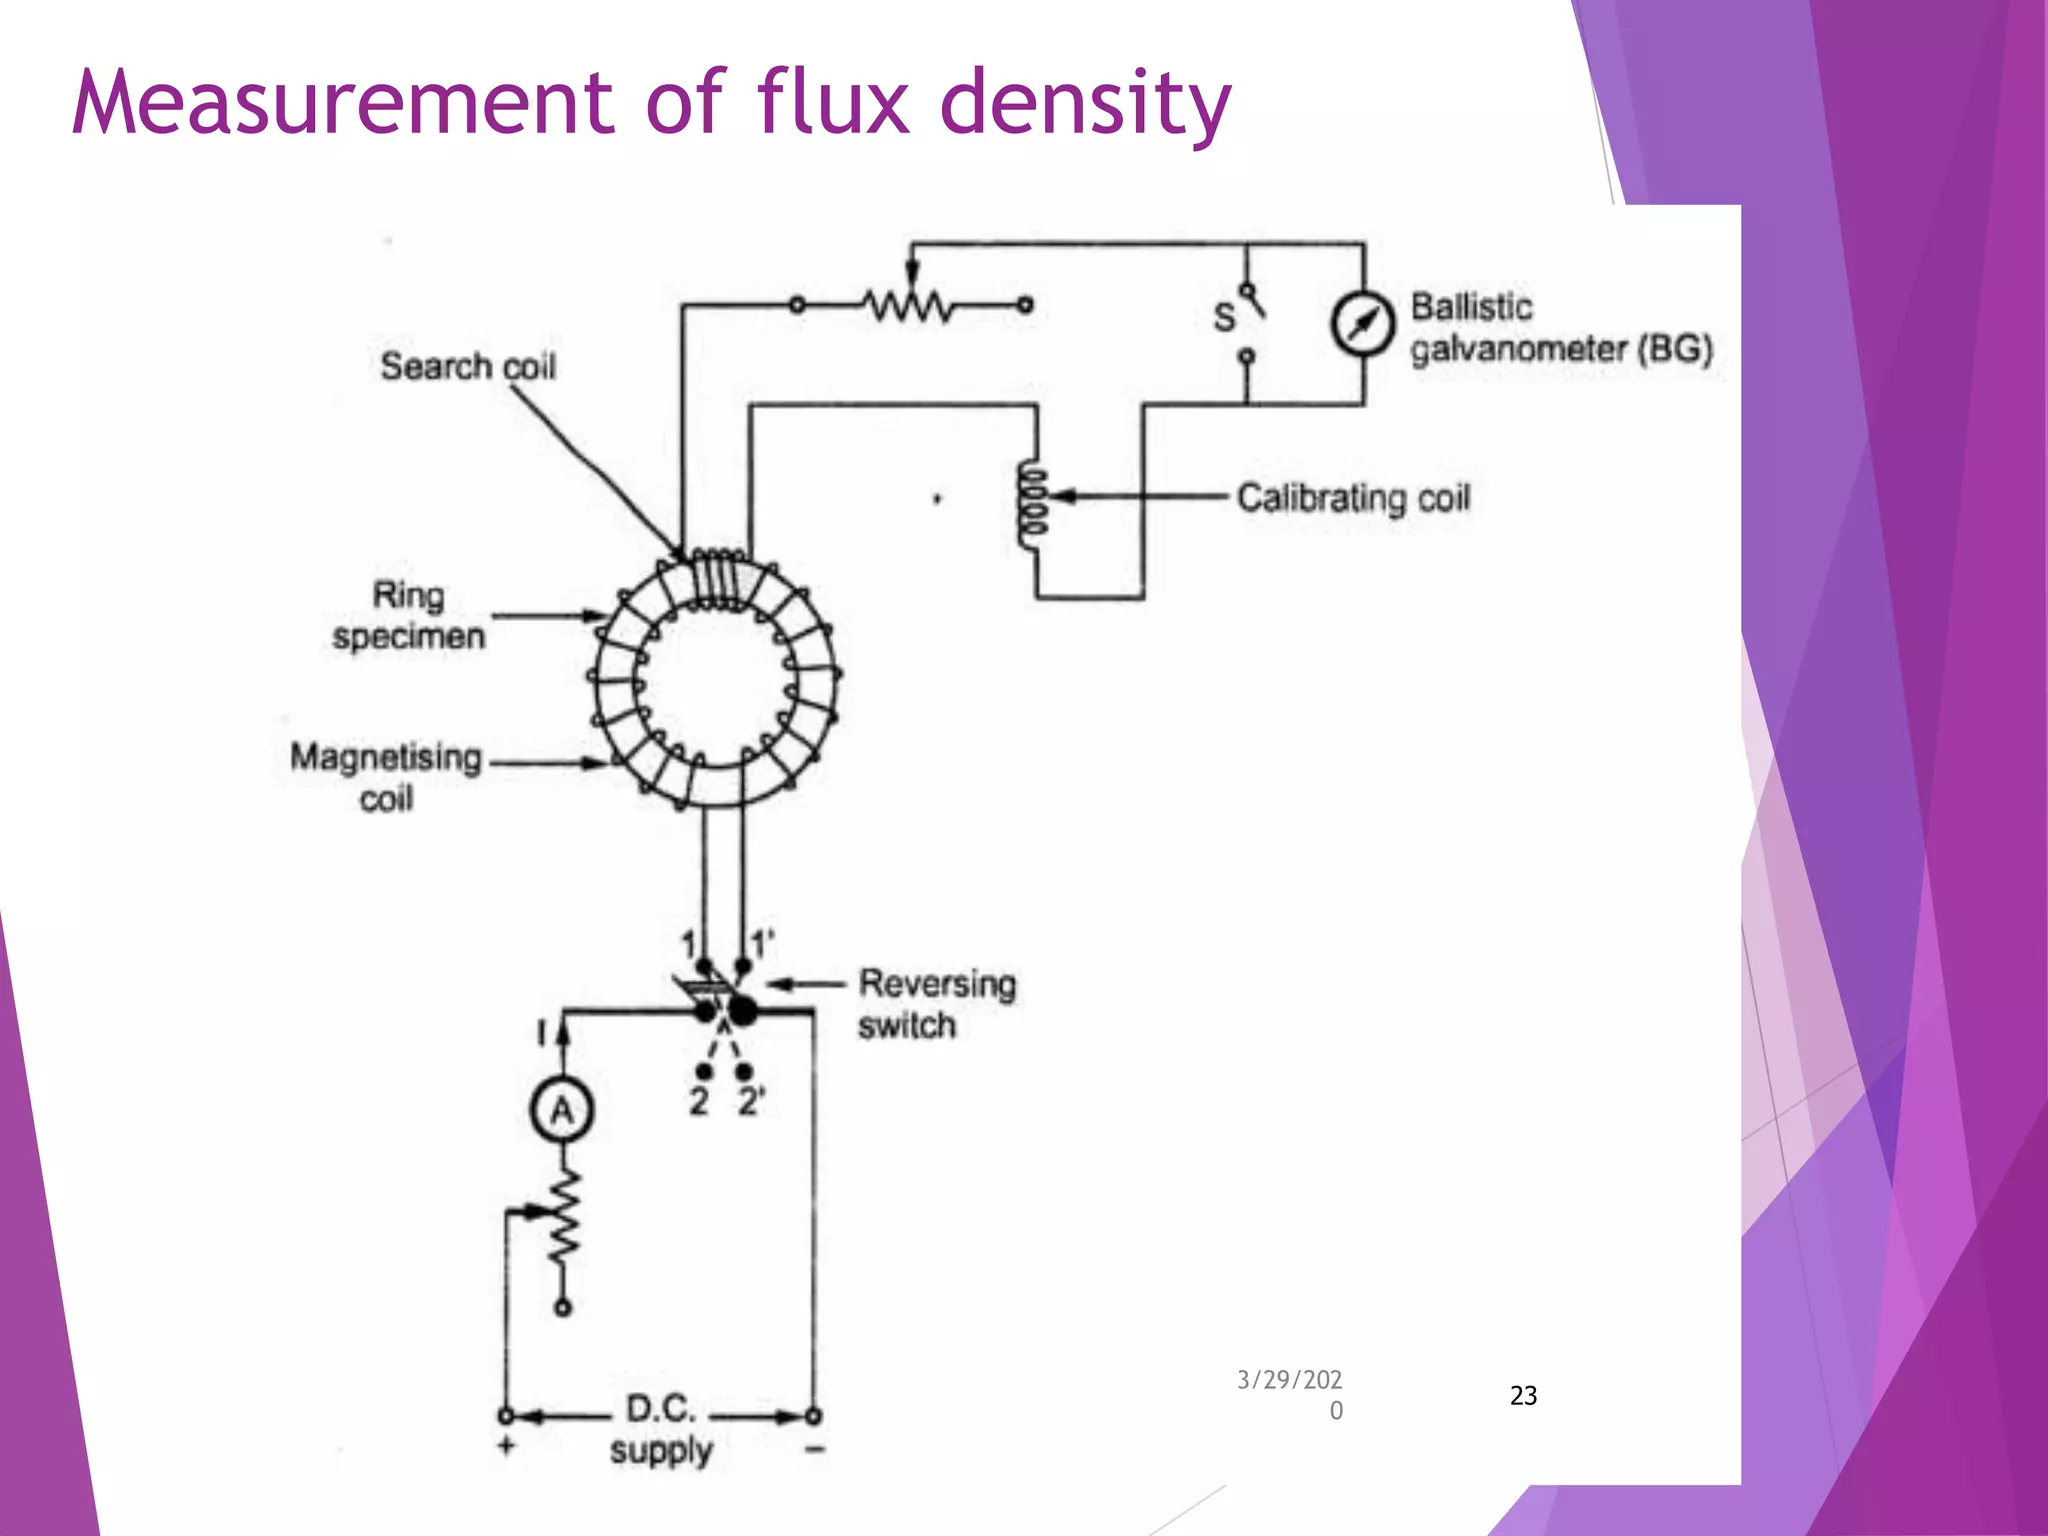
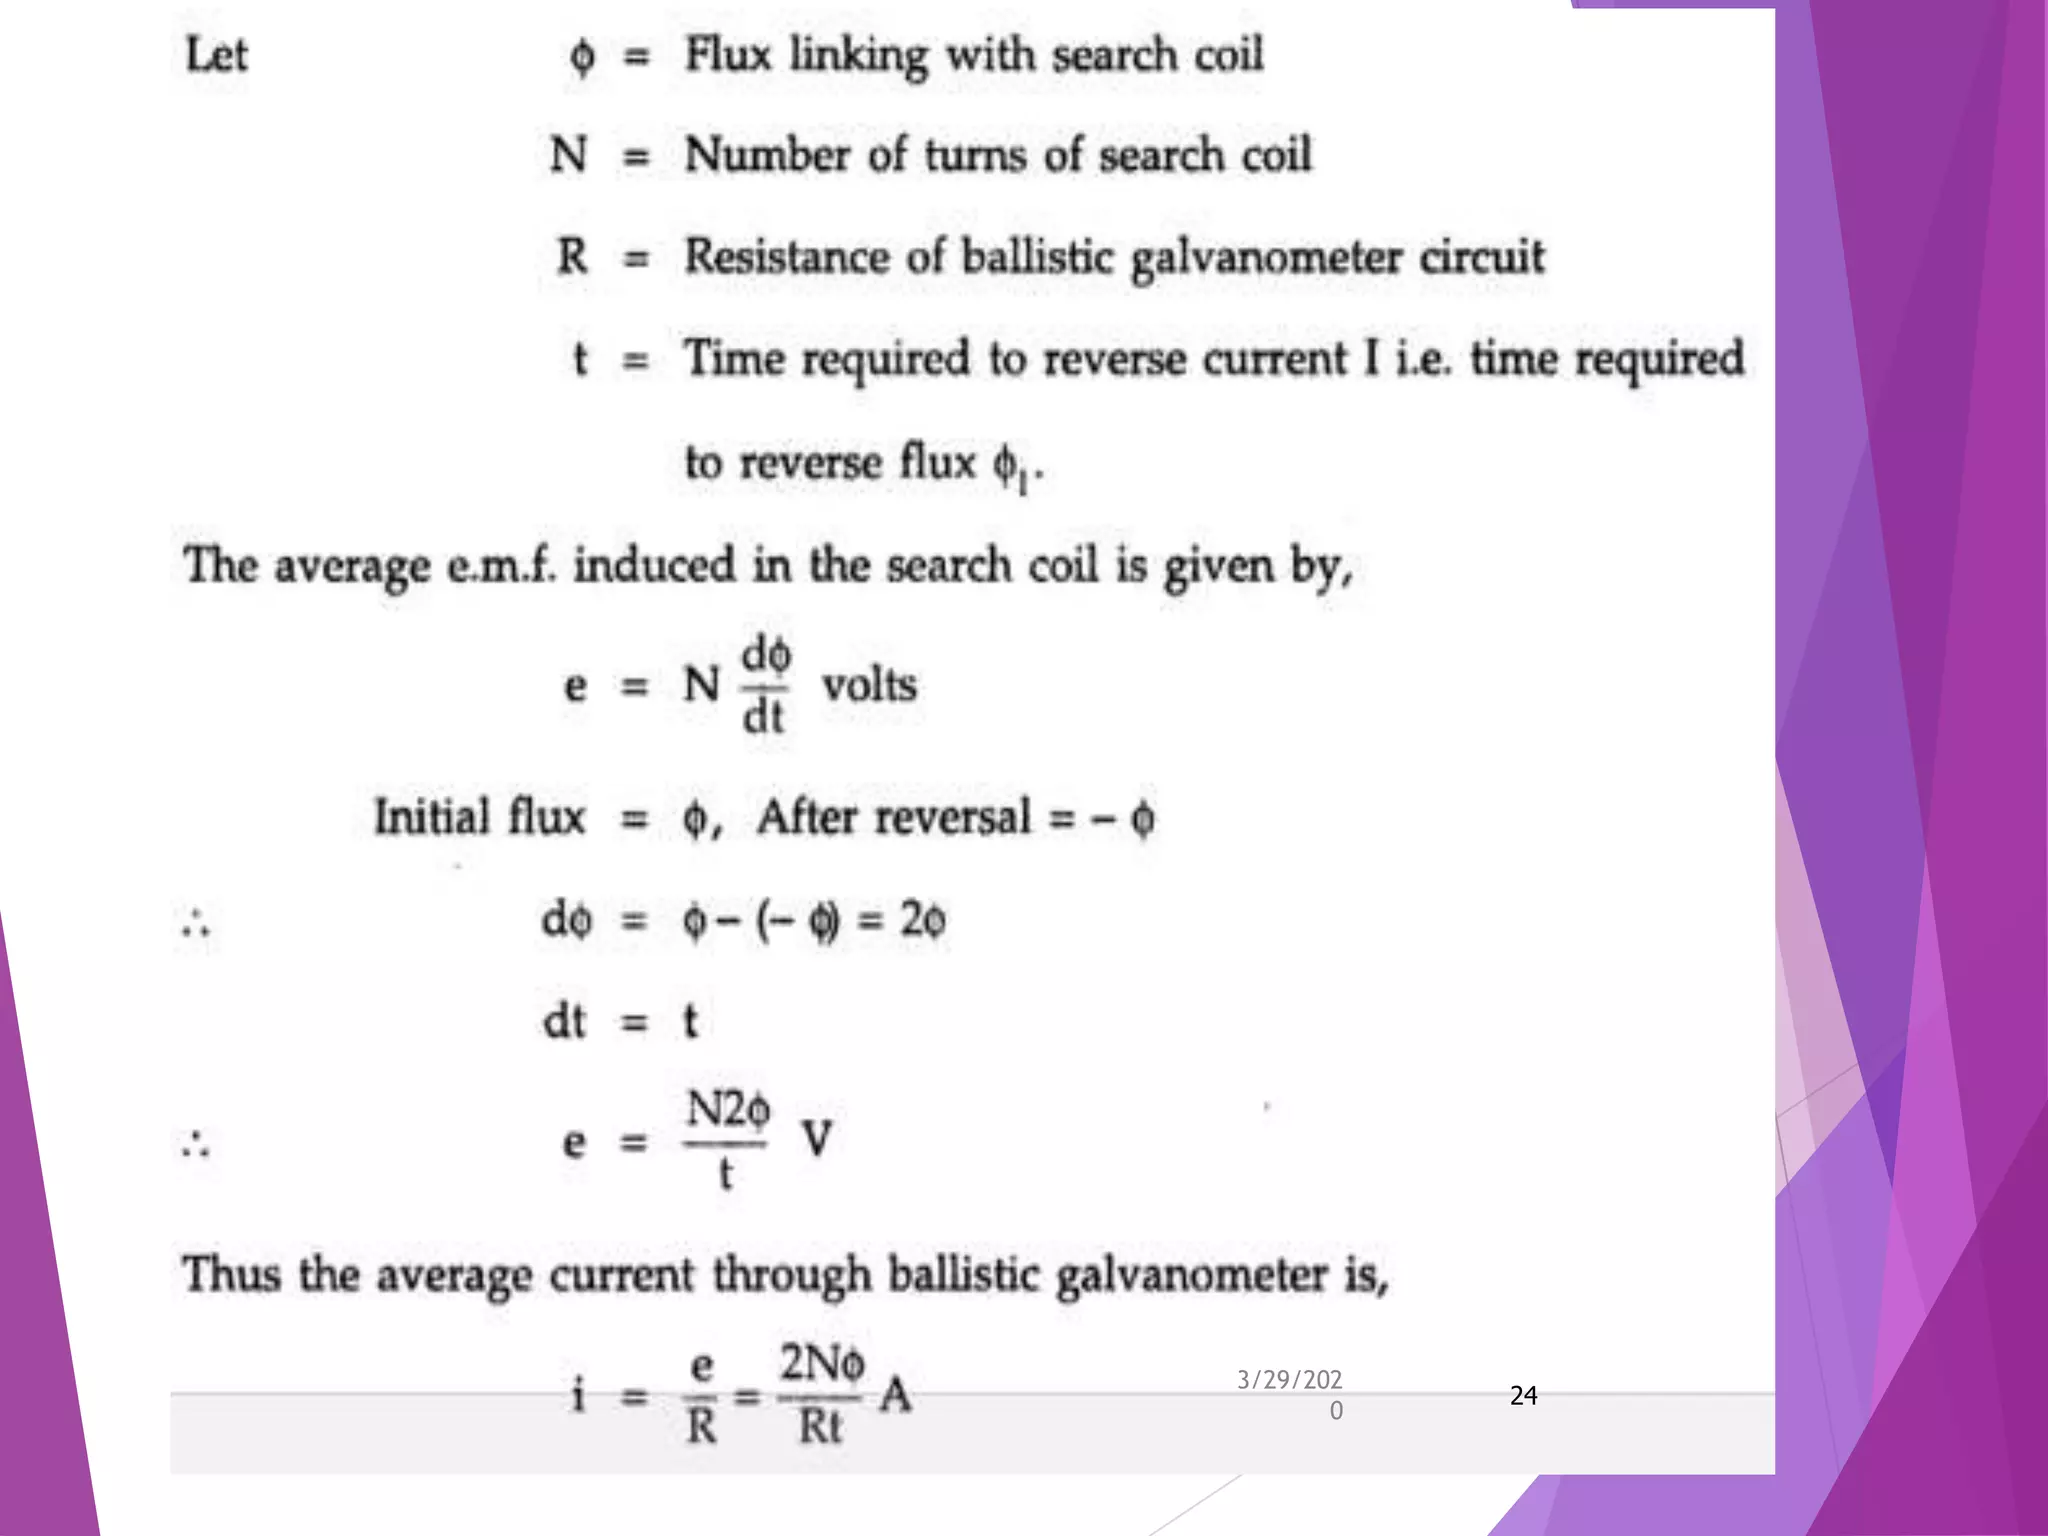
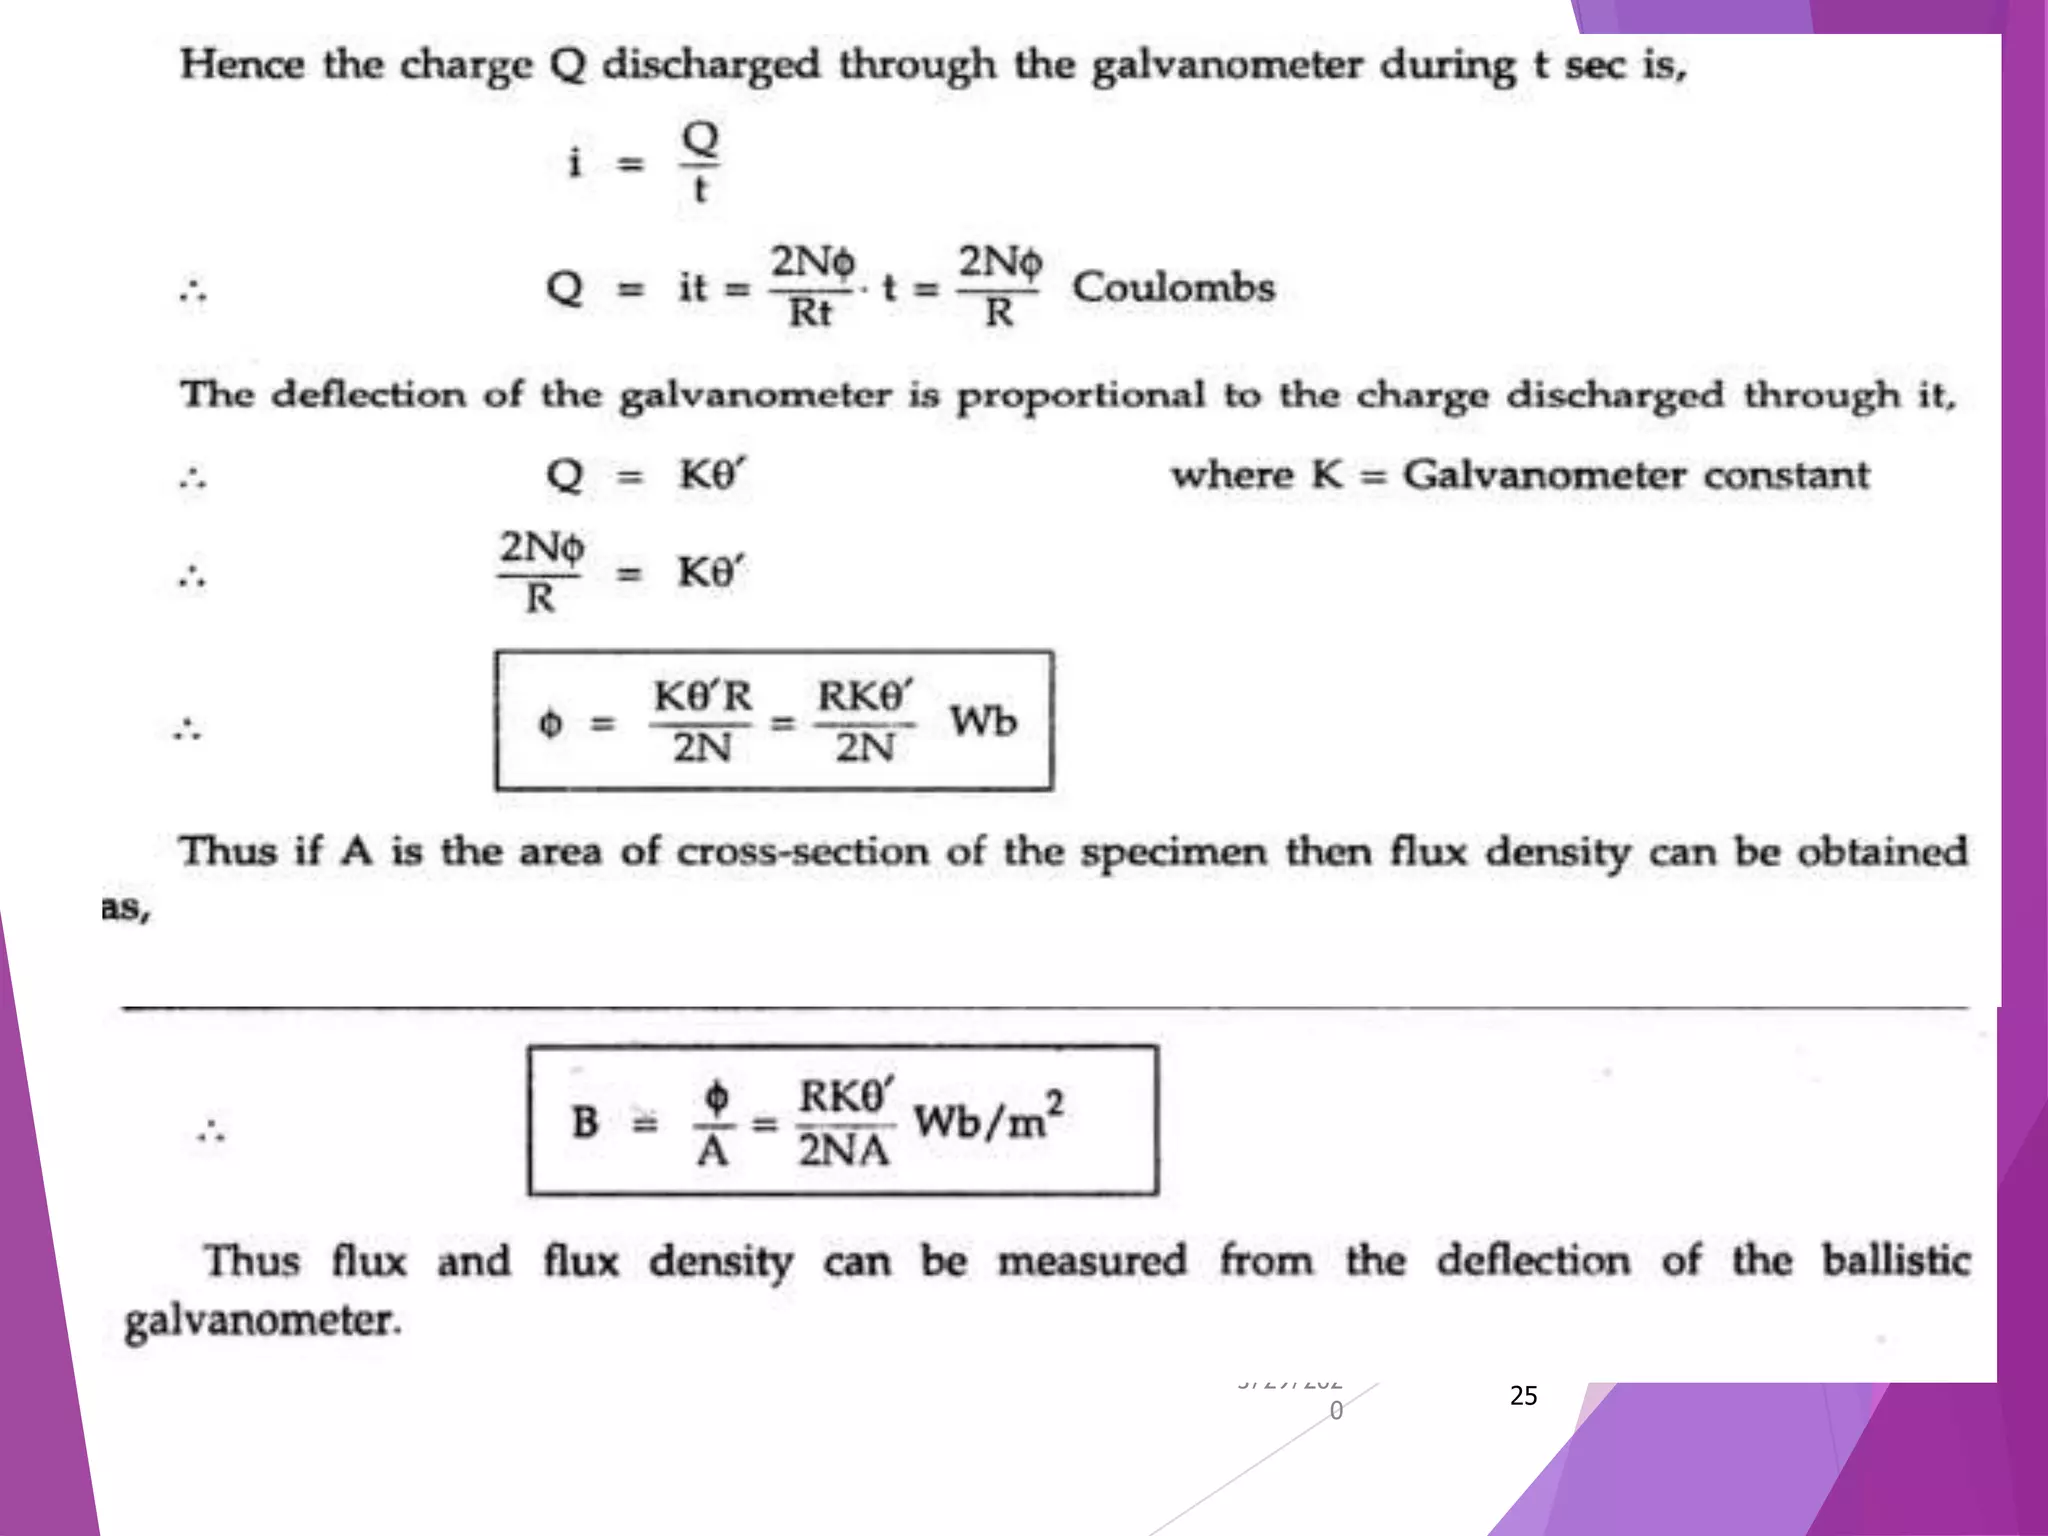
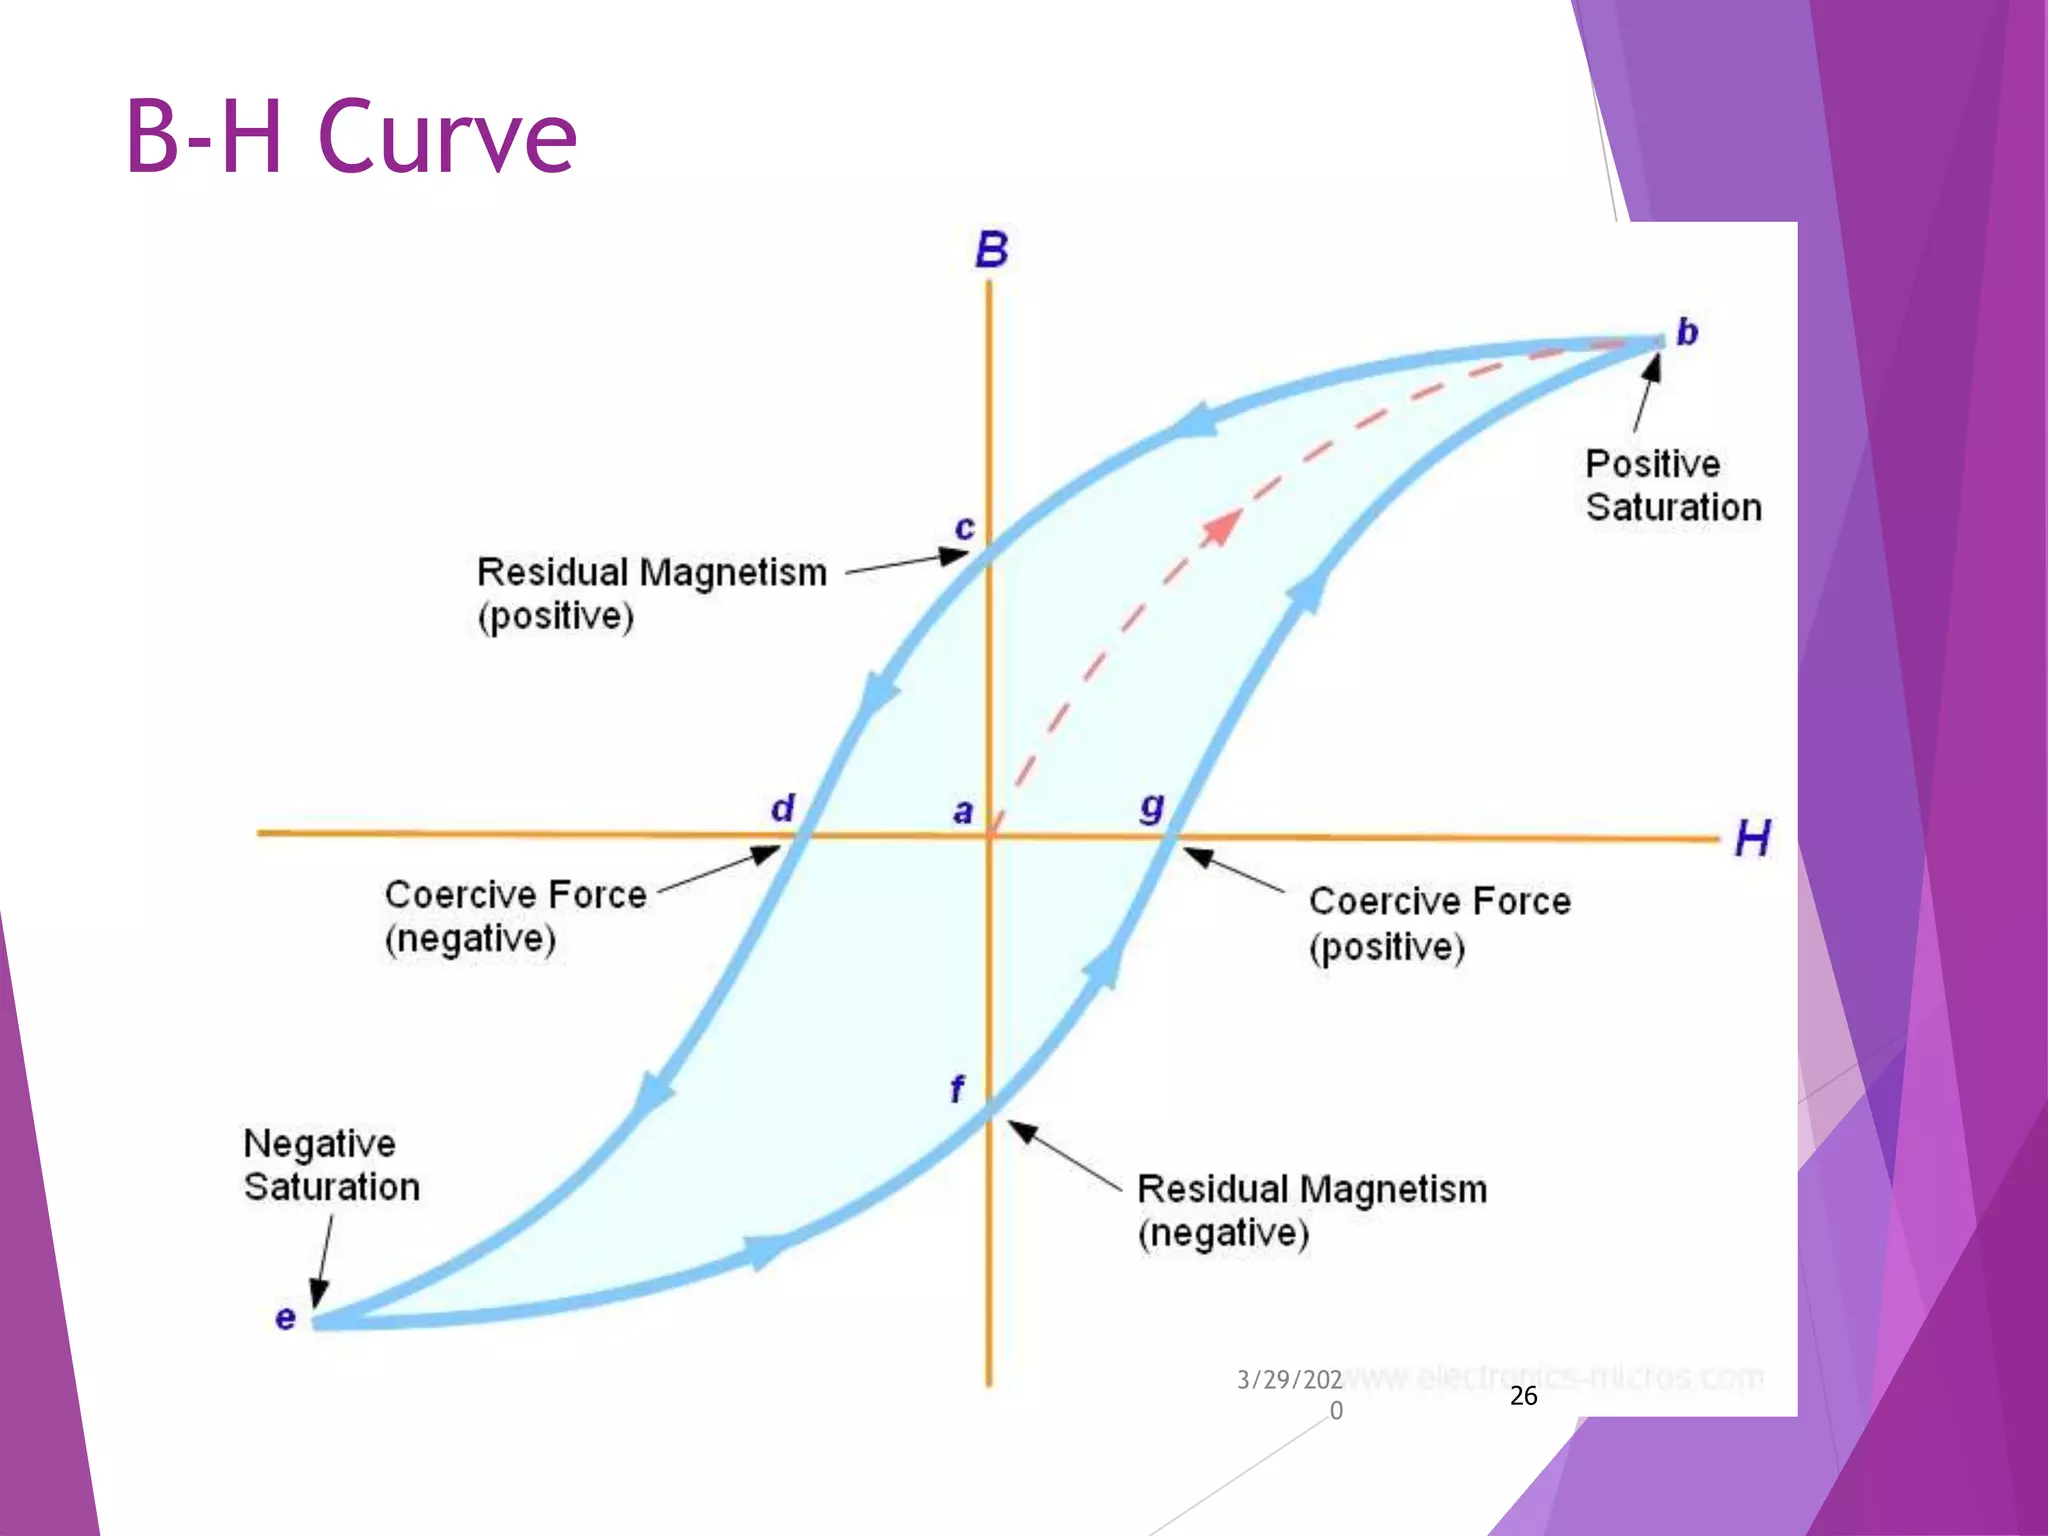
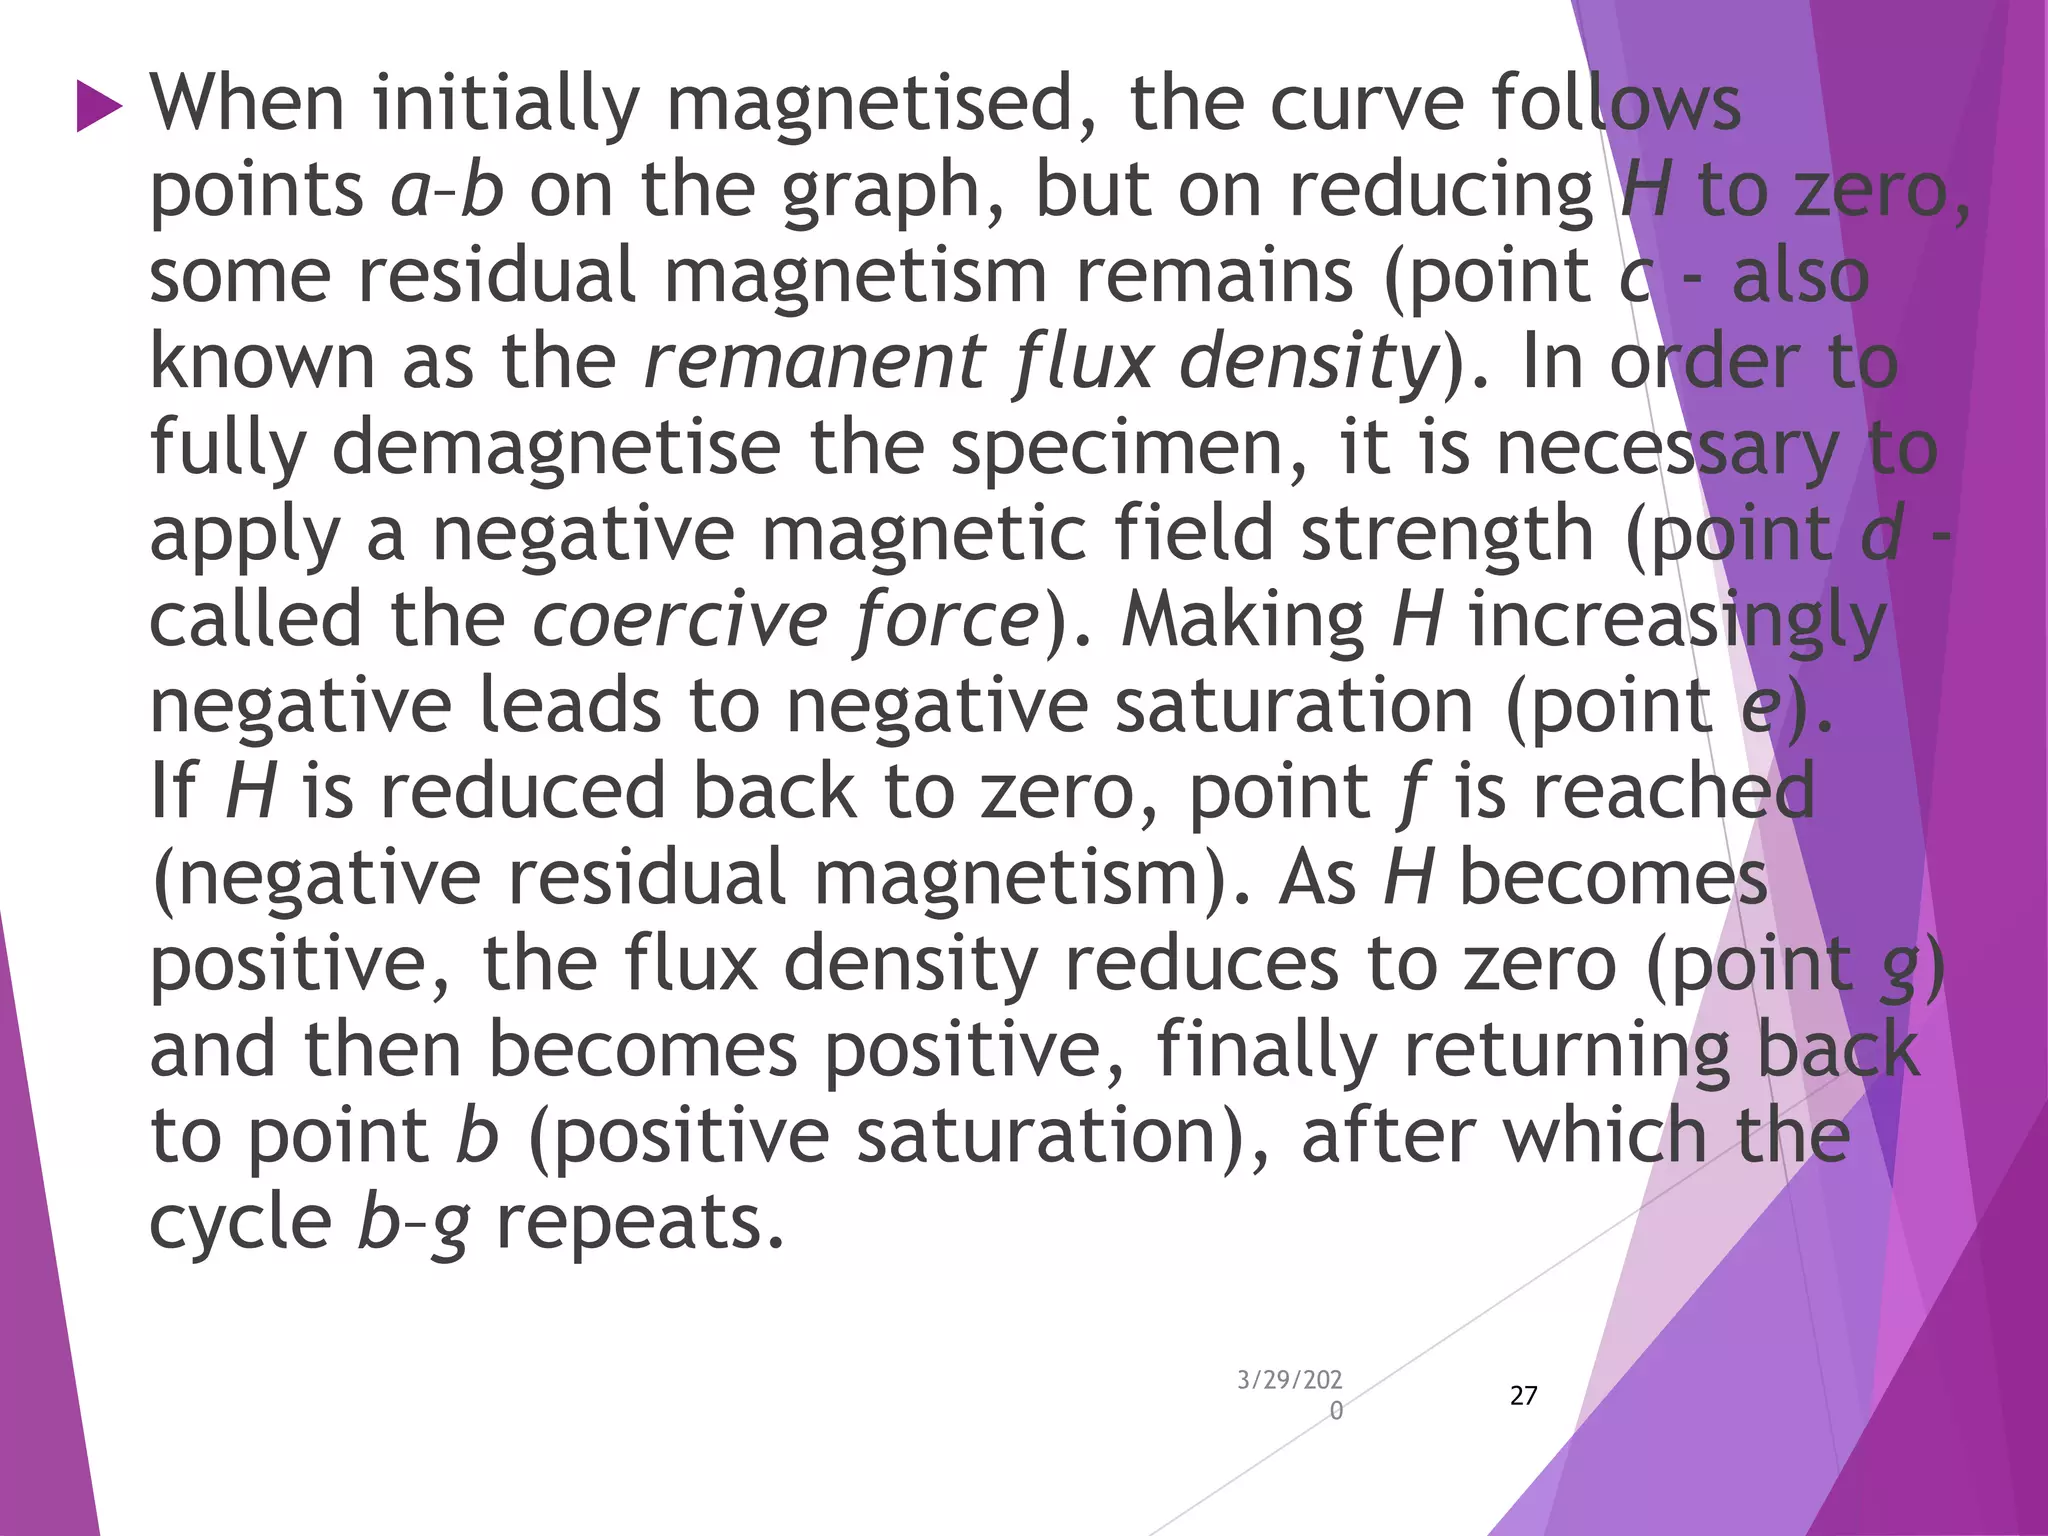
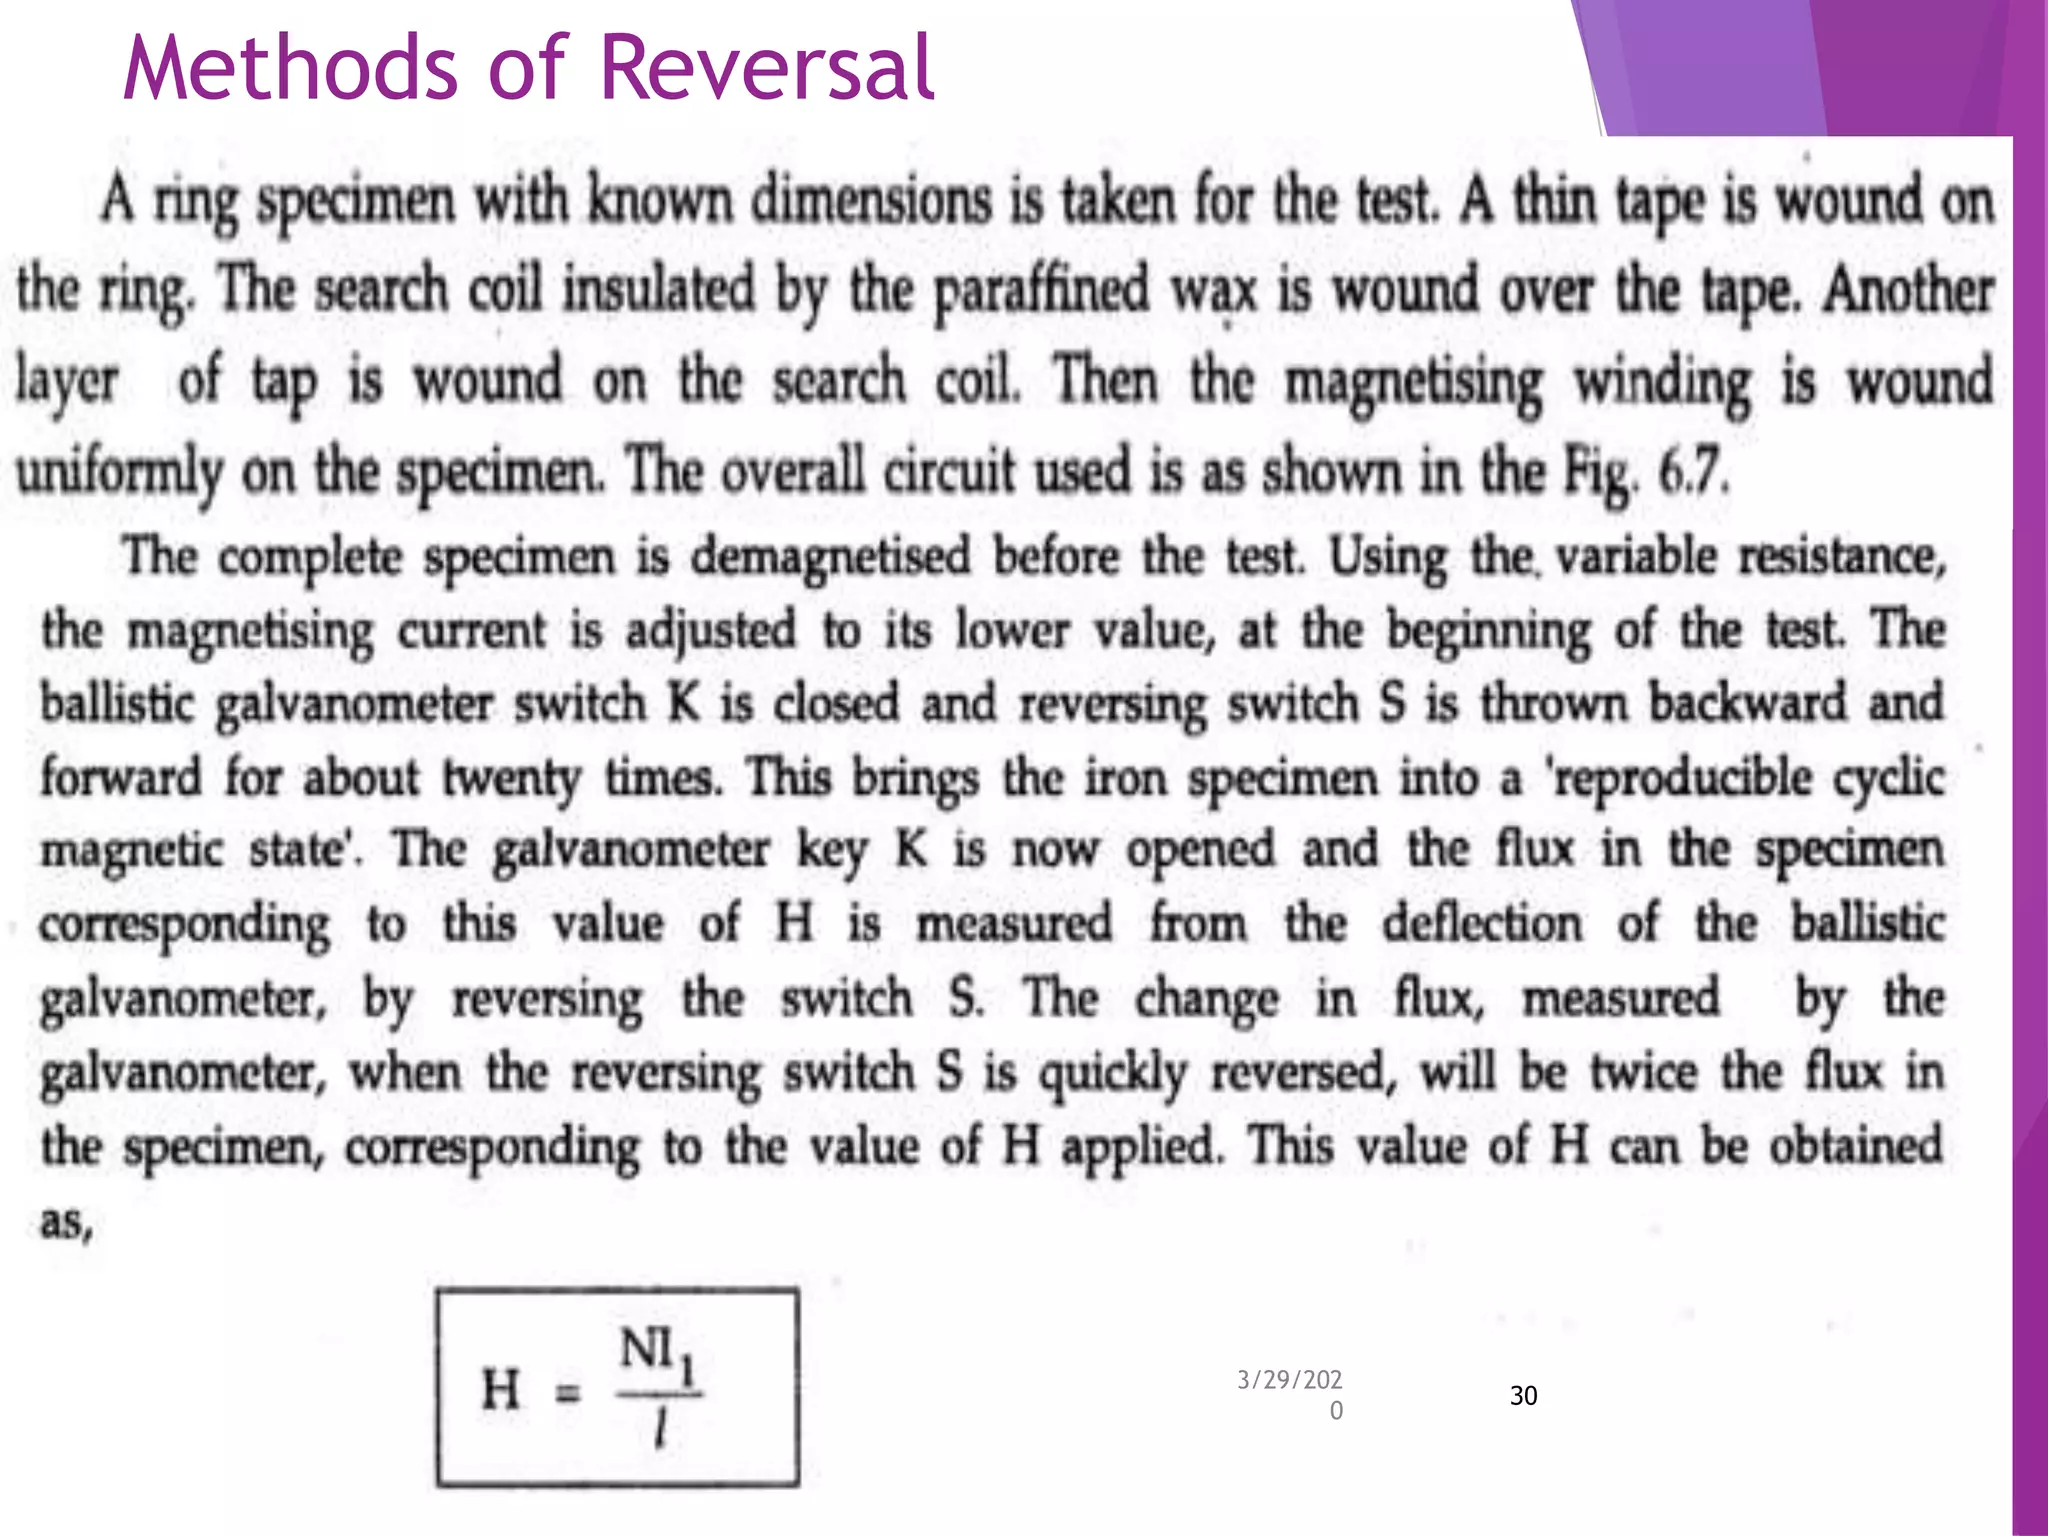
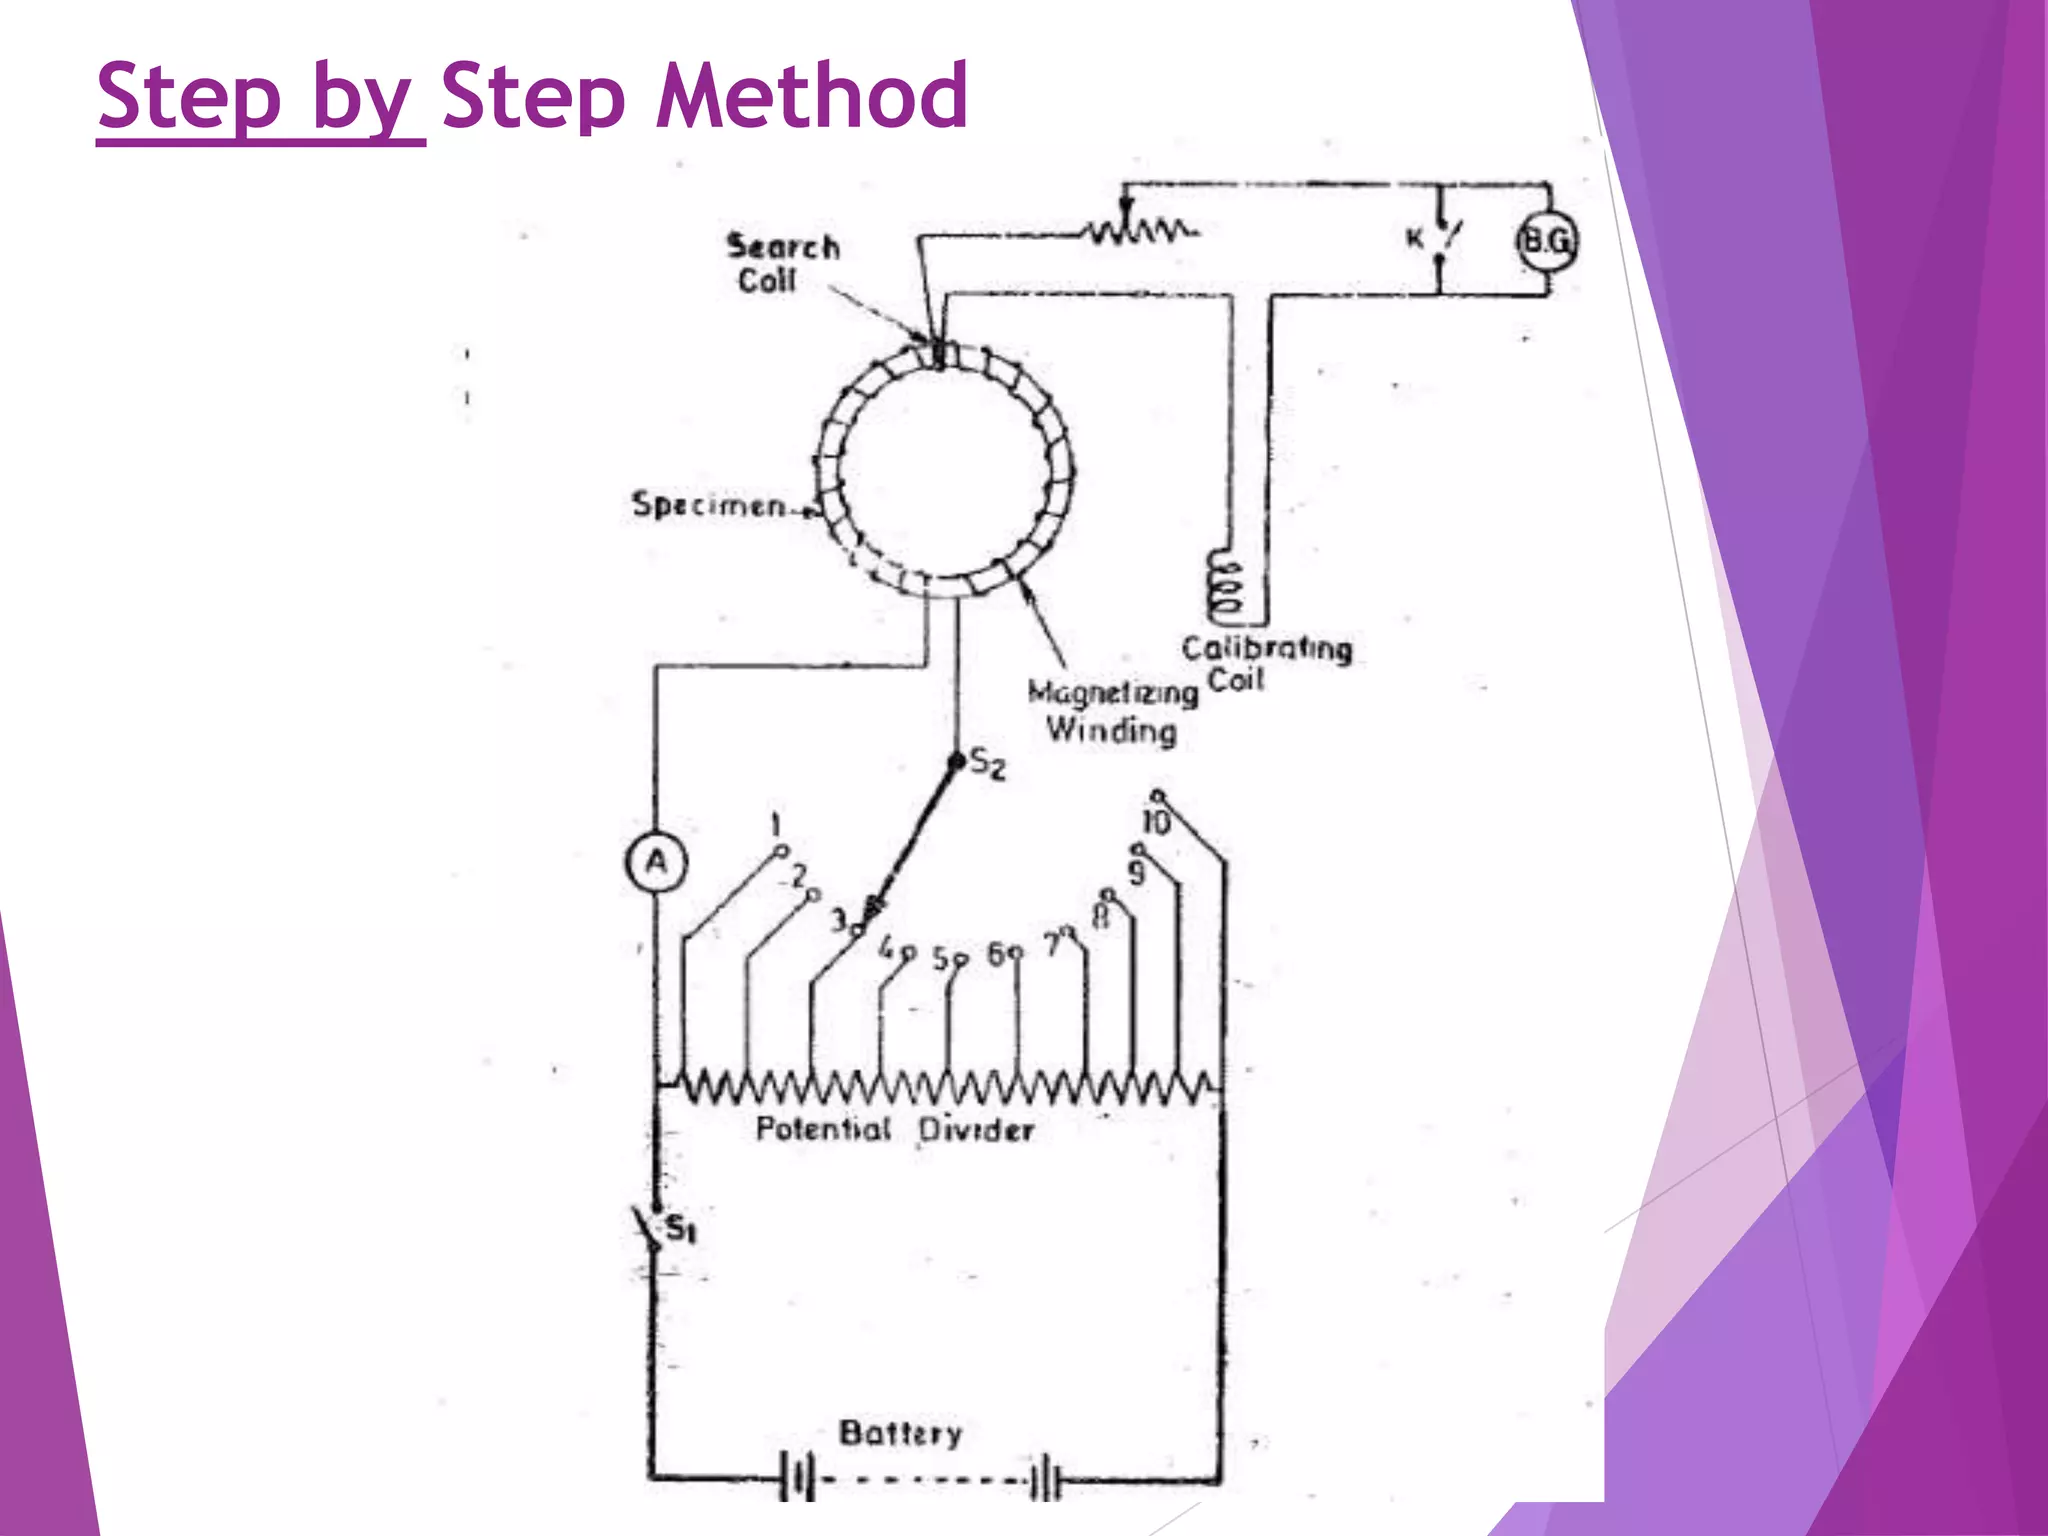
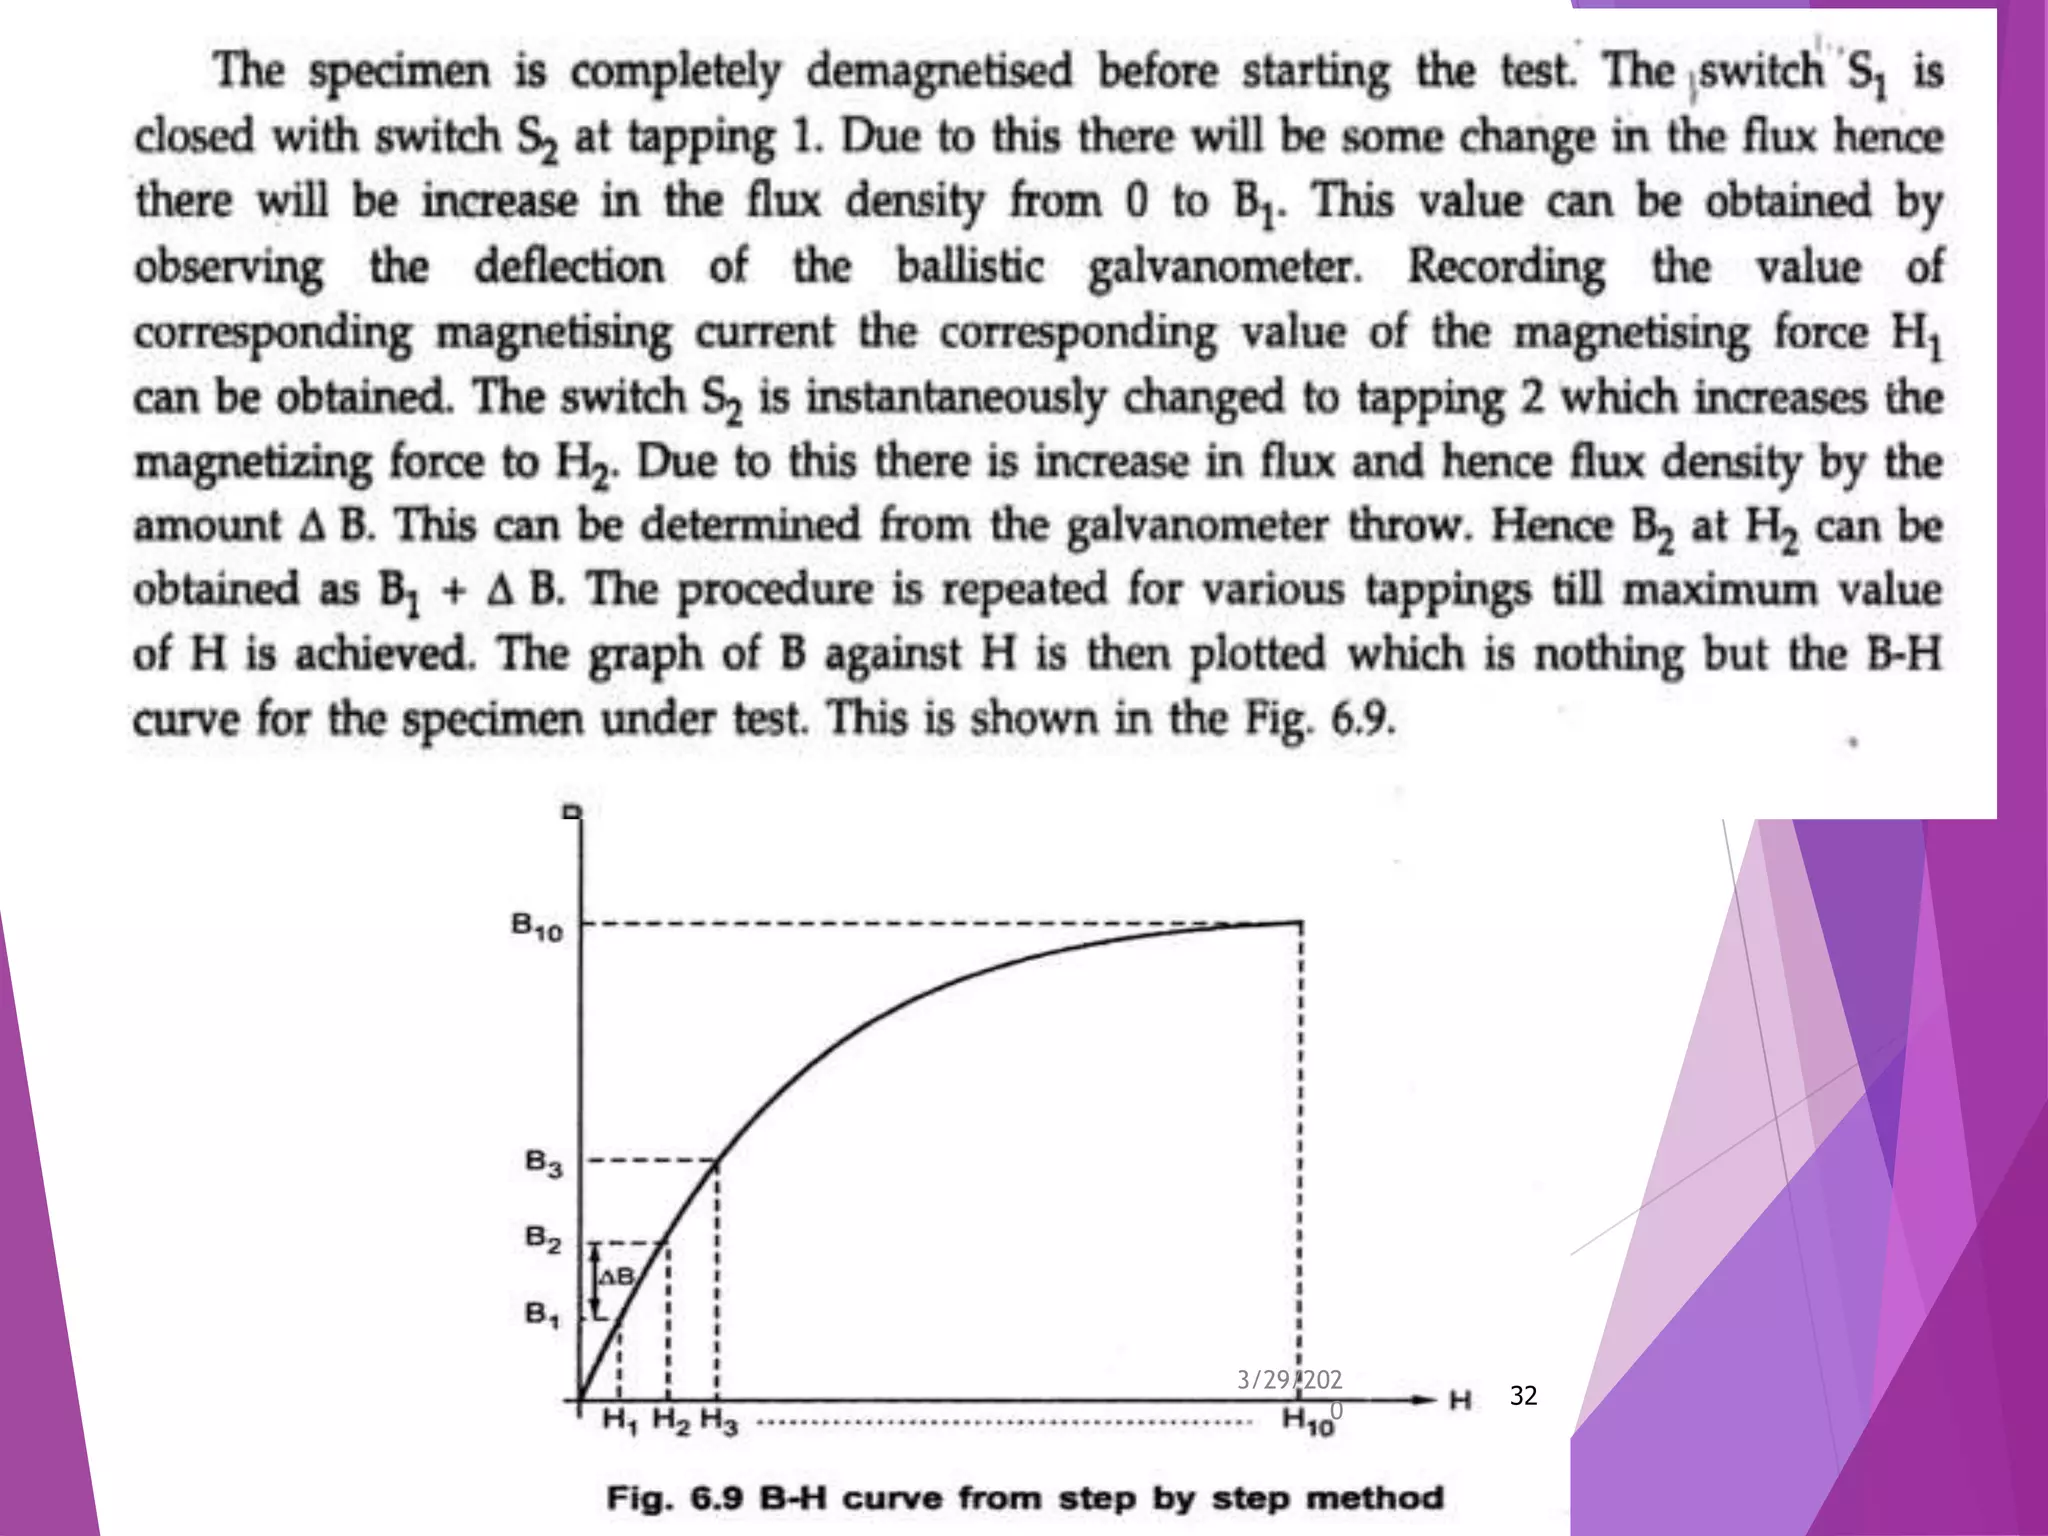
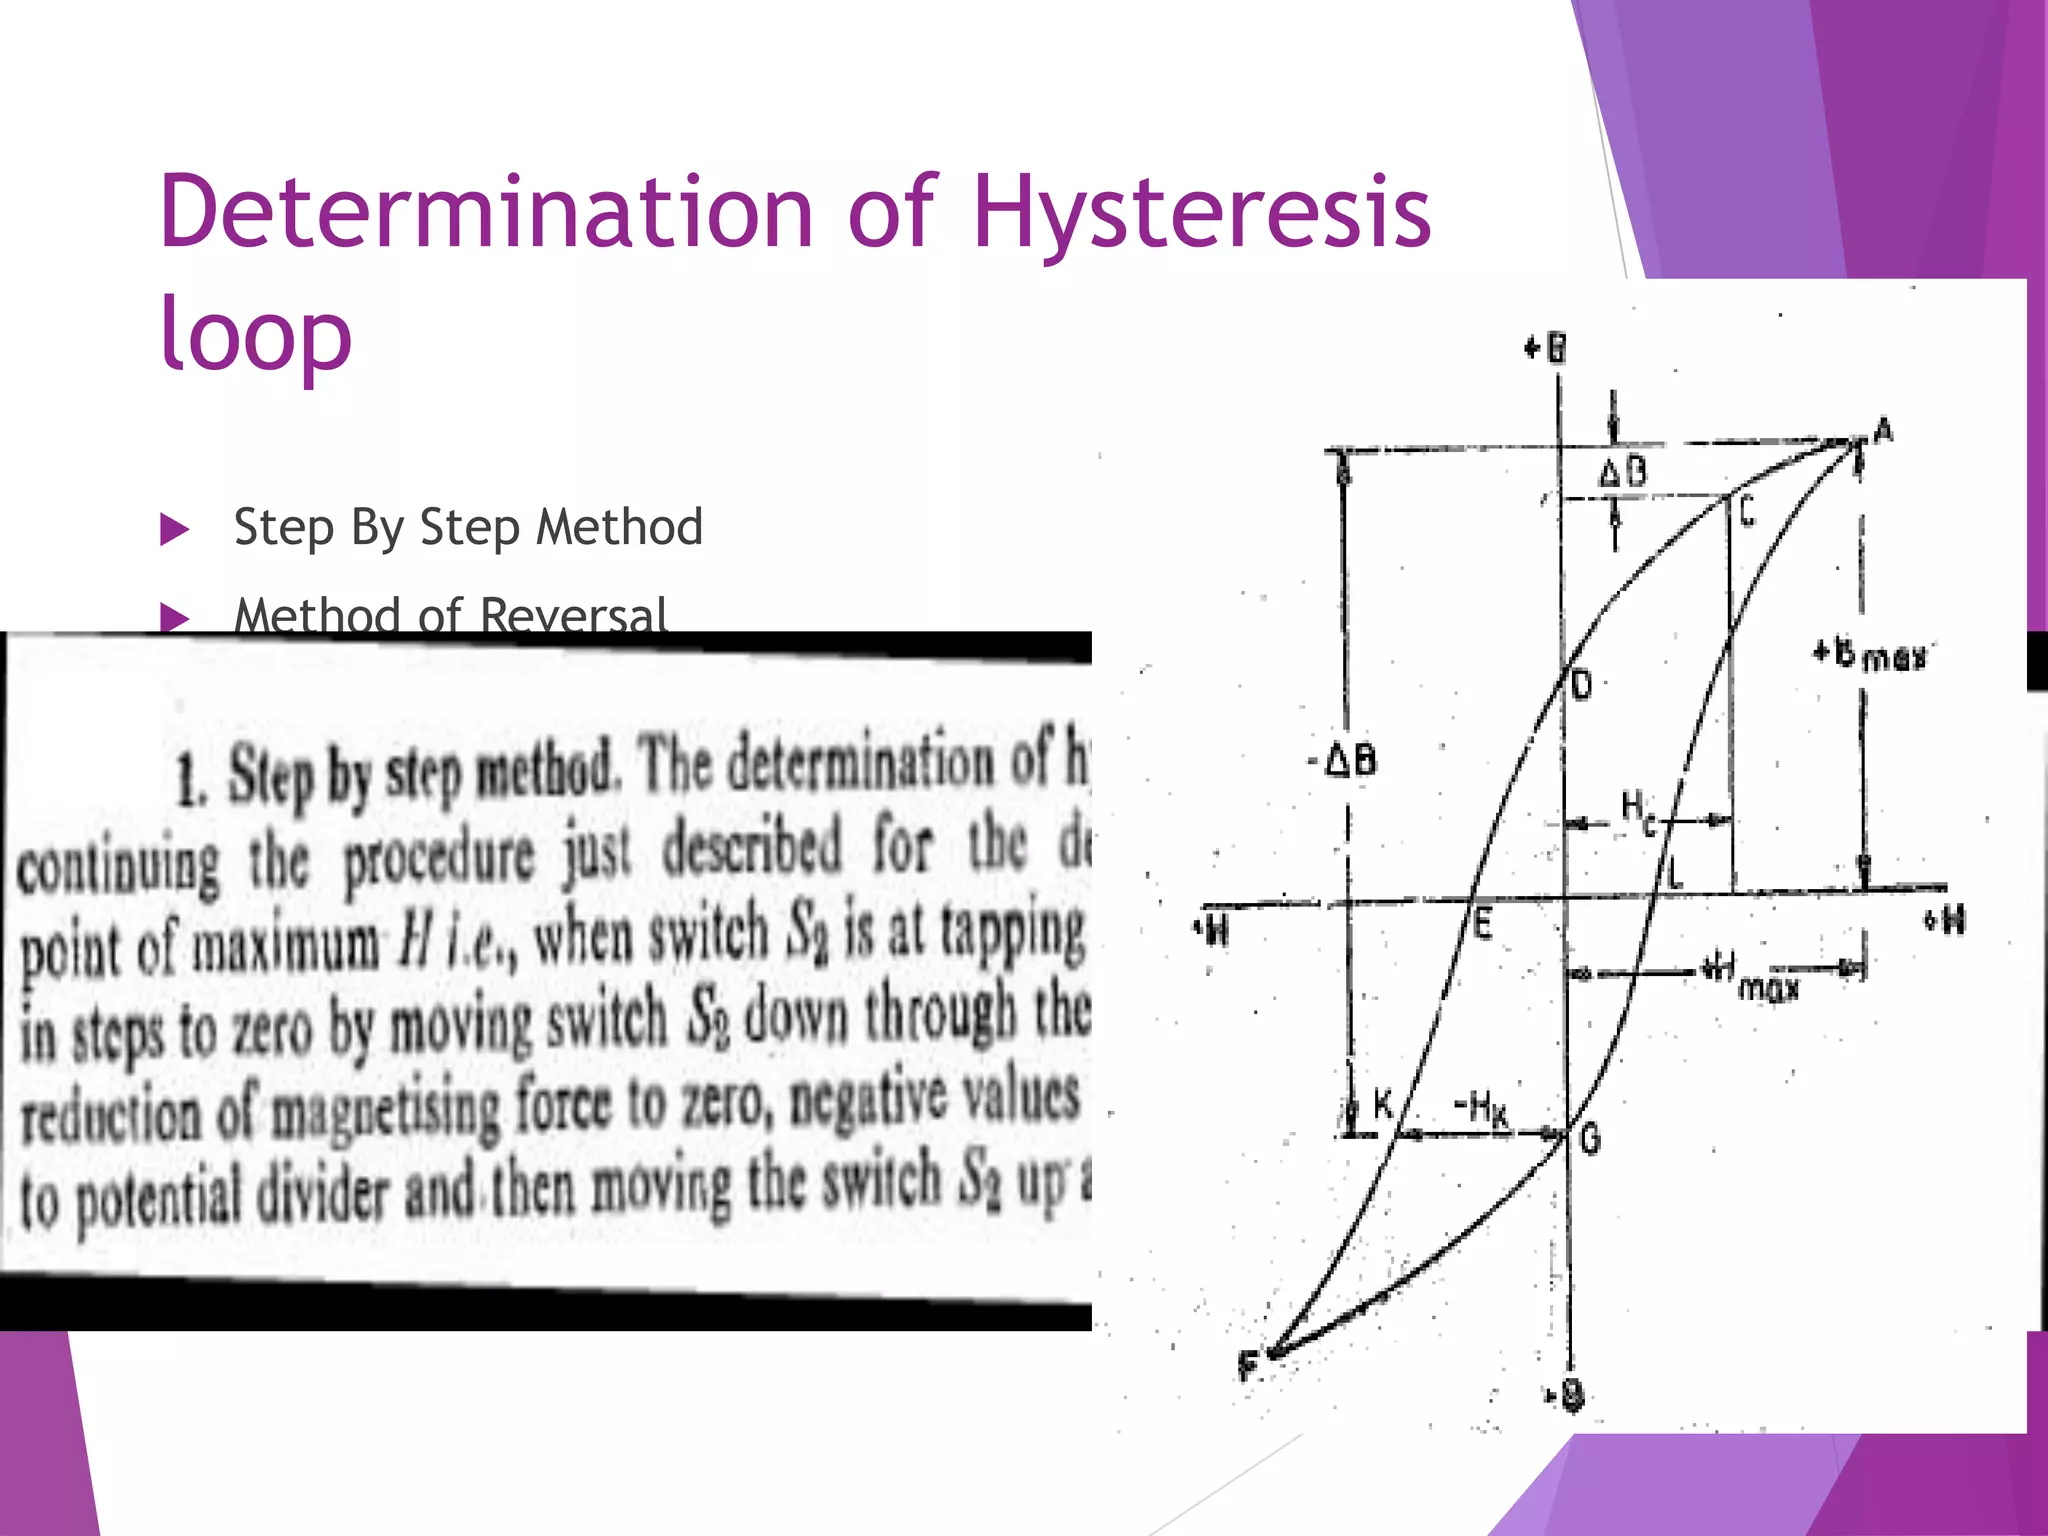
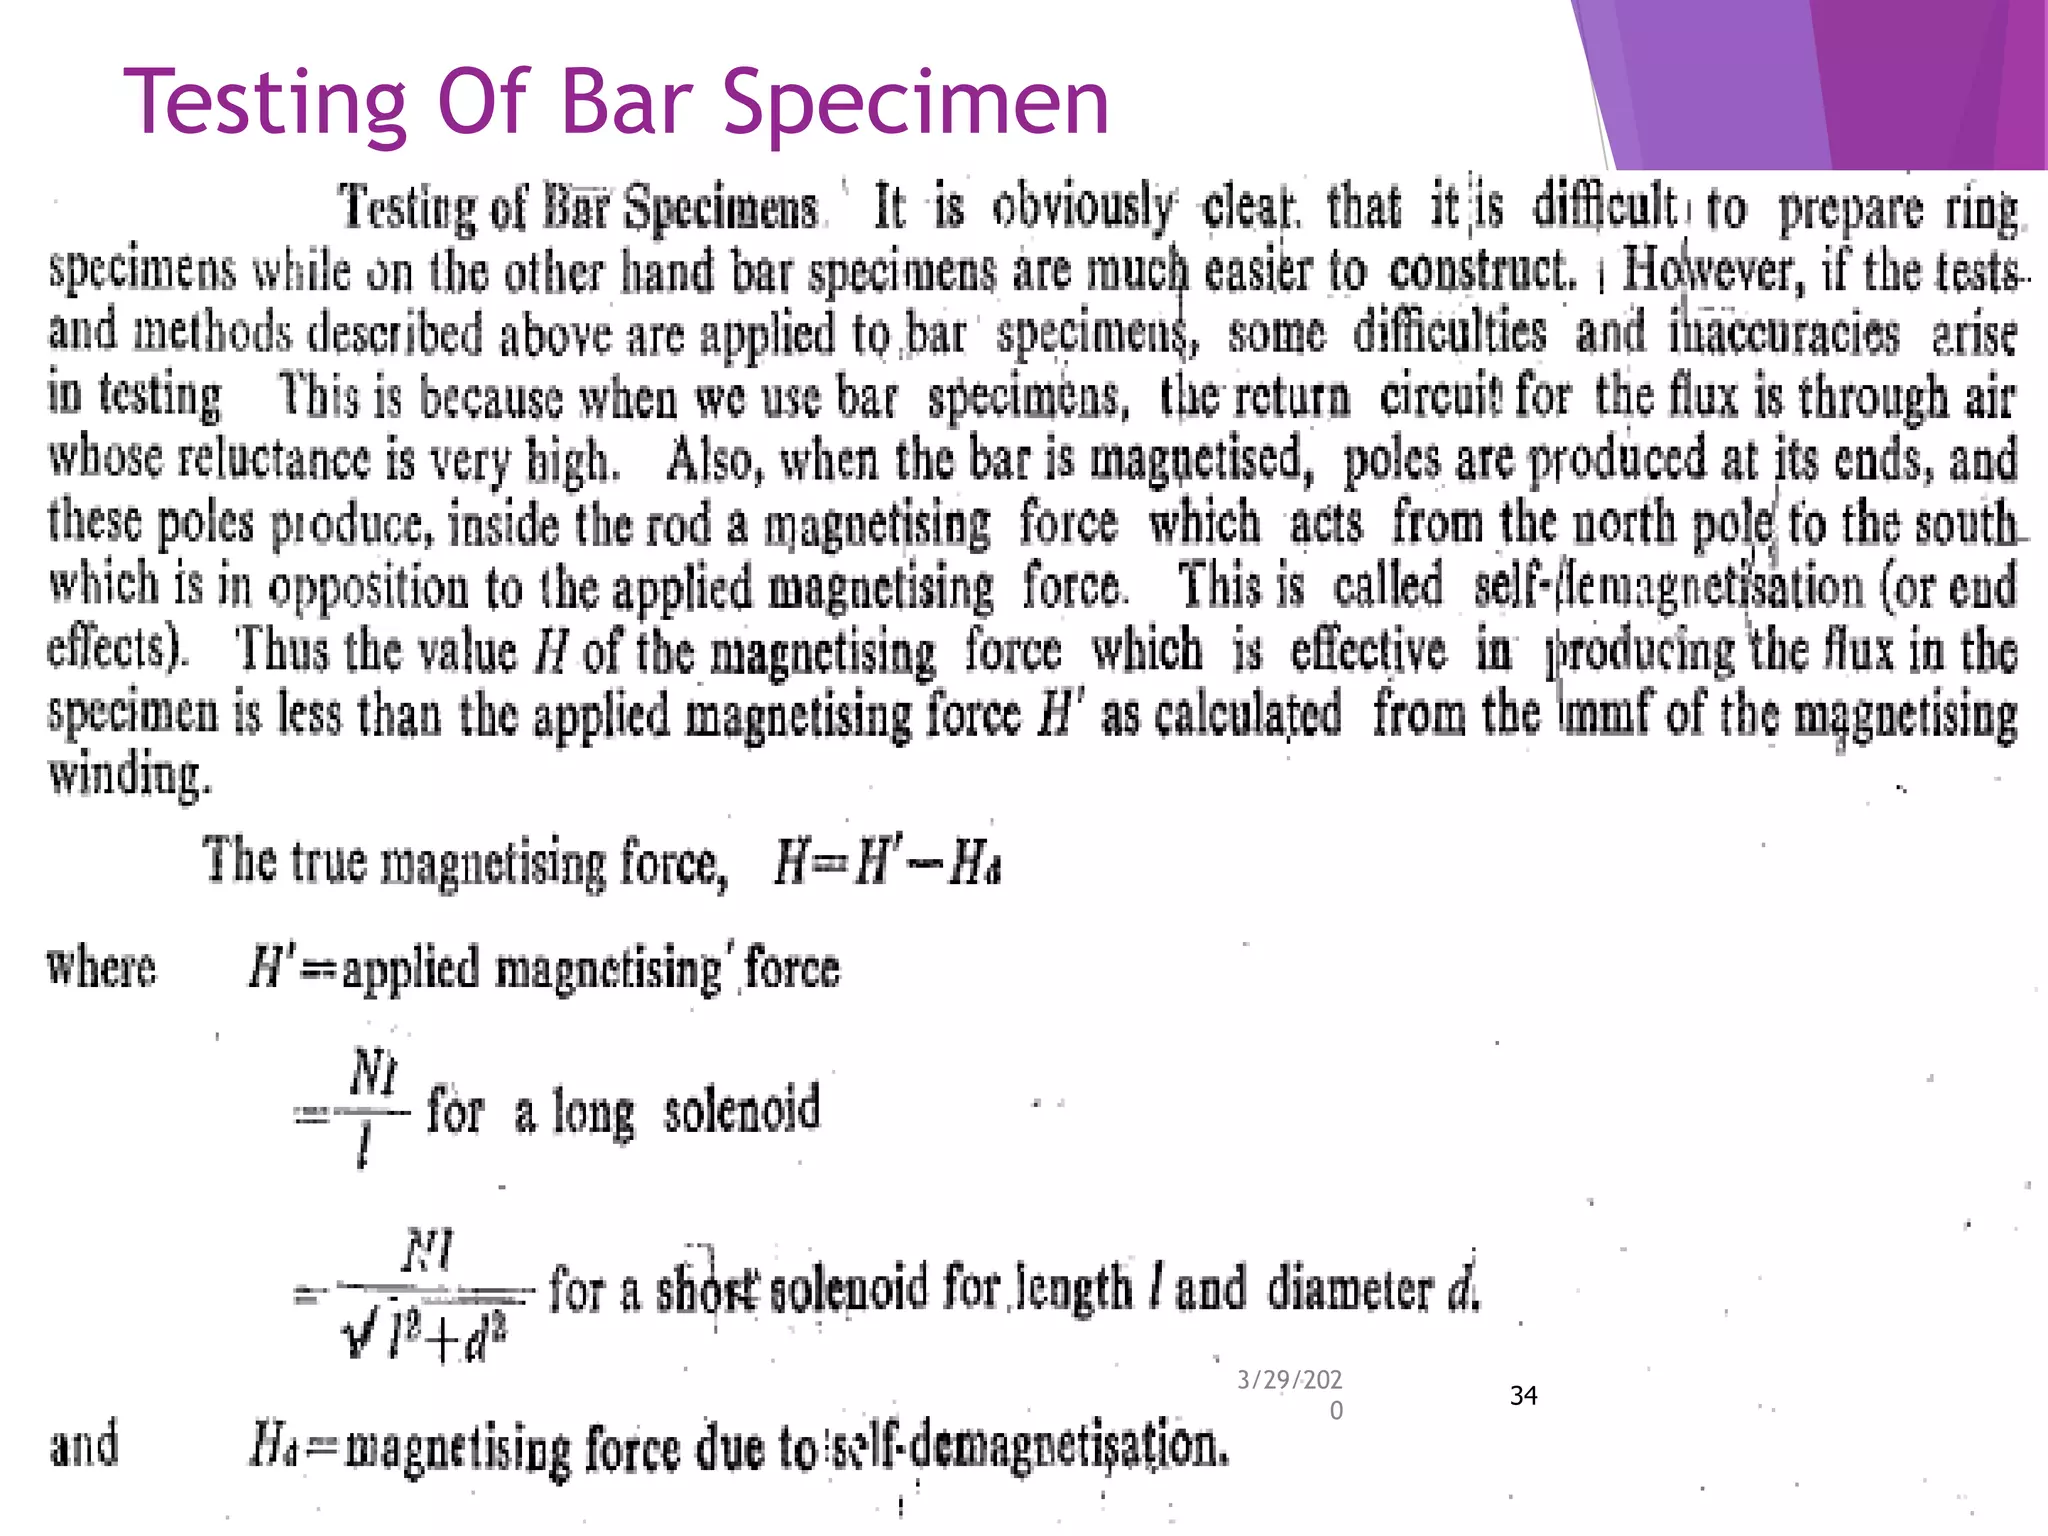
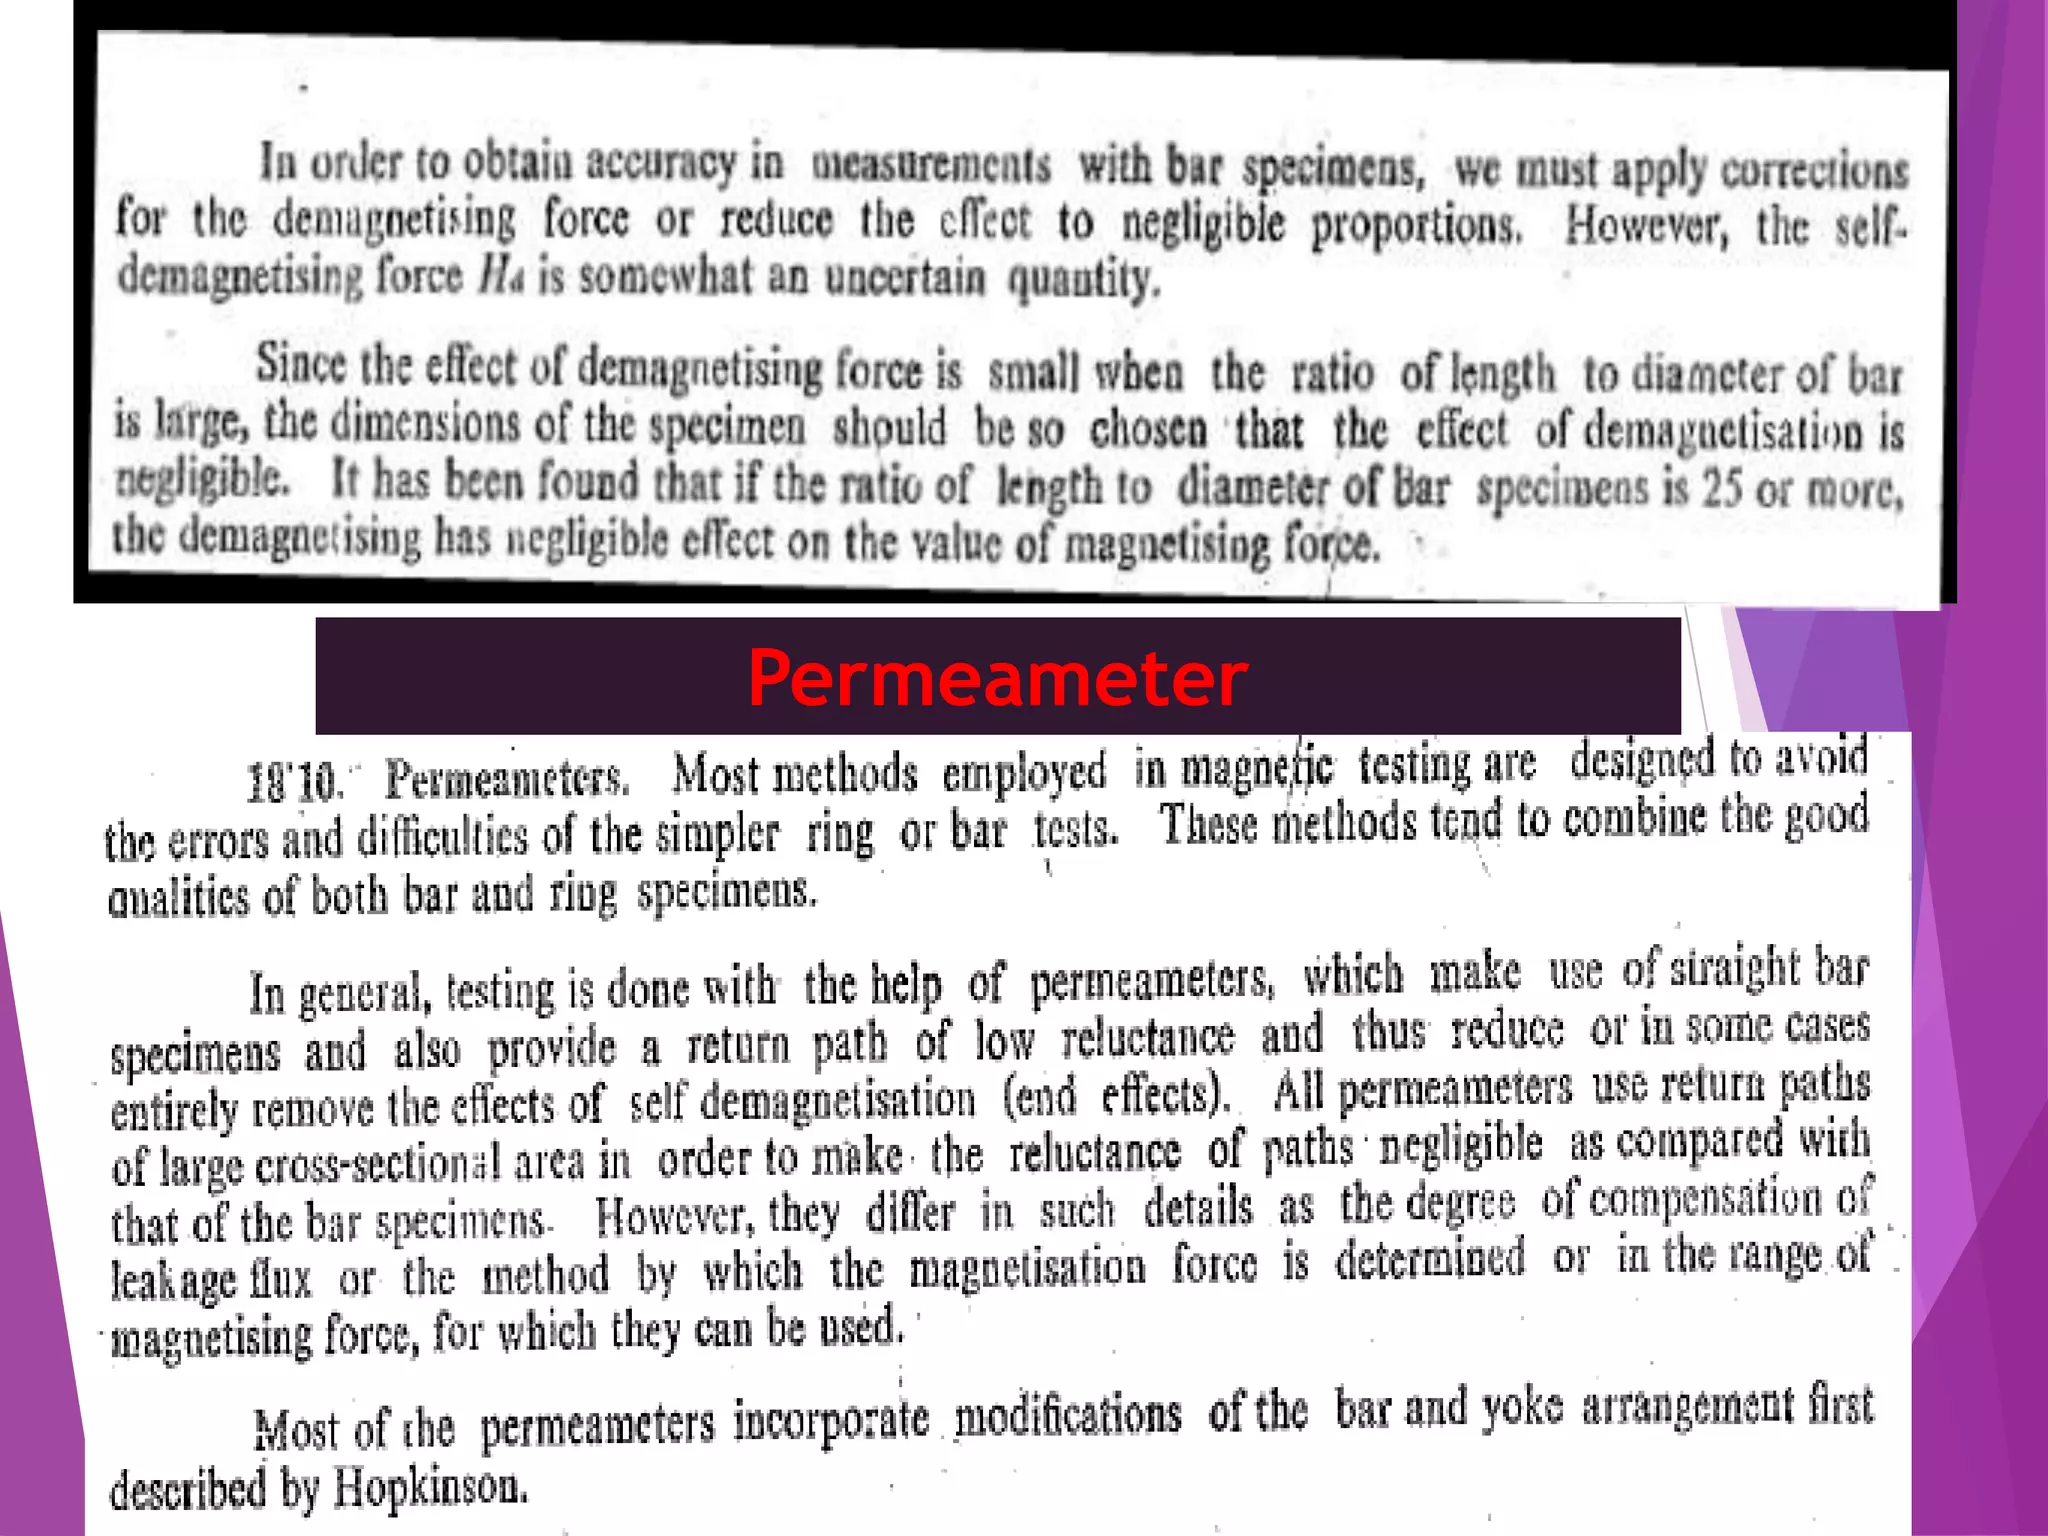
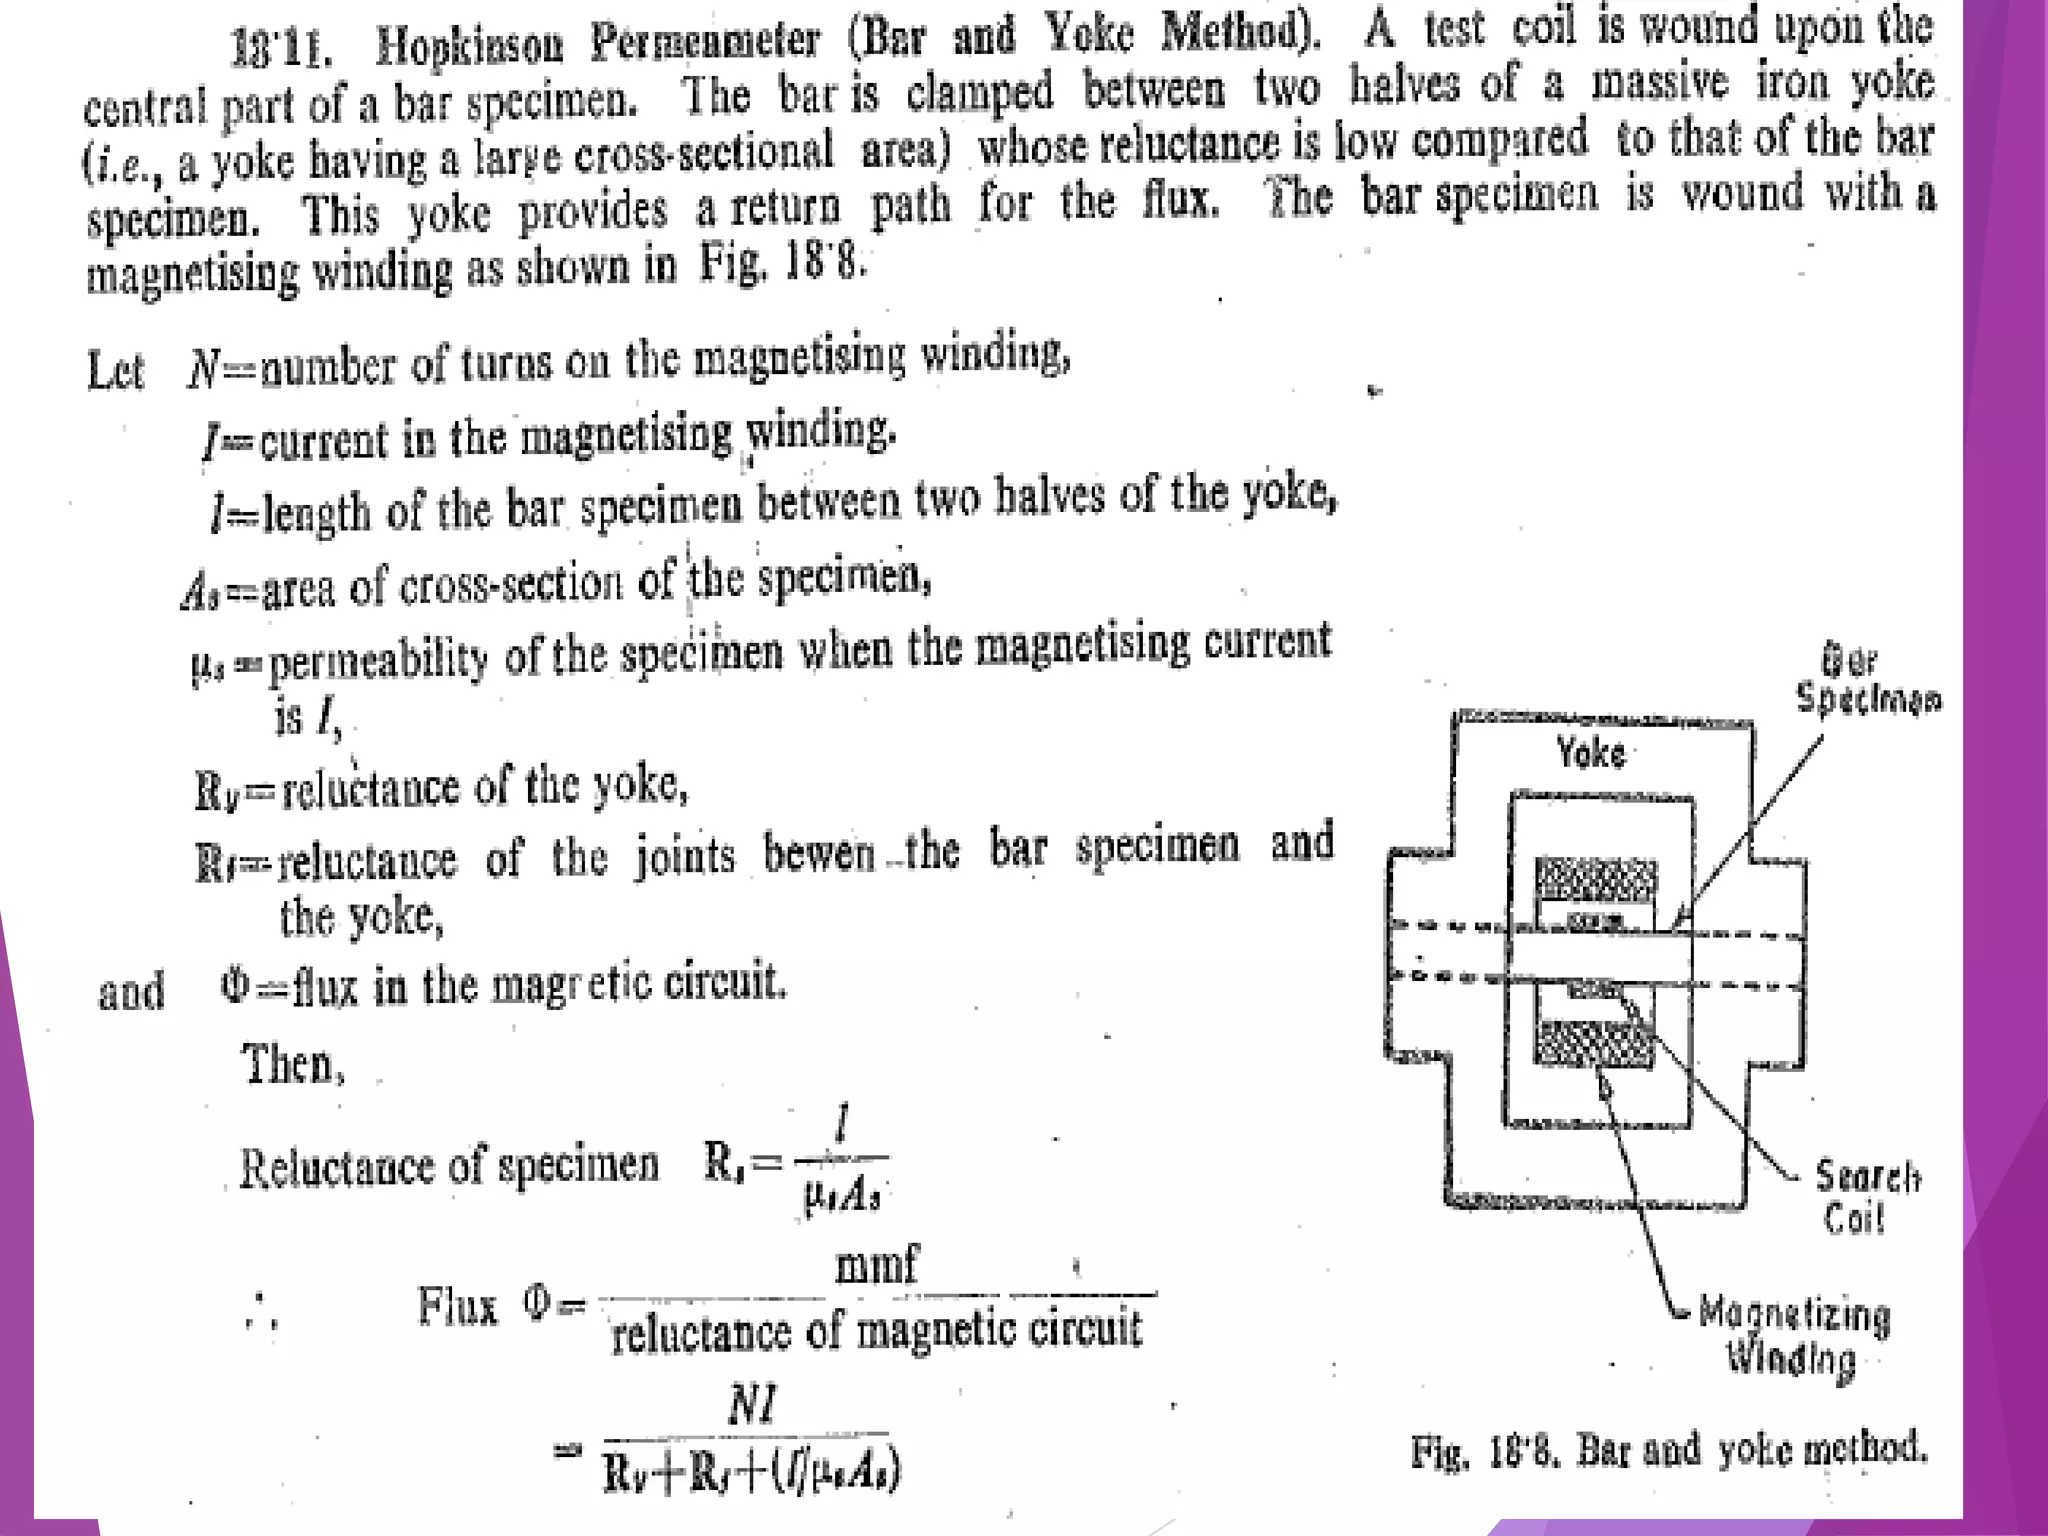
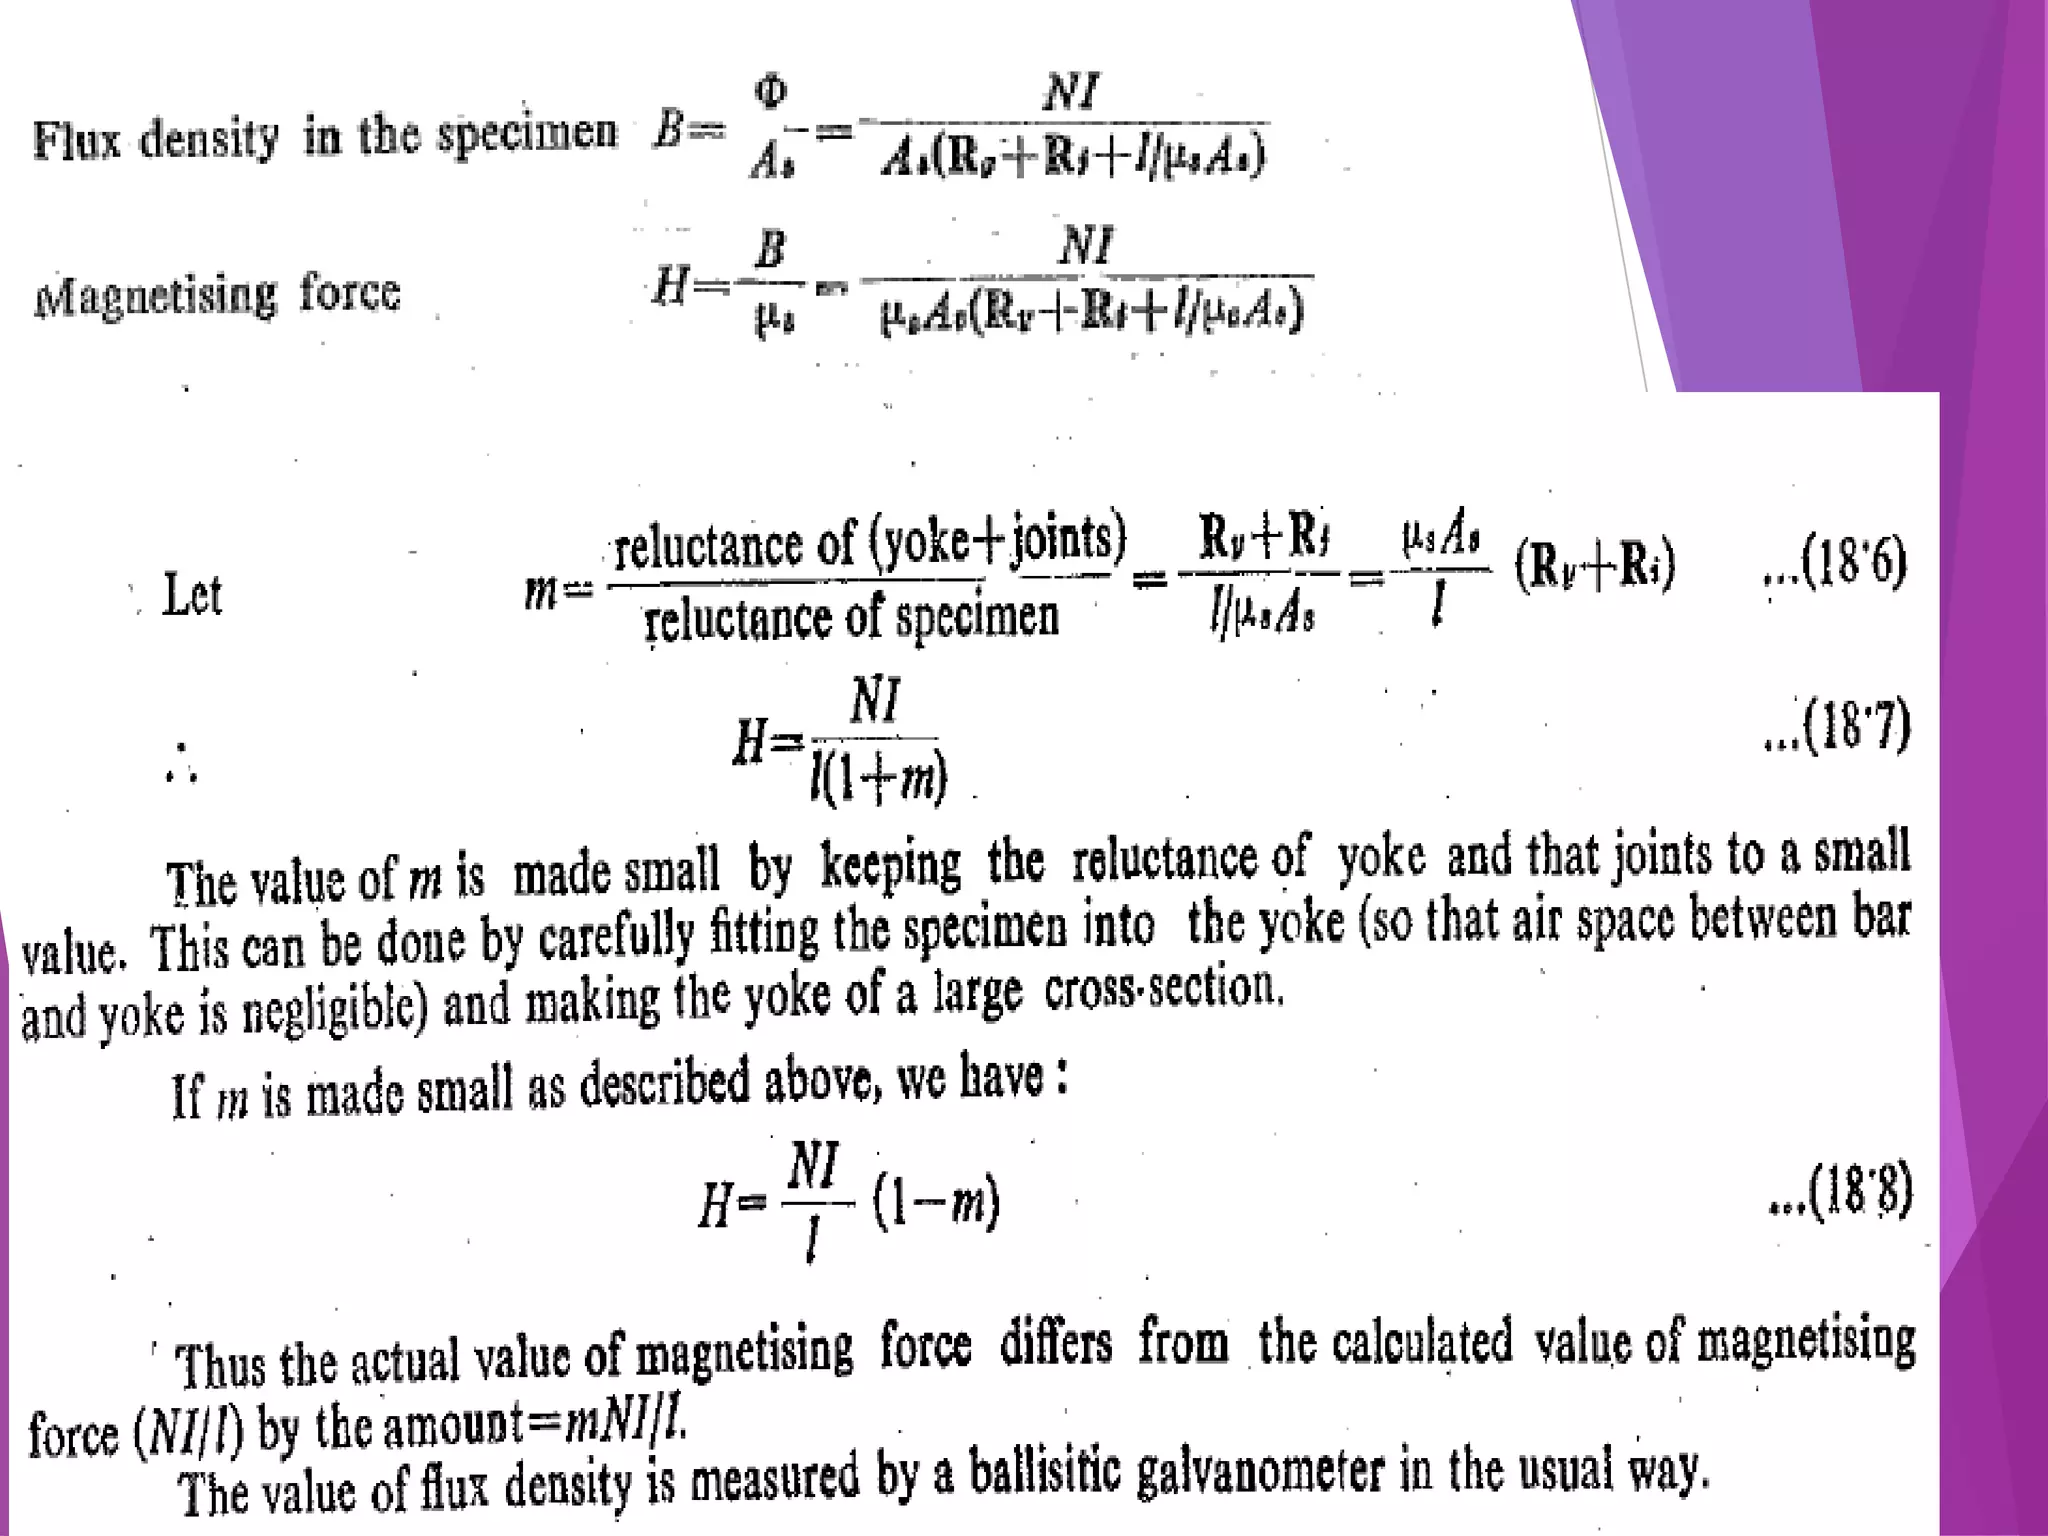
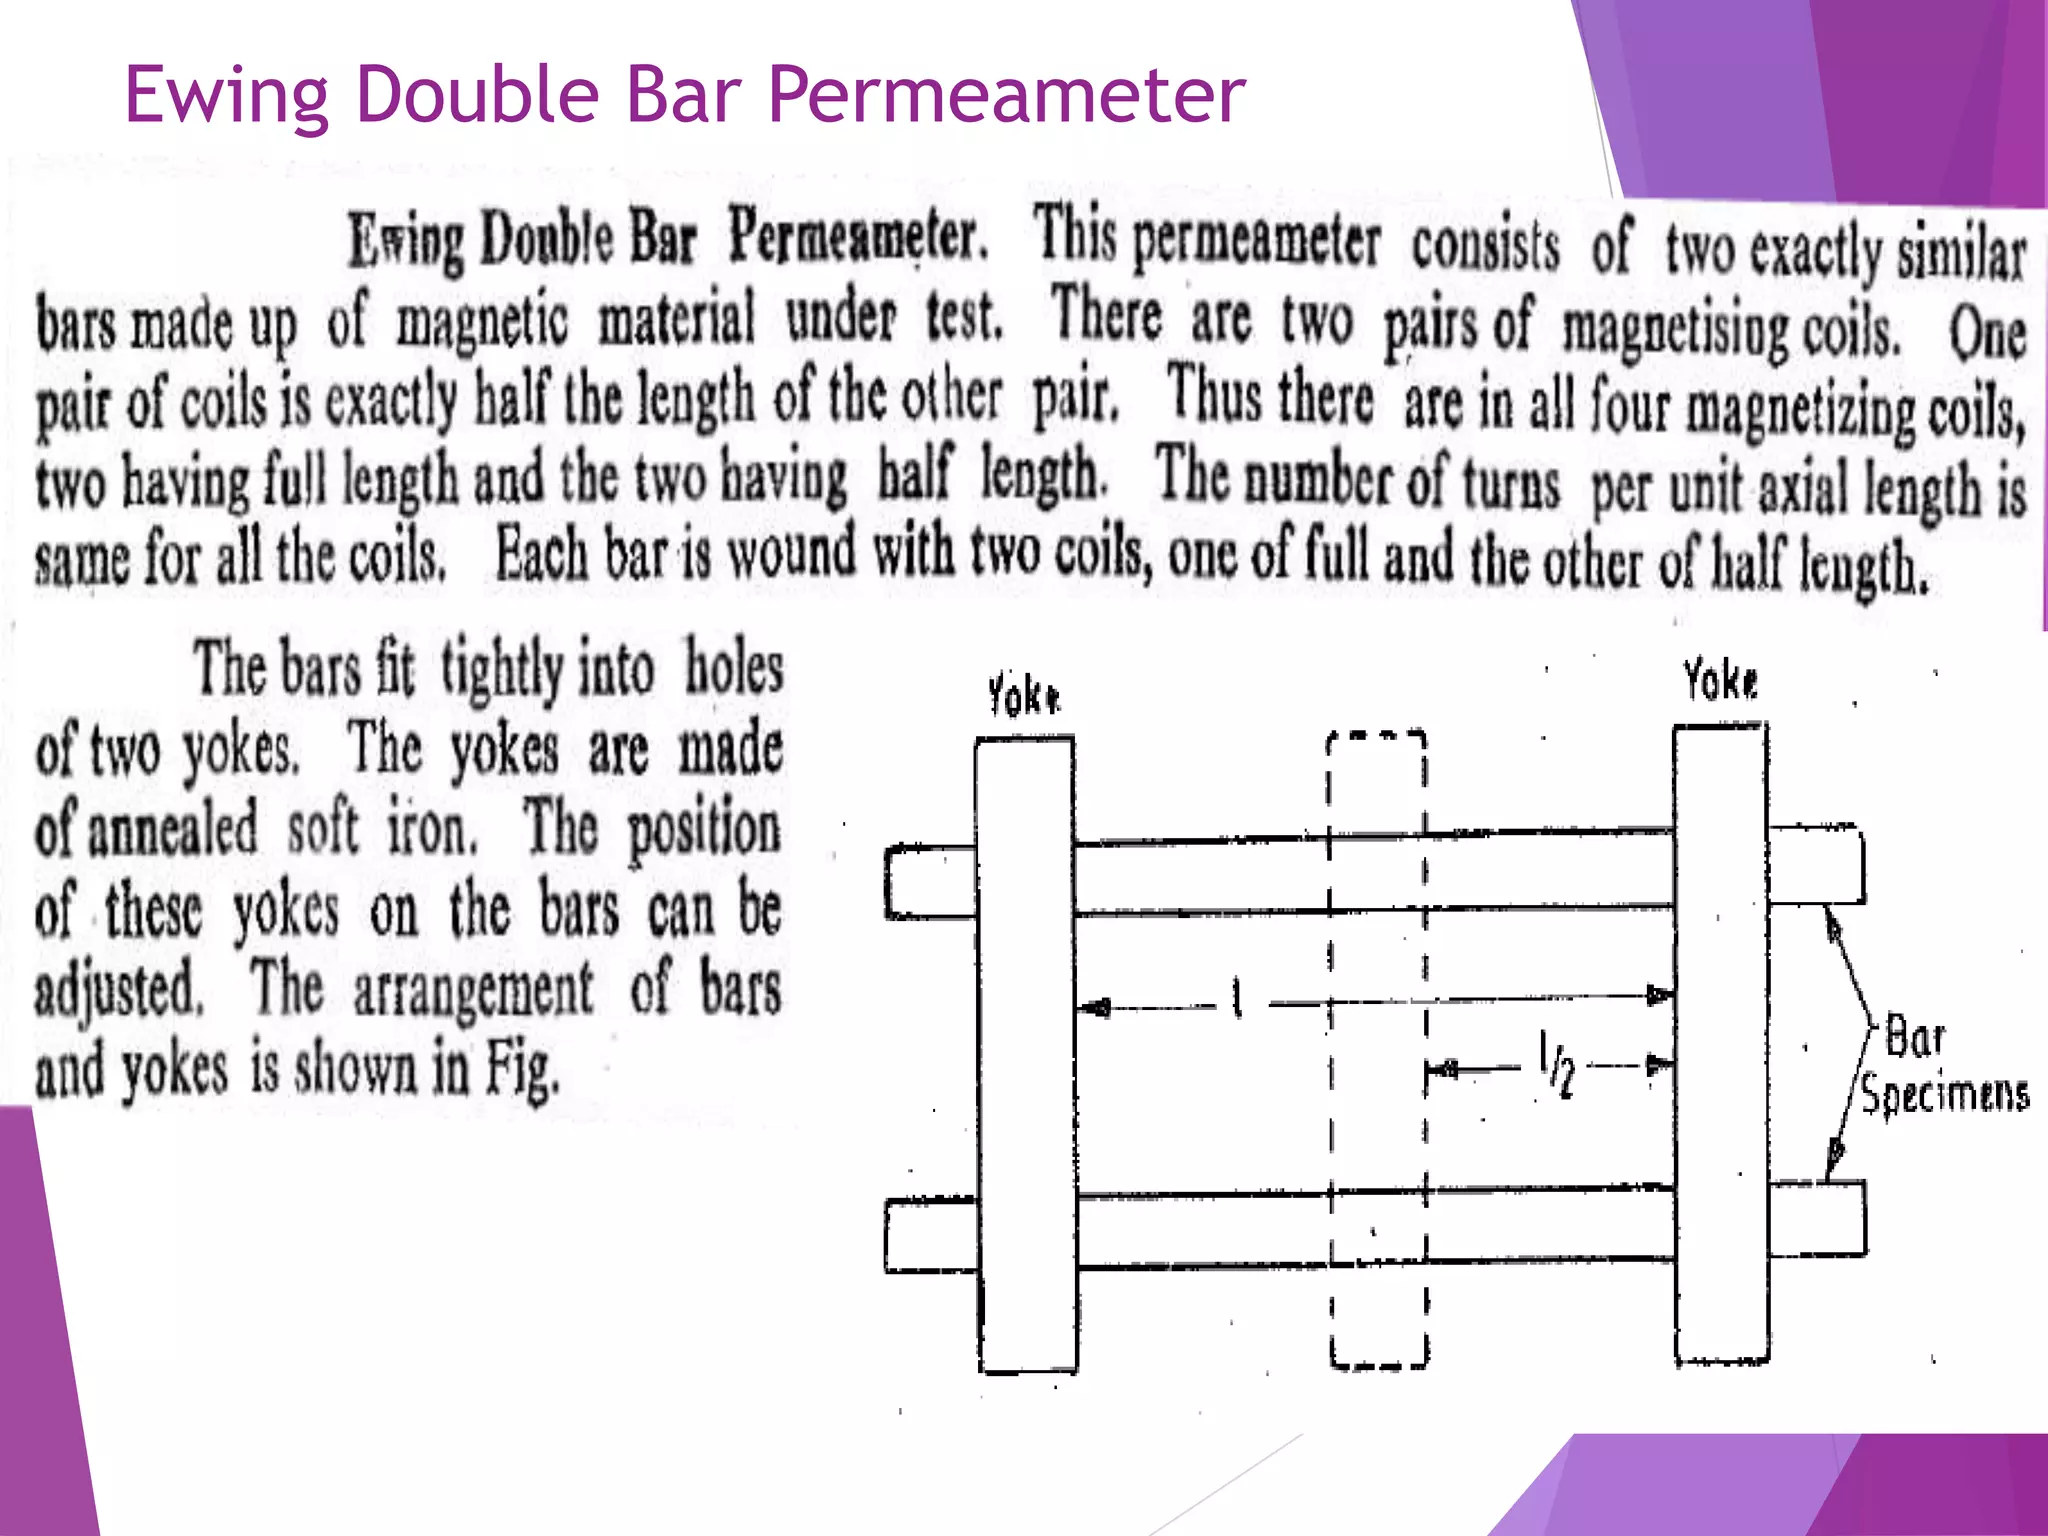
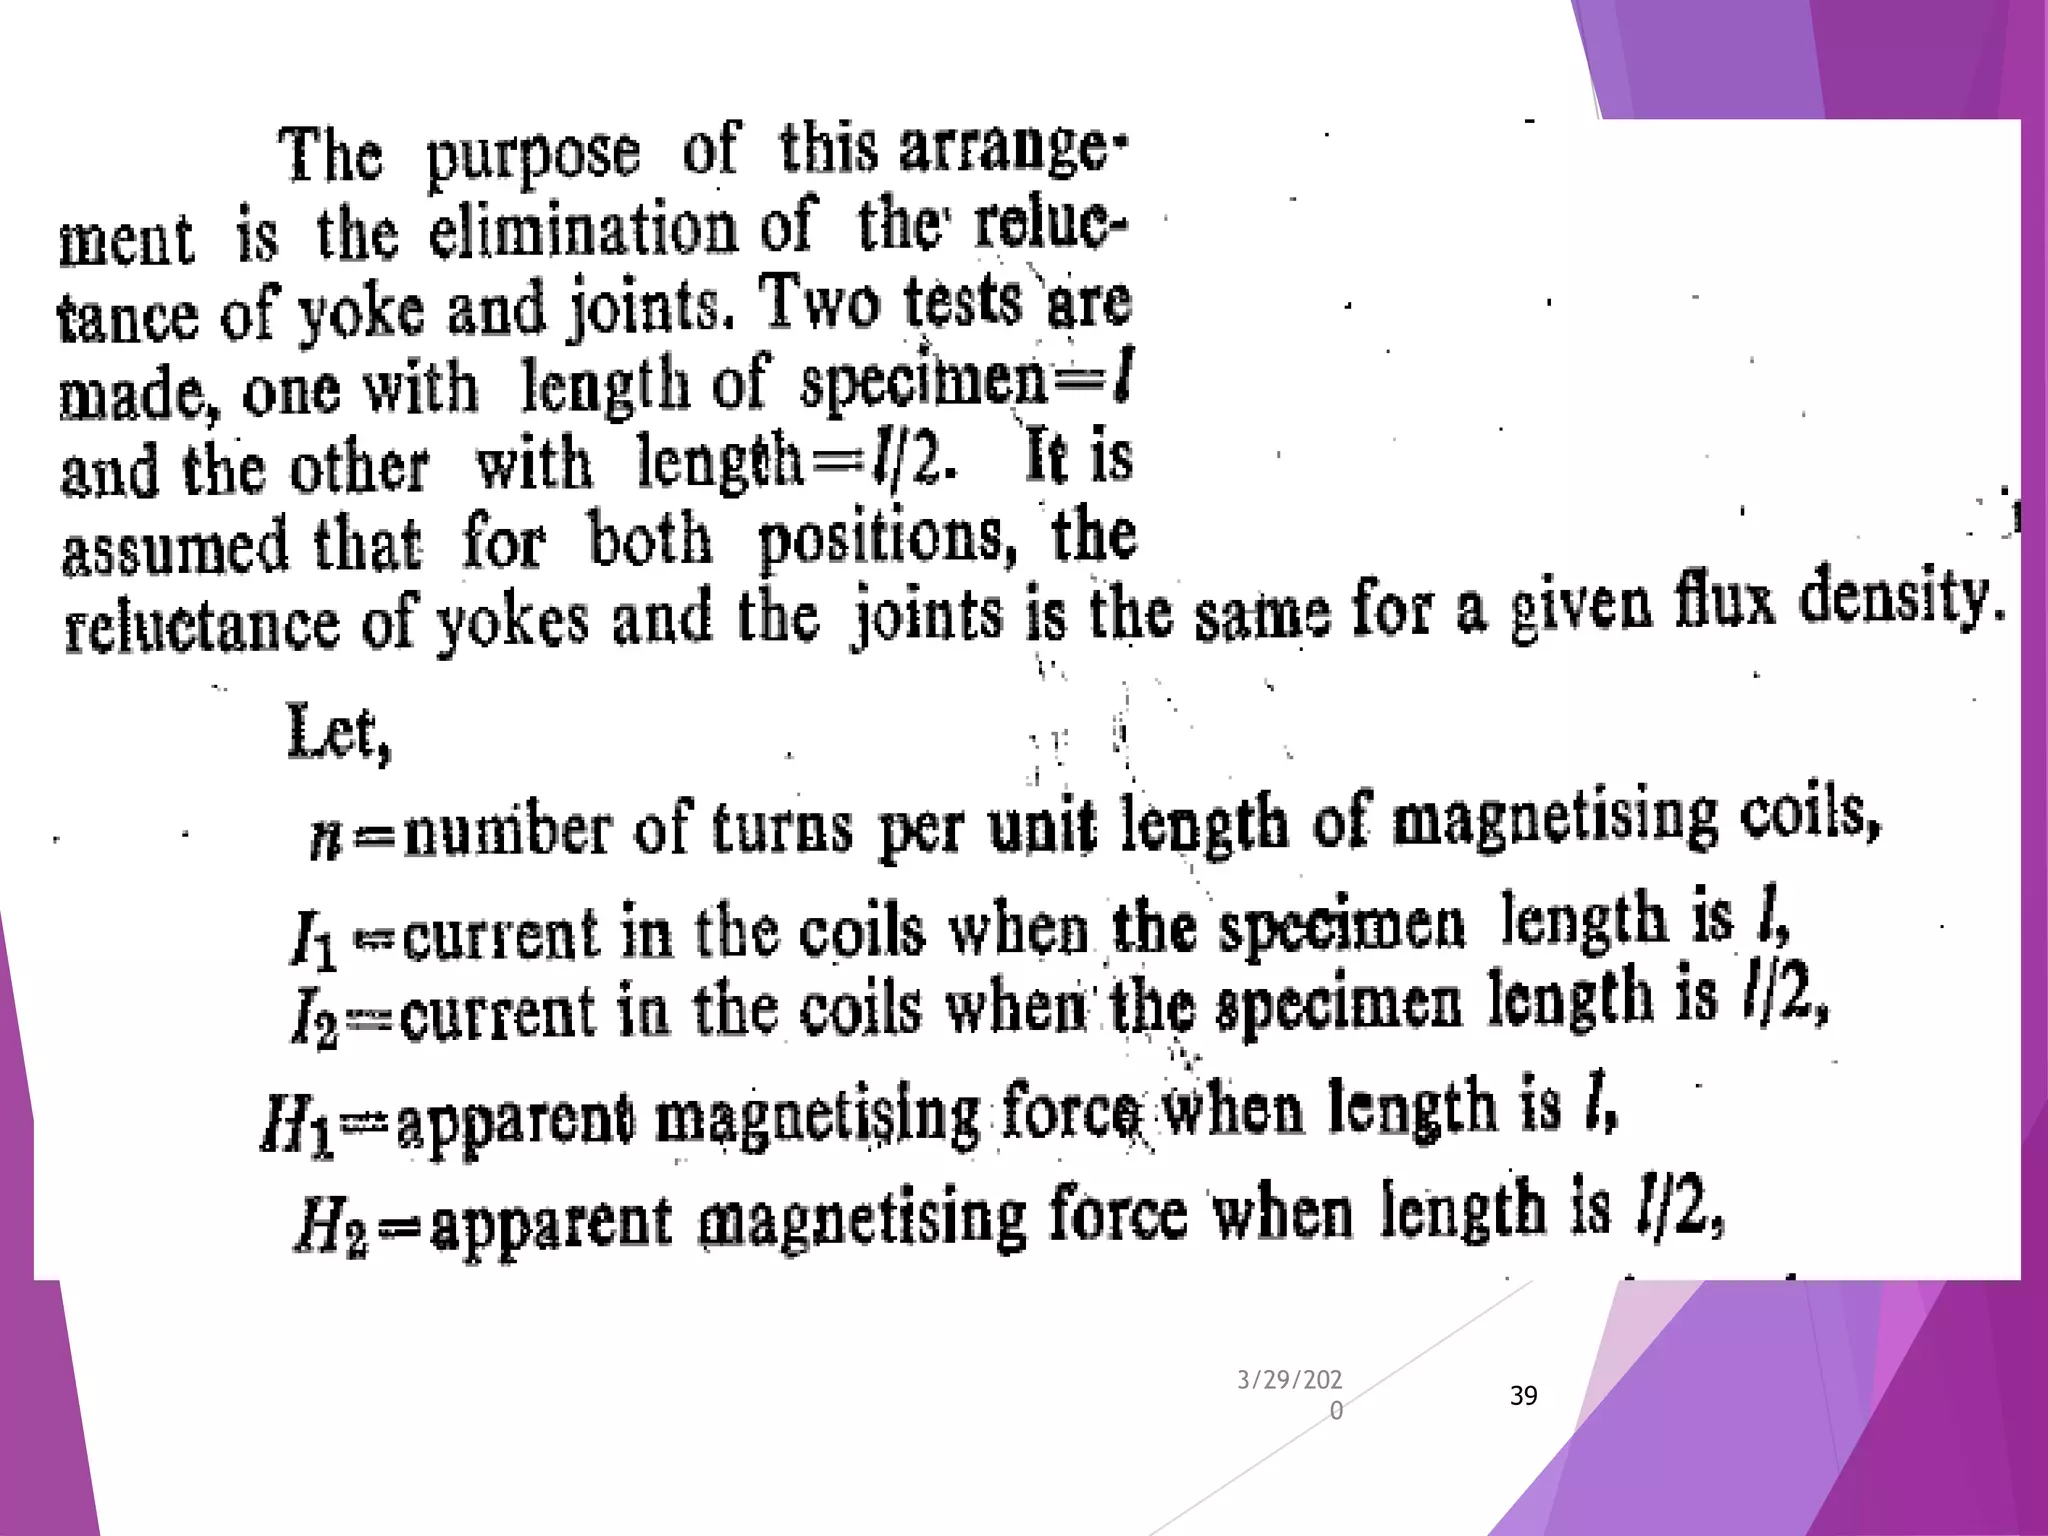
1
Electrical Measurement, Instrumentation and
Sensors
Course outline:
 Magnetic Measurement: Ballistic Test, Measurement of Flux
density, B-H curve, Testing of BarSpeciment, Permeameters:
Double Bar, Burrows, Fuhy's.R, L, C measurement :
 Transducers (Optical): Photometry and Radiometry,
Photoconductive Sensors Fritz Schuermeyer and Thad
Pickenpaugh, Photojunction Sensors, Charge-Coupled
DevicesMeasuring instruments :
 Temperature Measurement: Bimaterials Thermometers,
Resistive Thermometers, Thermistor Thermometers,
Thermocouple Thermometers, Semiconductor Junction
Thermometers Infrared Thermometers, Manometric
Thermometers, Temperature Indicators, Fiber-Optic Ther-
mometers, Thermal Imaging.
 Flow Measurement: Di_erential Pressure Flowmeters,
Variable Area Flowmeters, Positive Dis-placement
Flowmeters, Turbine and Vane Flowmeters, Impeller
Flowmeters
 Electromagnetic Flowmeters, Ultrasonic Flowmeters,
Thermal Mass Flow Sensors, Drag Force Flowmeters
 Level Strain and Torque Measurement
 DC and AC signal conditioning: basic elements, A/D and D/A
converters, Sample and Hold circuits.
 DC and AC signal conditioning: basic elements, A/D and D/A
converters, Sample and Hold circuits.
 Function generation and linearization, Noise and its sources
and Noise elimination, Op-Amp review, Instrumentation
amplifier
3/29/2020
2
 Data Transmission and Telemetry: Methods of data
transmission, dc and ac telemeter system
 Digital data transmission.
 Recording devices:
 Display devices:
 Data Acquisition system
 Microprocessor application in instrumentation
3/29/202
0
3
Books
3/29/202
0
4
Books
3/29/202
0
5
(III) GOLDINGS
CH-1:Measurements & measurement system
3/29/202
0
6
Measurement : It is a process of
converting physical parameters in
meaningful numerical numbers.
Example : Your friend is suffering from
fever. Now you ask “How is your fever ?”
He replies “Very high”. This does not
involve any measurement. But if he
replies “My temperature is 102 0 ” then it
is a meaningful number and it gives
more clear idea of his fever.
Methods of measurement :
3/29/202
0
7
Direct method: In these methods, the unknown
quantity is directly compared against a standard.
Example : Measurement of physical quantities like length, mass
and time etc.
Indirect methods: Measurement of direct methods are
not always possible ,feasible and practicable. So we
need of indirect methods of measurement……….
Instrument
3/29/202
0
8
A device for determining the value or magnitude of a quantity or
variable.
Example : A thermometer is required to measure the temperature
of a human body.
 Three phases of instruments are:
Mechanical instruments: these are very reliable for static and
stable conditions but unable to respond rapidly to measurement of
dynamic and transient condition.
Electrical instruments: more rapidly than mechanical .
Ex : galvanometer, ….
Electronic instruments: These instruments require use of
semiconductor devices. The only movement involved is that of
electrons, the response time is extremely small .
Ex : CRO
Classification of Instrument:
3/29/202
0
9
 (i) Absolute instruments : these instruments give the
magnitude of the quantity under measurement in terms
of physical constants of the instrument. Ex: tangent
galvanometer.
(ii) Secondary instruments: These are so constructed
that the quantity being measured can only be measured
by observing the output indicating by the instruments.
Ex: voltmeter, thermometer…..
Function of instruments & measurement system:
(i) Indicating function
(ii) Recording function
(iii) Controlling function
Application of measurement system: your work…
Accuracy
3/29/202
0
10
A1
10v
1
A2
9 A
9.5 A
ohm
How the instrument reading is close
to the actual quantity.
Example : Suppose you want to find the
weight of a chicken purchased from market.
The shopkeeper takes the weight by his
“Daripalla” to be 1kg and 100 gram. But if
you take the weight with a balance in your
Laboratory, you may find it to be 1.1053 kg,
which is more closer to the actual quantity.
Precision
3/29/202
0
11
10
5
3
2
1
Megaohm
2957358
ohm
It is the degree to which successive measurements
differ from each other.
Sensitivity
3/29/202
0
12
100
150
200
100
200
400
V
V
Ratio of the response of the
instrument to a change of the
input signal.
Example : Suppose two
voltmeters are used to
measure the voltage of the
same circuit. Now the circuit
is slightly changed so that the
voltage is also changed by a
small quantity. The pointer of
one meter moves by small
distance, whereas the pointer
of the other meter moves by
a larger distance. Therefore
the second meter is more
sensitive.
Resolution
3/29/202
0
13
1
2
3
4
5
Voltmeter
1
2
3
4
5
Voltmeter
The smallest change in the
instrument reading to which it can
respond.
Example : Suppose you purchase a
fish. The fisherman has a “Daripalla”
and “Butkhara”, the minimum size of
the butkhara which he has is 100 gm.
So the weight of your fish will be
either 800gm or 900gm or 1000gm
etc.
Error
3/29/202
0
14
Error
Gross
Error
Systematic
Error
Random
Error
Deviation from the true value of the quantity
measured.
All errors may be classified into three different
types.
Gross Error
3/29/202
0
15
10
20
30
40
50
Voltmeter
10X0
100v
10k
10k
V
R=10k
Human error
Misreading of
Instrument
Incorrect adjustment
Improper application
Computational
mistakes
Systematic Error
3/29/202
0
16
Instrumental error
•Frictional loss
•Irregular spring
tension
•Overloading
•Permanent Stress
•More…..
Environmental error
•Dusty environment
•Temperature change
•Humidity
•Electromagnetic field
•More…..
Random Error
3/29/202
0
17
Error due to unknown causes even all
precautions and preventive measures are
observed.
Example : Suppose a voltmeter is used to
monitor the voltage of a circuit at an interval of 1
hour. Sometimes it is observed that the meter
reading includes small amount of deviations in
each reading, even if all cautions are taken.
Elimination of Error
3/29/202
0
18
Minimization of Gross error :
Be more careful while taking
reading.
Minimization of Random
error :
Increase the number of
reading and apply statistical
analysis.
Minimization of Systematic
error :
•Take care of your measuring
Instrument.
•Ensure proper environment.
Errors can not be eliminated totally. However it can
be minimized by observing proper corrective steps.
Ammeter
3/29/202
0
19
Is = I – Im
Rs = Im Rm / Is
Ammeter
10v
1
10 A
ohm
Voltmeter
3/29/202
0
20
100v
1
1
ohm
ohm
Voltmeter
Magnetic Measurement
Principle Requirement for Magnetic Measurements are:
 Measurement of magnetic strength in air
 The Determination of B-H curve and Hysteresis loop for
the soft ferromagnetic materials
 Determination of Eddy Current and Hysteresis losses
 Testing of Permanent Magnet
3/29/202
0
21
Types of Tests
 Ballistic Tests
 A.C. Testing
 Steady State Test
Ballistic Tests: These Test are generally employed
for the determination of B-H Curve and
Hysteresis loop
A.C Testing: These are Carried out at power,
audio or radio frequencies
Steady State Test: These are performed to obtain
the steady value of flux density existing in the air
gap of a magnetic circuit
3/29/202
0
22
Measurement of flux density
3/29/202
0
23
3/29/202
0
24
3/29/202
0
25
B-H Curve
3/29/202
0
26
 When initially magnetised, the curve follows
points a–b on the graph, but on reducing H to zero,
some residual magnetism remains (point c - also
known as the remanent flux density). In order to
fully demagnetise the specimen, it is necessary to
apply a negative magnetic field strength (point d -
called the coercive force). Making H increasingly
negative leads to negative saturation (point e).
If H is reduced back to zero, point f is reached
(negative residual magnetism). As H becomes
positive, the flux density reduces to zero (point g)
and then becomes positive, finally returning back
to point b (positive saturation), after which the
cycle b–g repeats.
3/29/202
0
27
 The area enclosed by the B-H curve (shaded
light blue above) is proportional to the energy
loss as the ferromagnetic material is
magnetised with varying polarity by connection
to an alternating (AC) power supply. This energy
loss is undesirable and causes unwanted heating
of the material. In general, harder
ferromagnetic materials have higher hysteresis
losses, since more energy is required to realign
the magnetic domains
3/29/202
0
28
Determination of B-H Curve
Two methods:
 Methods of Reversal
 Step by Step Method
3/29/202
0
29
Methods of Reversal
3/29/202
0
30
Step by Step Method
3/29/202
0
31
3/29/202
0
32
Determination of Hysteresis
loop
 Step By Step Method
 Method of Reversal
3/29/202
0
33
Testing Of Bar Specimen
3/29/202
0
34
3/29/202
0
35
Permeameter
3/29/202
0
36
3/29/202
0
37
Ewing Double Bar Permeameter
3/29/202
0
38
3/29/202
0
39
3/29/202
0
40
Burrow’s Permeameter
3/29/202
0
41
3/29/202
0
42
3/29/202
0
43
3/29/202
0
44

Electrical Measurement, Instrumentation and Sensors

  • 1.
    1 Electrical Measurement, Instrumentationand Sensors Course outline:  Magnetic Measurement: Ballistic Test, Measurement of Flux density, B-H curve, Testing of BarSpeciment, Permeameters: Double Bar, Burrows, Fuhy's.R, L, C measurement :  Transducers (Optical): Photometry and Radiometry, Photoconductive Sensors Fritz Schuermeyer and Thad Pickenpaugh, Photojunction Sensors, Charge-Coupled DevicesMeasuring instruments :  Temperature Measurement: Bimaterials Thermometers, Resistive Thermometers, Thermistor Thermometers, Thermocouple Thermometers, Semiconductor Junction Thermometers Infrared Thermometers, Manometric Thermometers, Temperature Indicators, Fiber-Optic Ther- mometers, Thermal Imaging.
  • 2.
     Flow Measurement:Di_erential Pressure Flowmeters, Variable Area Flowmeters, Positive Dis-placement Flowmeters, Turbine and Vane Flowmeters, Impeller Flowmeters  Electromagnetic Flowmeters, Ultrasonic Flowmeters, Thermal Mass Flow Sensors, Drag Force Flowmeters  Level Strain and Torque Measurement  DC and AC signal conditioning: basic elements, A/D and D/A converters, Sample and Hold circuits.  DC and AC signal conditioning: basic elements, A/D and D/A converters, Sample and Hold circuits.  Function generation and linearization, Noise and its sources and Noise elimination, Op-Amp review, Instrumentation amplifier 3/29/2020 2
  • 3.
     Data Transmissionand Telemetry: Methods of data transmission, dc and ac telemeter system  Digital data transmission.  Recording devices:  Display devices:  Data Acquisition system  Microprocessor application in instrumentation 3/29/202 0 3
  • 4.
  • 5.
  • 6.
    CH-1:Measurements & measurementsystem 3/29/202 0 6 Measurement : It is a process of converting physical parameters in meaningful numerical numbers. Example : Your friend is suffering from fever. Now you ask “How is your fever ?” He replies “Very high”. This does not involve any measurement. But if he replies “My temperature is 102 0 ” then it is a meaningful number and it gives more clear idea of his fever.
  • 7.
    Methods of measurement: 3/29/202 0 7 Direct method: In these methods, the unknown quantity is directly compared against a standard. Example : Measurement of physical quantities like length, mass and time etc. Indirect methods: Measurement of direct methods are not always possible ,feasible and practicable. So we need of indirect methods of measurement……….
  • 8.
    Instrument 3/29/202 0 8 A device fordetermining the value or magnitude of a quantity or variable. Example : A thermometer is required to measure the temperature of a human body.  Three phases of instruments are: Mechanical instruments: these are very reliable for static and stable conditions but unable to respond rapidly to measurement of dynamic and transient condition. Electrical instruments: more rapidly than mechanical . Ex : galvanometer, …. Electronic instruments: These instruments require use of semiconductor devices. The only movement involved is that of electrons, the response time is extremely small . Ex : CRO
  • 9.
    Classification of Instrument: 3/29/202 0 9 (i) Absolute instruments : these instruments give the magnitude of the quantity under measurement in terms of physical constants of the instrument. Ex: tangent galvanometer. (ii) Secondary instruments: These are so constructed that the quantity being measured can only be measured by observing the output indicating by the instruments. Ex: voltmeter, thermometer….. Function of instruments & measurement system: (i) Indicating function (ii) Recording function (iii) Controlling function Application of measurement system: your work…
  • 10.
    Accuracy 3/29/202 0 10 A1 10v 1 A2 9 A 9.5 A ohm Howthe instrument reading is close to the actual quantity. Example : Suppose you want to find the weight of a chicken purchased from market. The shopkeeper takes the weight by his “Daripalla” to be 1kg and 100 gram. But if you take the weight with a balance in your Laboratory, you may find it to be 1.1053 kg, which is more closer to the actual quantity.
  • 11.
    Precision 3/29/202 0 11 10 5 3 2 1 Megaohm 2957358 ohm It is thedegree to which successive measurements differ from each other.
  • 12.
    Sensitivity 3/29/202 0 12 100 150 200 100 200 400 V V Ratio of theresponse of the instrument to a change of the input signal. Example : Suppose two voltmeters are used to measure the voltage of the same circuit. Now the circuit is slightly changed so that the voltage is also changed by a small quantity. The pointer of one meter moves by small distance, whereas the pointer of the other meter moves by a larger distance. Therefore the second meter is more sensitive.
  • 13.
    Resolution 3/29/202 0 13 1 2 3 4 5 Voltmeter 1 2 3 4 5 Voltmeter The smallest changein the instrument reading to which it can respond. Example : Suppose you purchase a fish. The fisherman has a “Daripalla” and “Butkhara”, the minimum size of the butkhara which he has is 100 gm. So the weight of your fish will be either 800gm or 900gm or 1000gm etc.
  • 14.
    Error 3/29/202 0 14 Error Gross Error Systematic Error Random Error Deviation from thetrue value of the quantity measured. All errors may be classified into three different types.
  • 15.
    Gross Error 3/29/202 0 15 10 20 30 40 50 Voltmeter 10X0 100v 10k 10k V R=10k Human error Misreadingof Instrument Incorrect adjustment Improper application Computational mistakes
  • 16.
    Systematic Error 3/29/202 0 16 Instrumental error •Frictionalloss •Irregular spring tension •Overloading •Permanent Stress •More….. Environmental error •Dusty environment •Temperature change •Humidity •Electromagnetic field •More…..
  • 17.
    Random Error 3/29/202 0 17 Error dueto unknown causes even all precautions and preventive measures are observed. Example : Suppose a voltmeter is used to monitor the voltage of a circuit at an interval of 1 hour. Sometimes it is observed that the meter reading includes small amount of deviations in each reading, even if all cautions are taken.
  • 18.
    Elimination of Error 3/29/202 0 18 Minimizationof Gross error : Be more careful while taking reading. Minimization of Random error : Increase the number of reading and apply statistical analysis. Minimization of Systematic error : •Take care of your measuring Instrument. •Ensure proper environment. Errors can not be eliminated totally. However it can be minimized by observing proper corrective steps.
  • 19.
    Ammeter 3/29/202 0 19 Is = I– Im Rs = Im Rm / Is Ammeter 10v 1 10 A ohm
  • 20.
  • 21.
    Magnetic Measurement Principle Requirementfor Magnetic Measurements are:  Measurement of magnetic strength in air  The Determination of B-H curve and Hysteresis loop for the soft ferromagnetic materials  Determination of Eddy Current and Hysteresis losses  Testing of Permanent Magnet 3/29/202 0 21
  • 22.
    Types of Tests Ballistic Tests  A.C. Testing  Steady State Test Ballistic Tests: These Test are generally employed for the determination of B-H Curve and Hysteresis loop A.C Testing: These are Carried out at power, audio or radio frequencies Steady State Test: These are performed to obtain the steady value of flux density existing in the air gap of a magnetic circuit 3/29/202 0 22
  • 23.
    Measurement of fluxdensity 3/29/202 0 23
  • 24.
  • 25.
  • 26.
  • 27.
     When initiallymagnetised, the curve follows points a–b on the graph, but on reducing H to zero, some residual magnetism remains (point c - also known as the remanent flux density). In order to fully demagnetise the specimen, it is necessary to apply a negative magnetic field strength (point d - called the coercive force). Making H increasingly negative leads to negative saturation (point e). If H is reduced back to zero, point f is reached (negative residual magnetism). As H becomes positive, the flux density reduces to zero (point g) and then becomes positive, finally returning back to point b (positive saturation), after which the cycle b–g repeats. 3/29/202 0 27
  • 28.
     The areaenclosed by the B-H curve (shaded light blue above) is proportional to the energy loss as the ferromagnetic material is magnetised with varying polarity by connection to an alternating (AC) power supply. This energy loss is undesirable and causes unwanted heating of the material. In general, harder ferromagnetic materials have higher hysteresis losses, since more energy is required to realign the magnetic domains 3/29/202 0 28
  • 29.
    Determination of B-HCurve Two methods:  Methods of Reversal  Step by Step Method 3/29/202 0 29
  • 30.
  • 31.
    Step by StepMethod 3/29/202 0 31
  • 32.
  • 33.
    Determination of Hysteresis loop Step By Step Method  Method of Reversal 3/29/202 0 33
  • 34.
    Testing Of BarSpecimen 3/29/202 0 34
  • 35.
  • 36.
  • 37.
  • 38.
    Ewing Double BarPermeameter 3/29/202 0 38
  • 39.
  • 40.
  • 41.
  • 42.
  • 43.
  • 44.