Visual media refers to sources of information presented visually through representations that require interpretation. It includes things hosted online, in print, or through broadcast media.
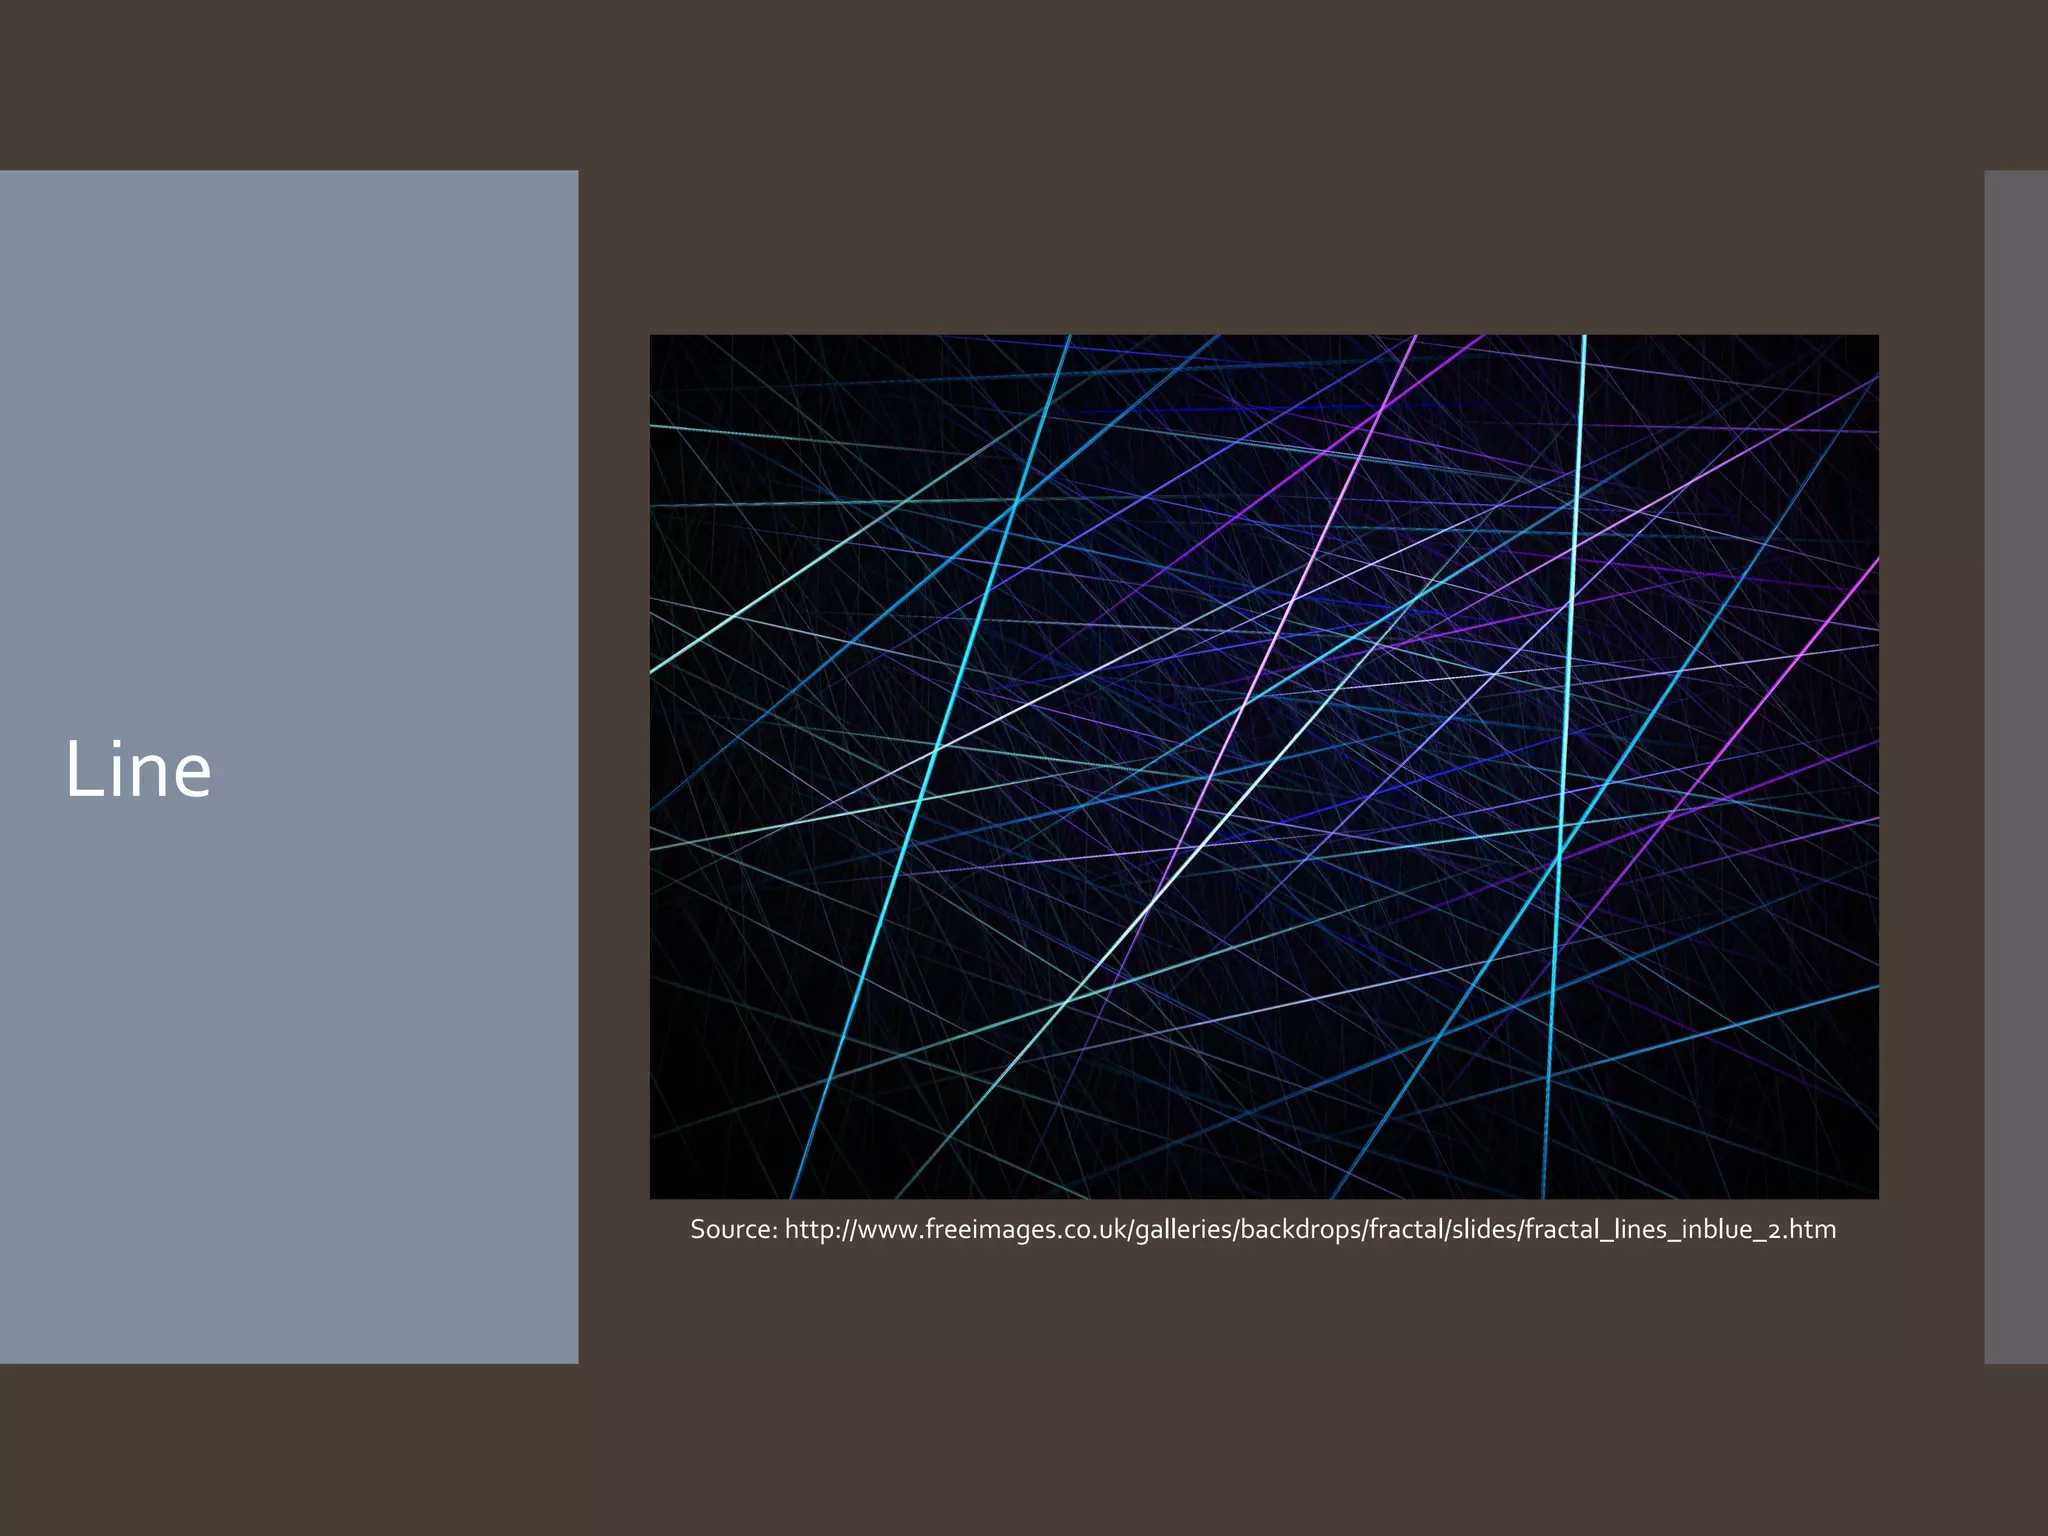
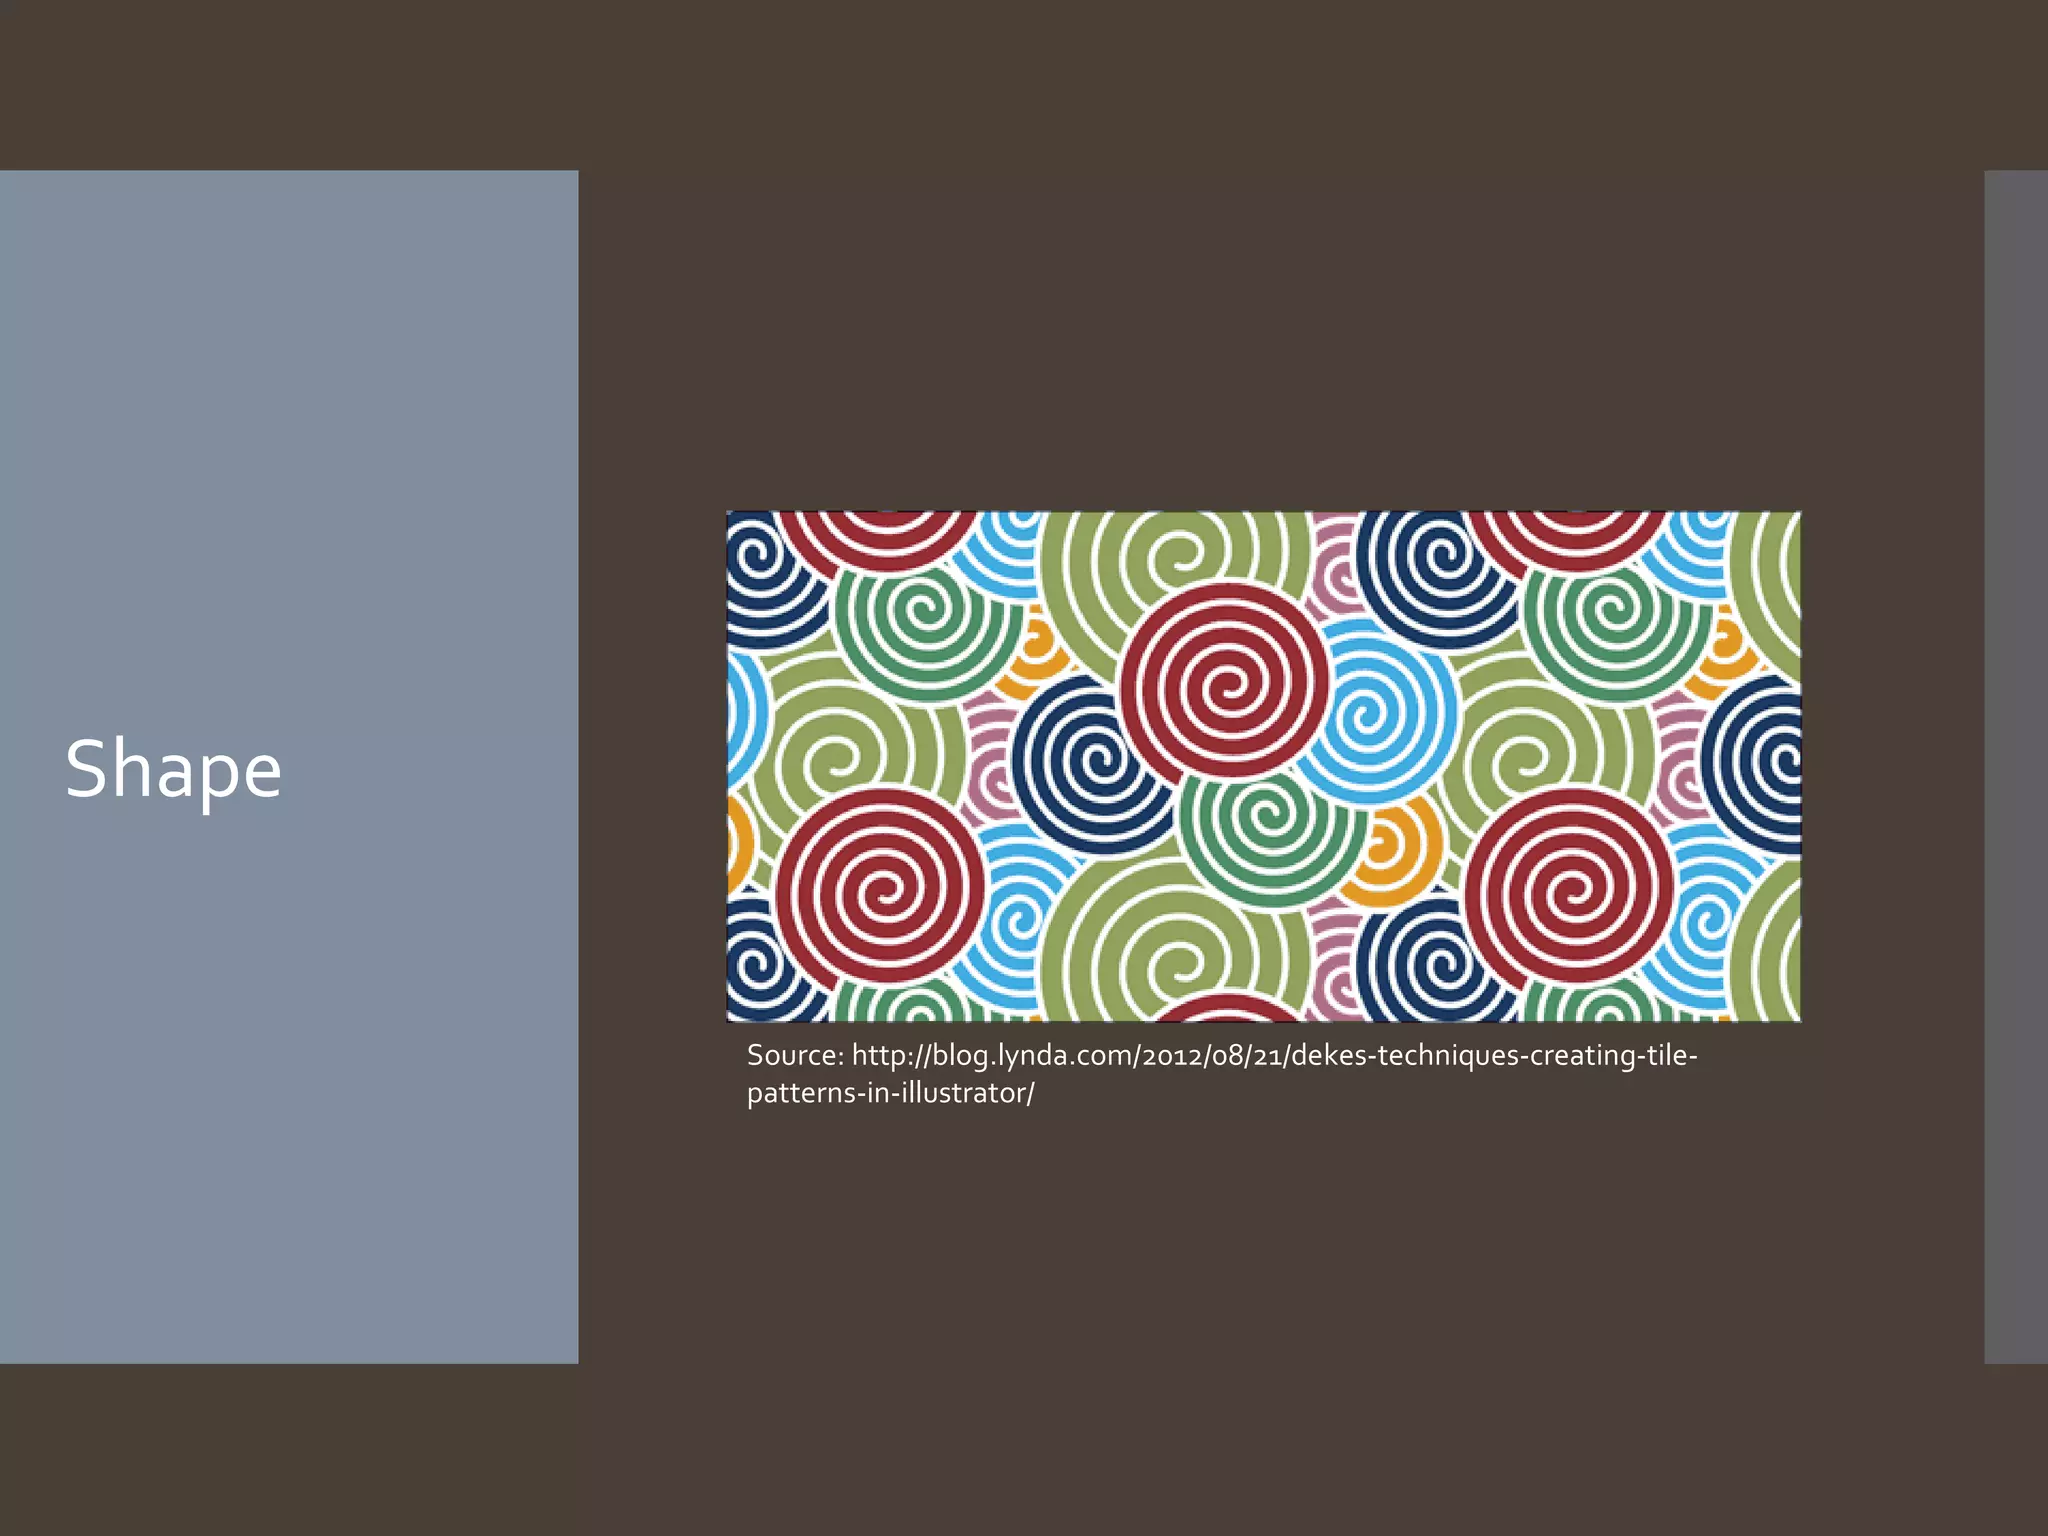
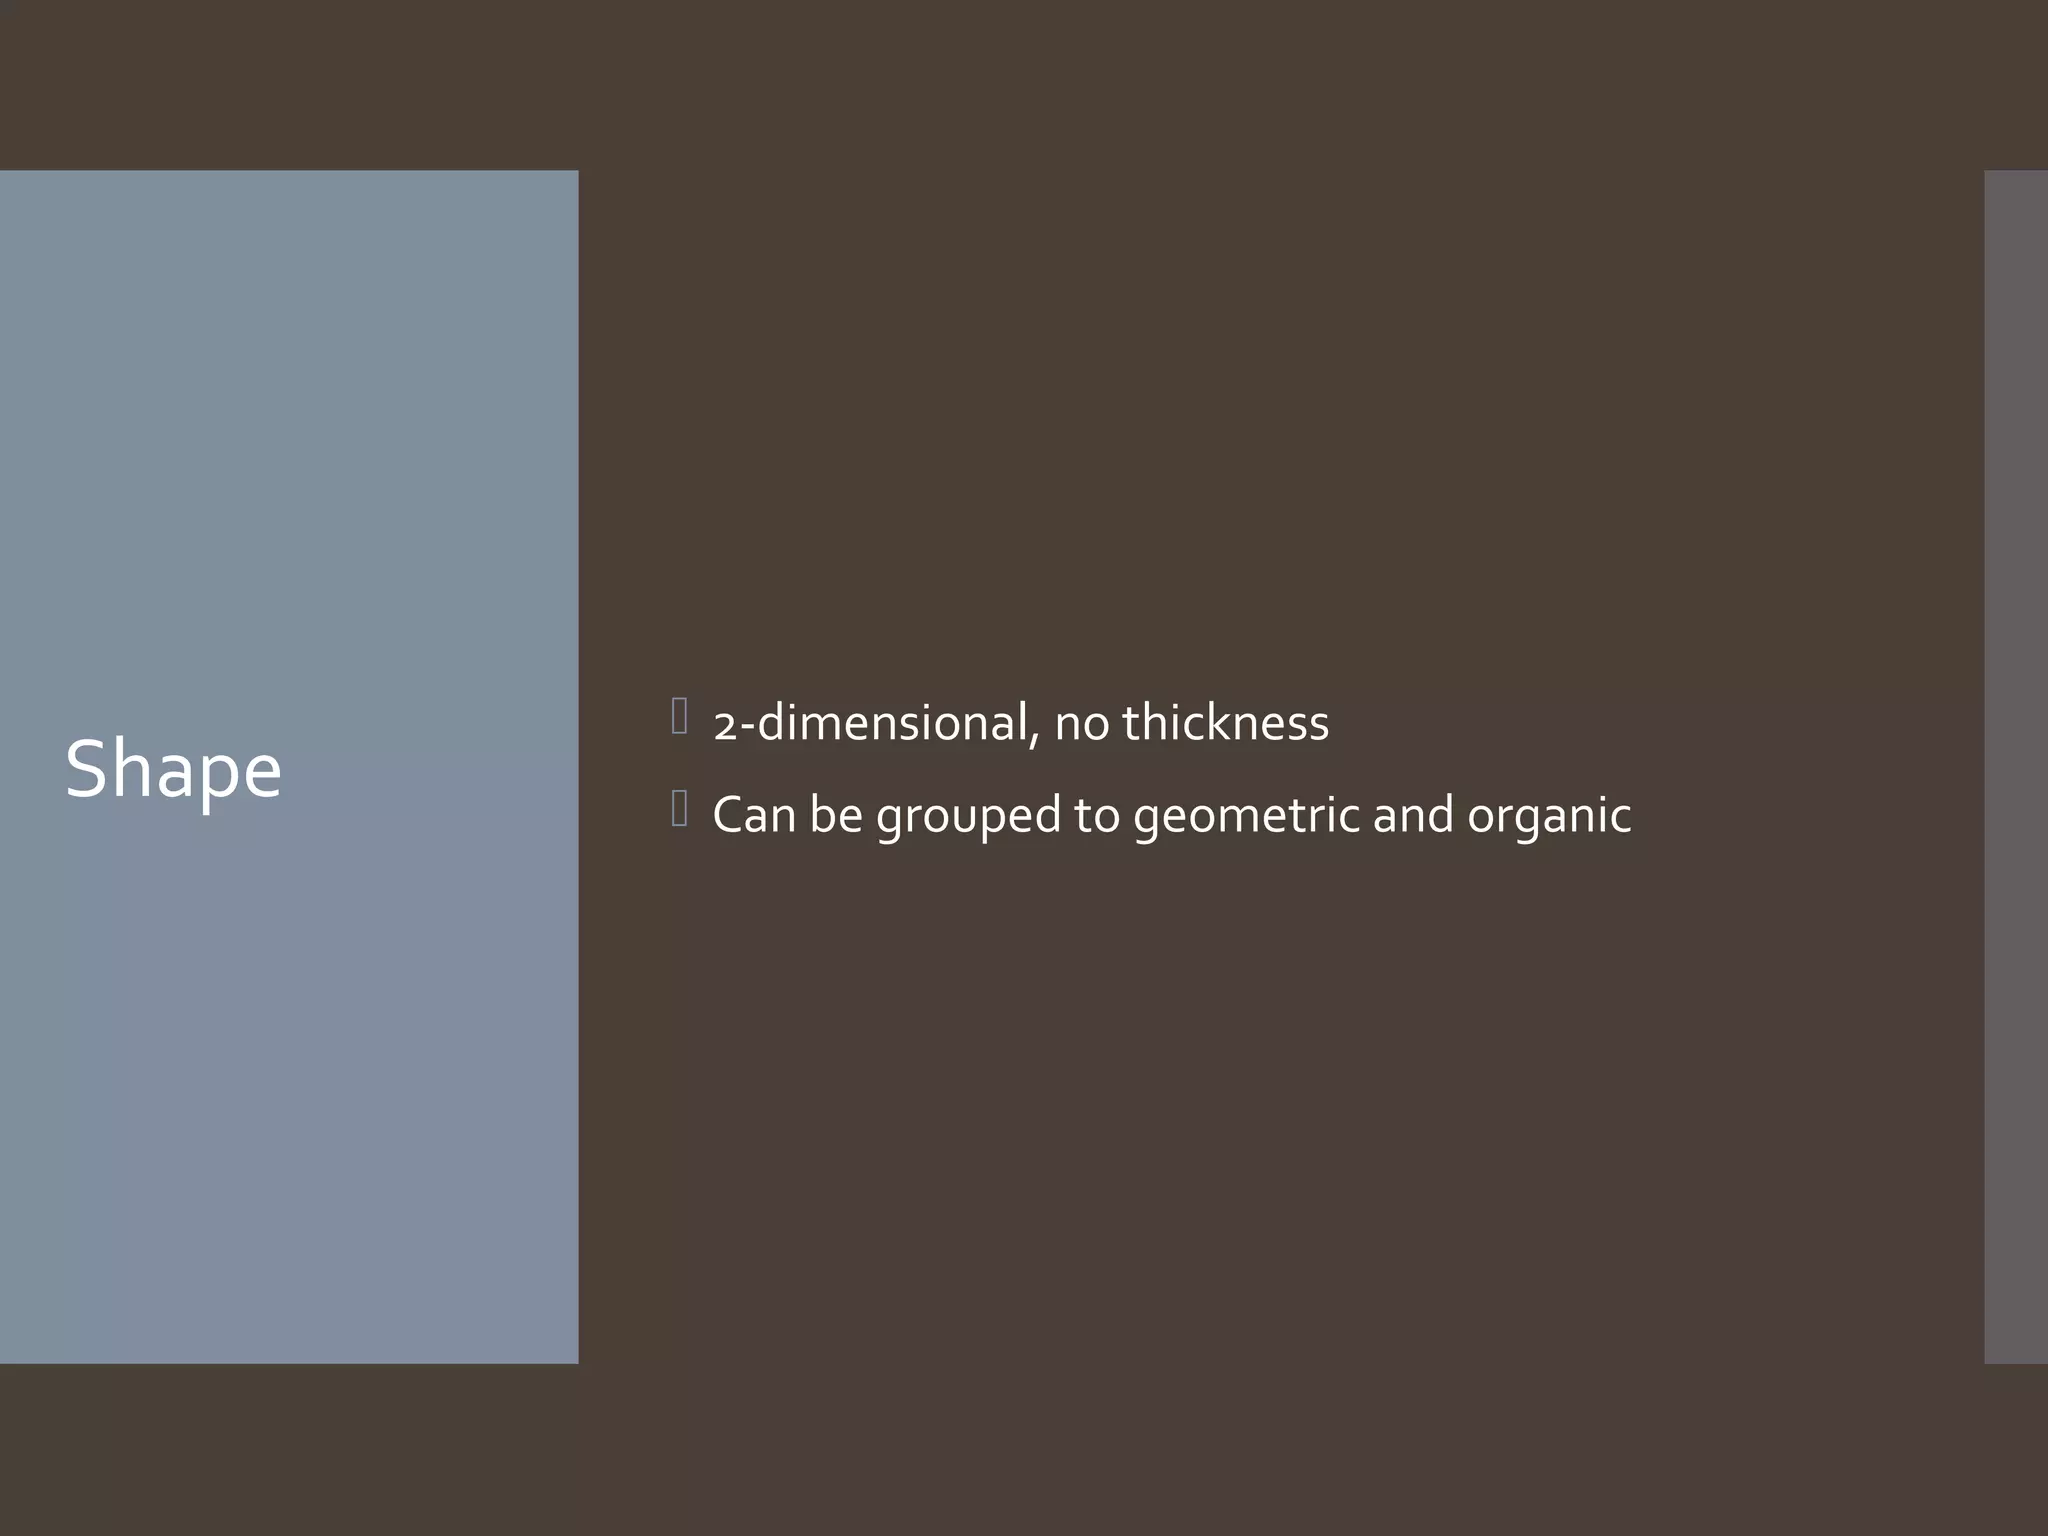
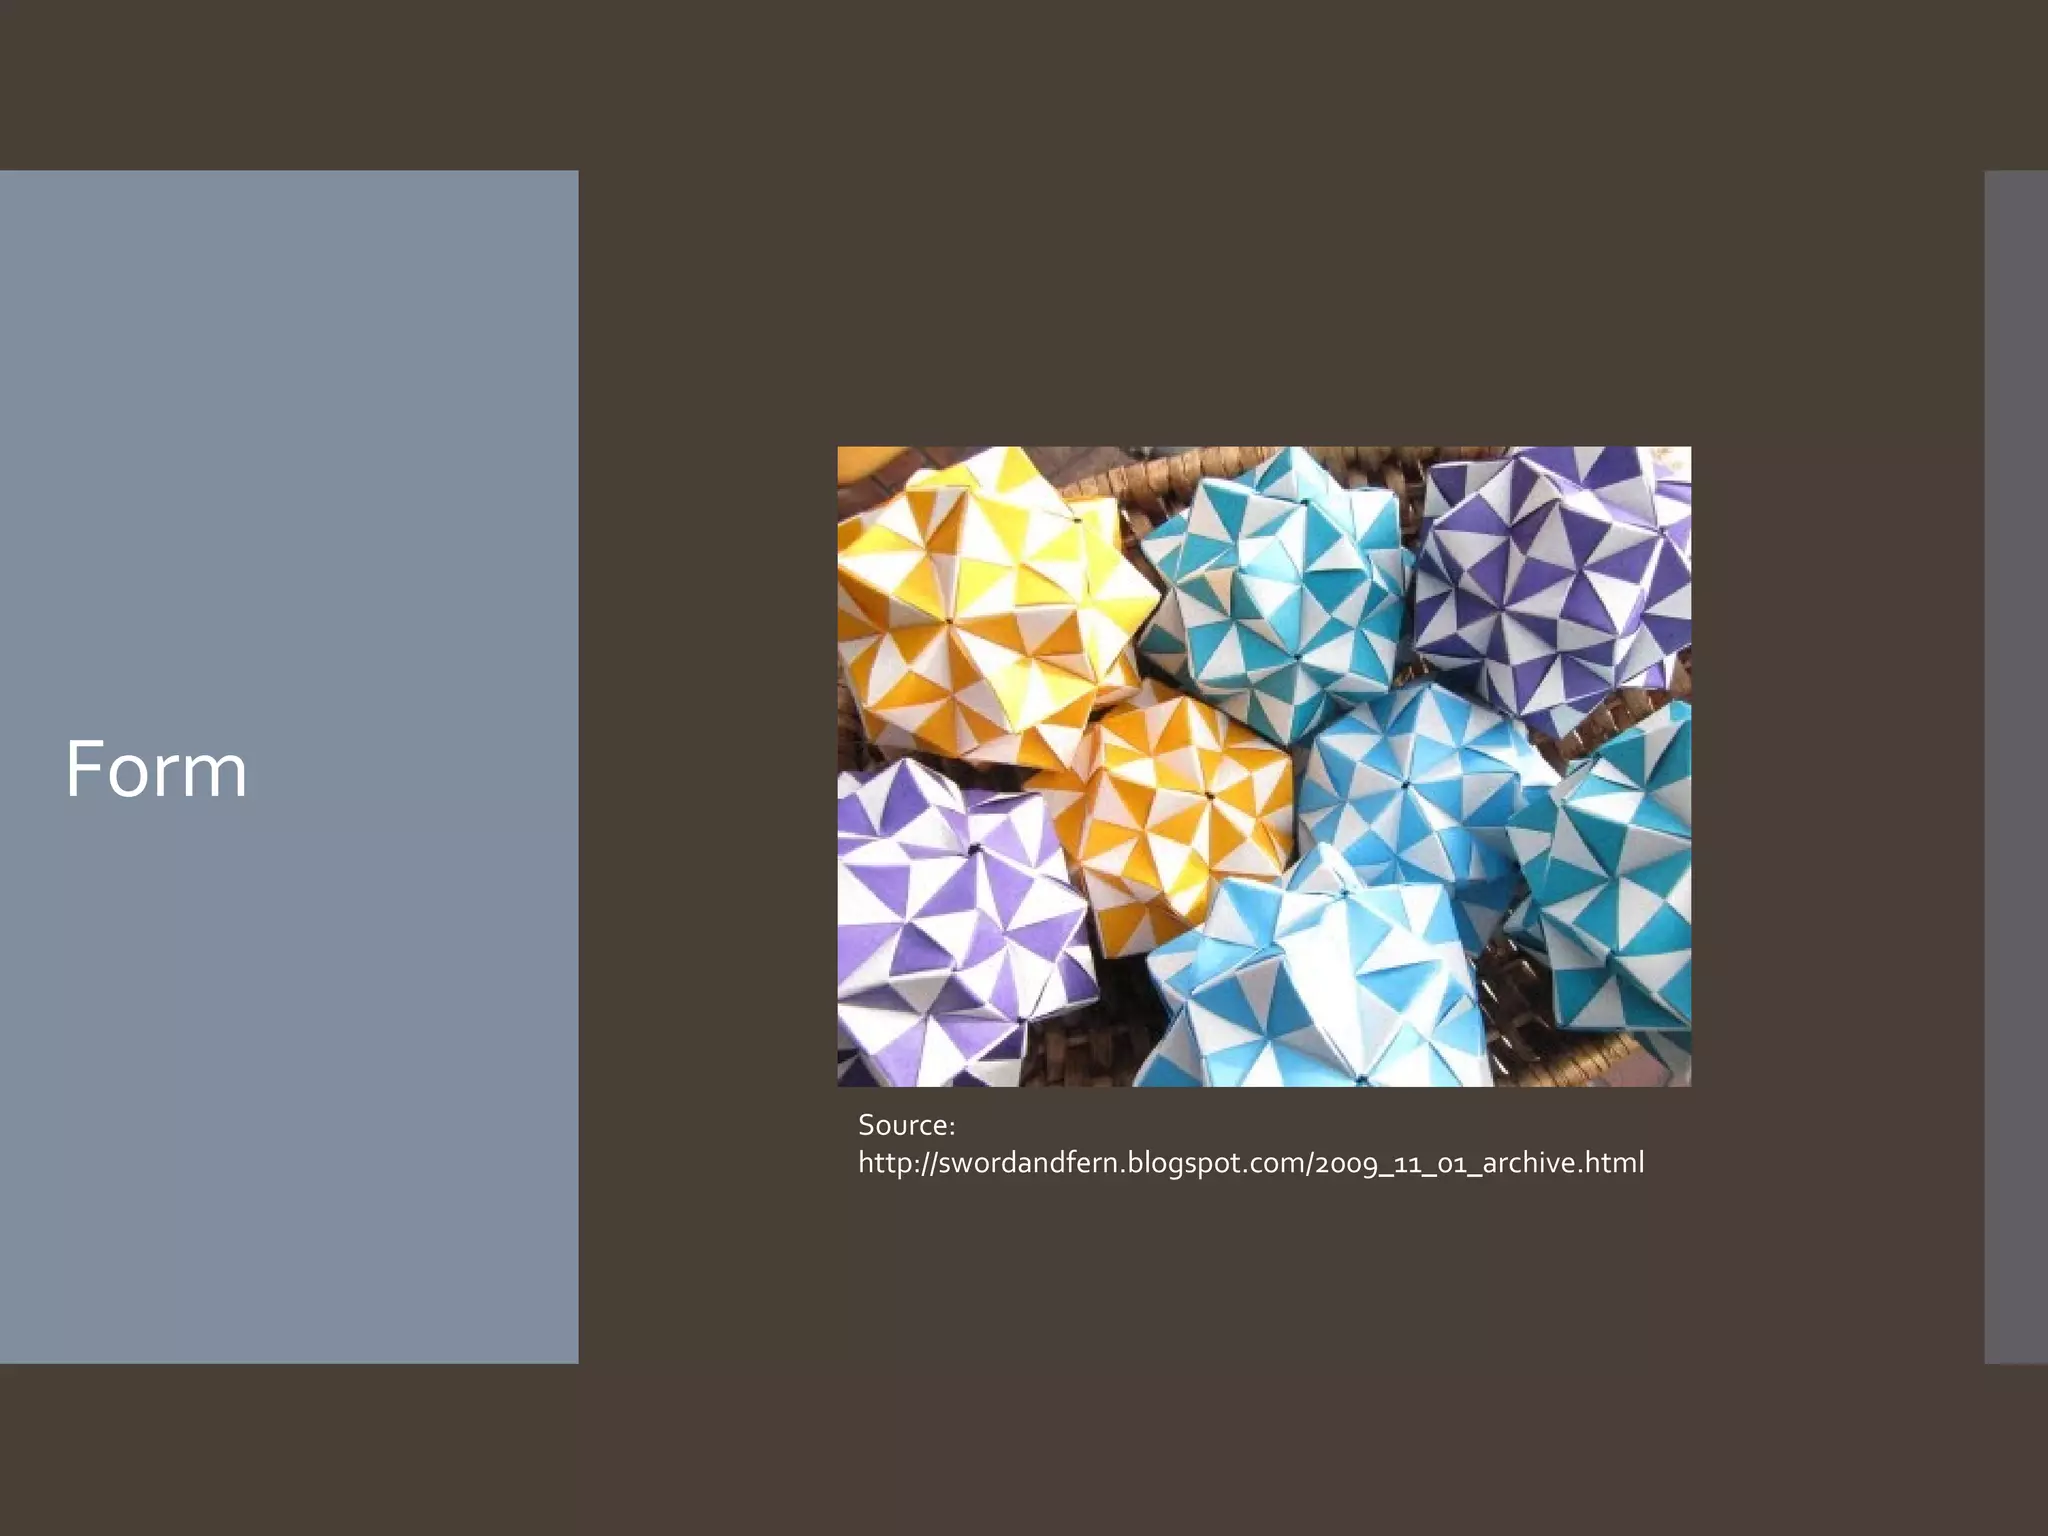
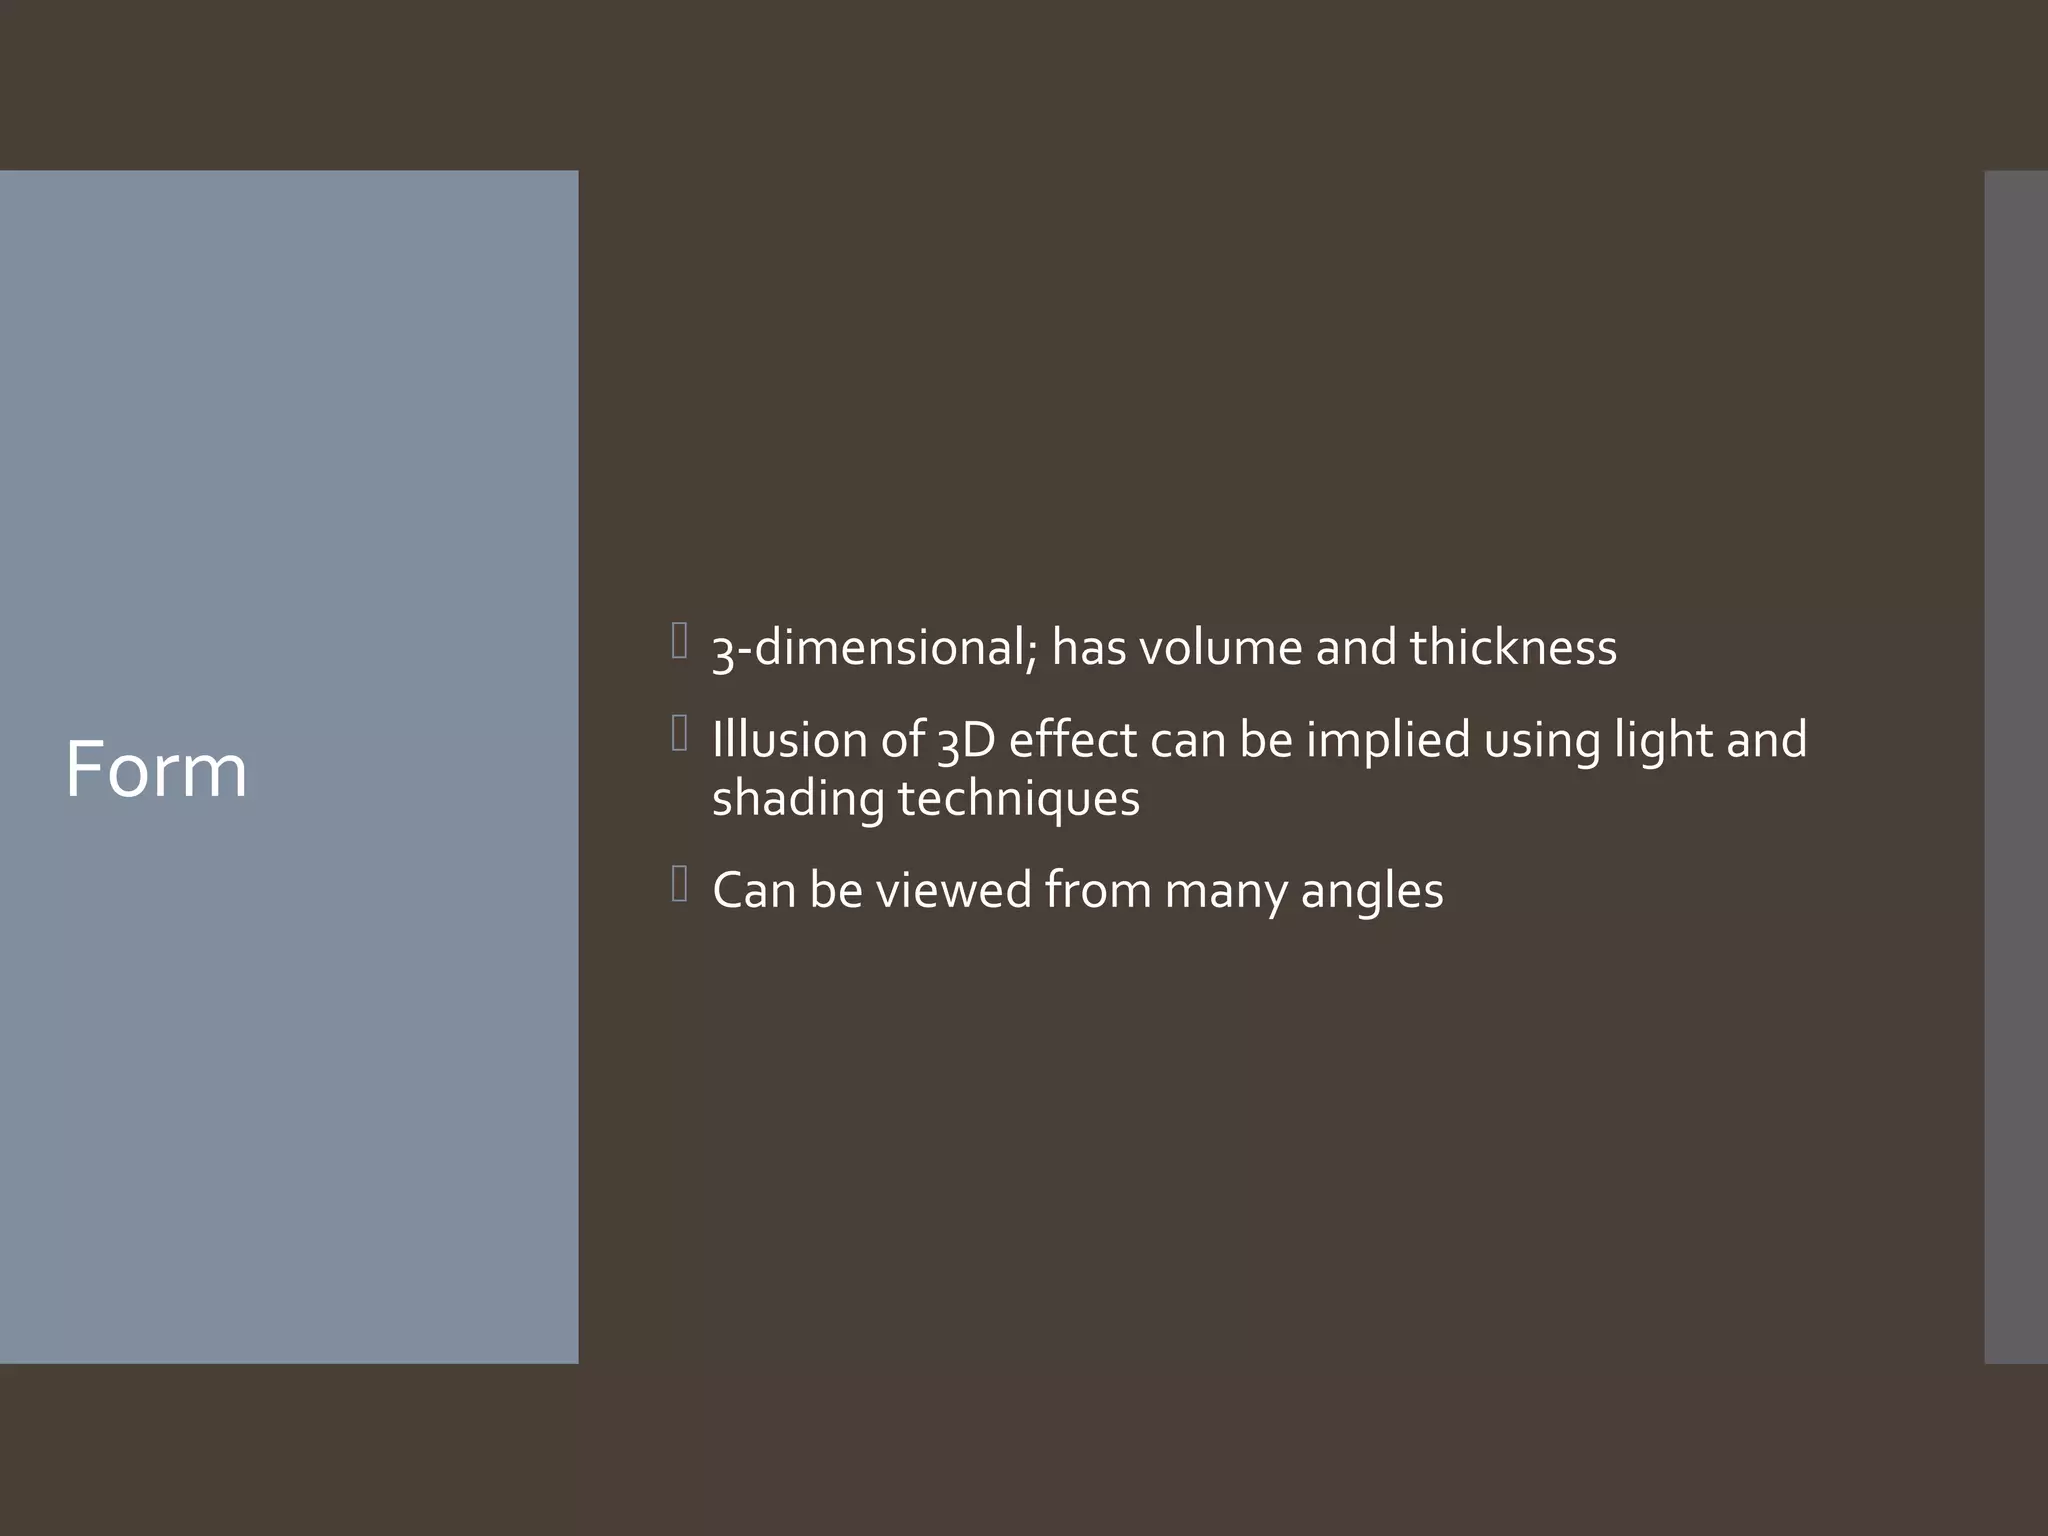
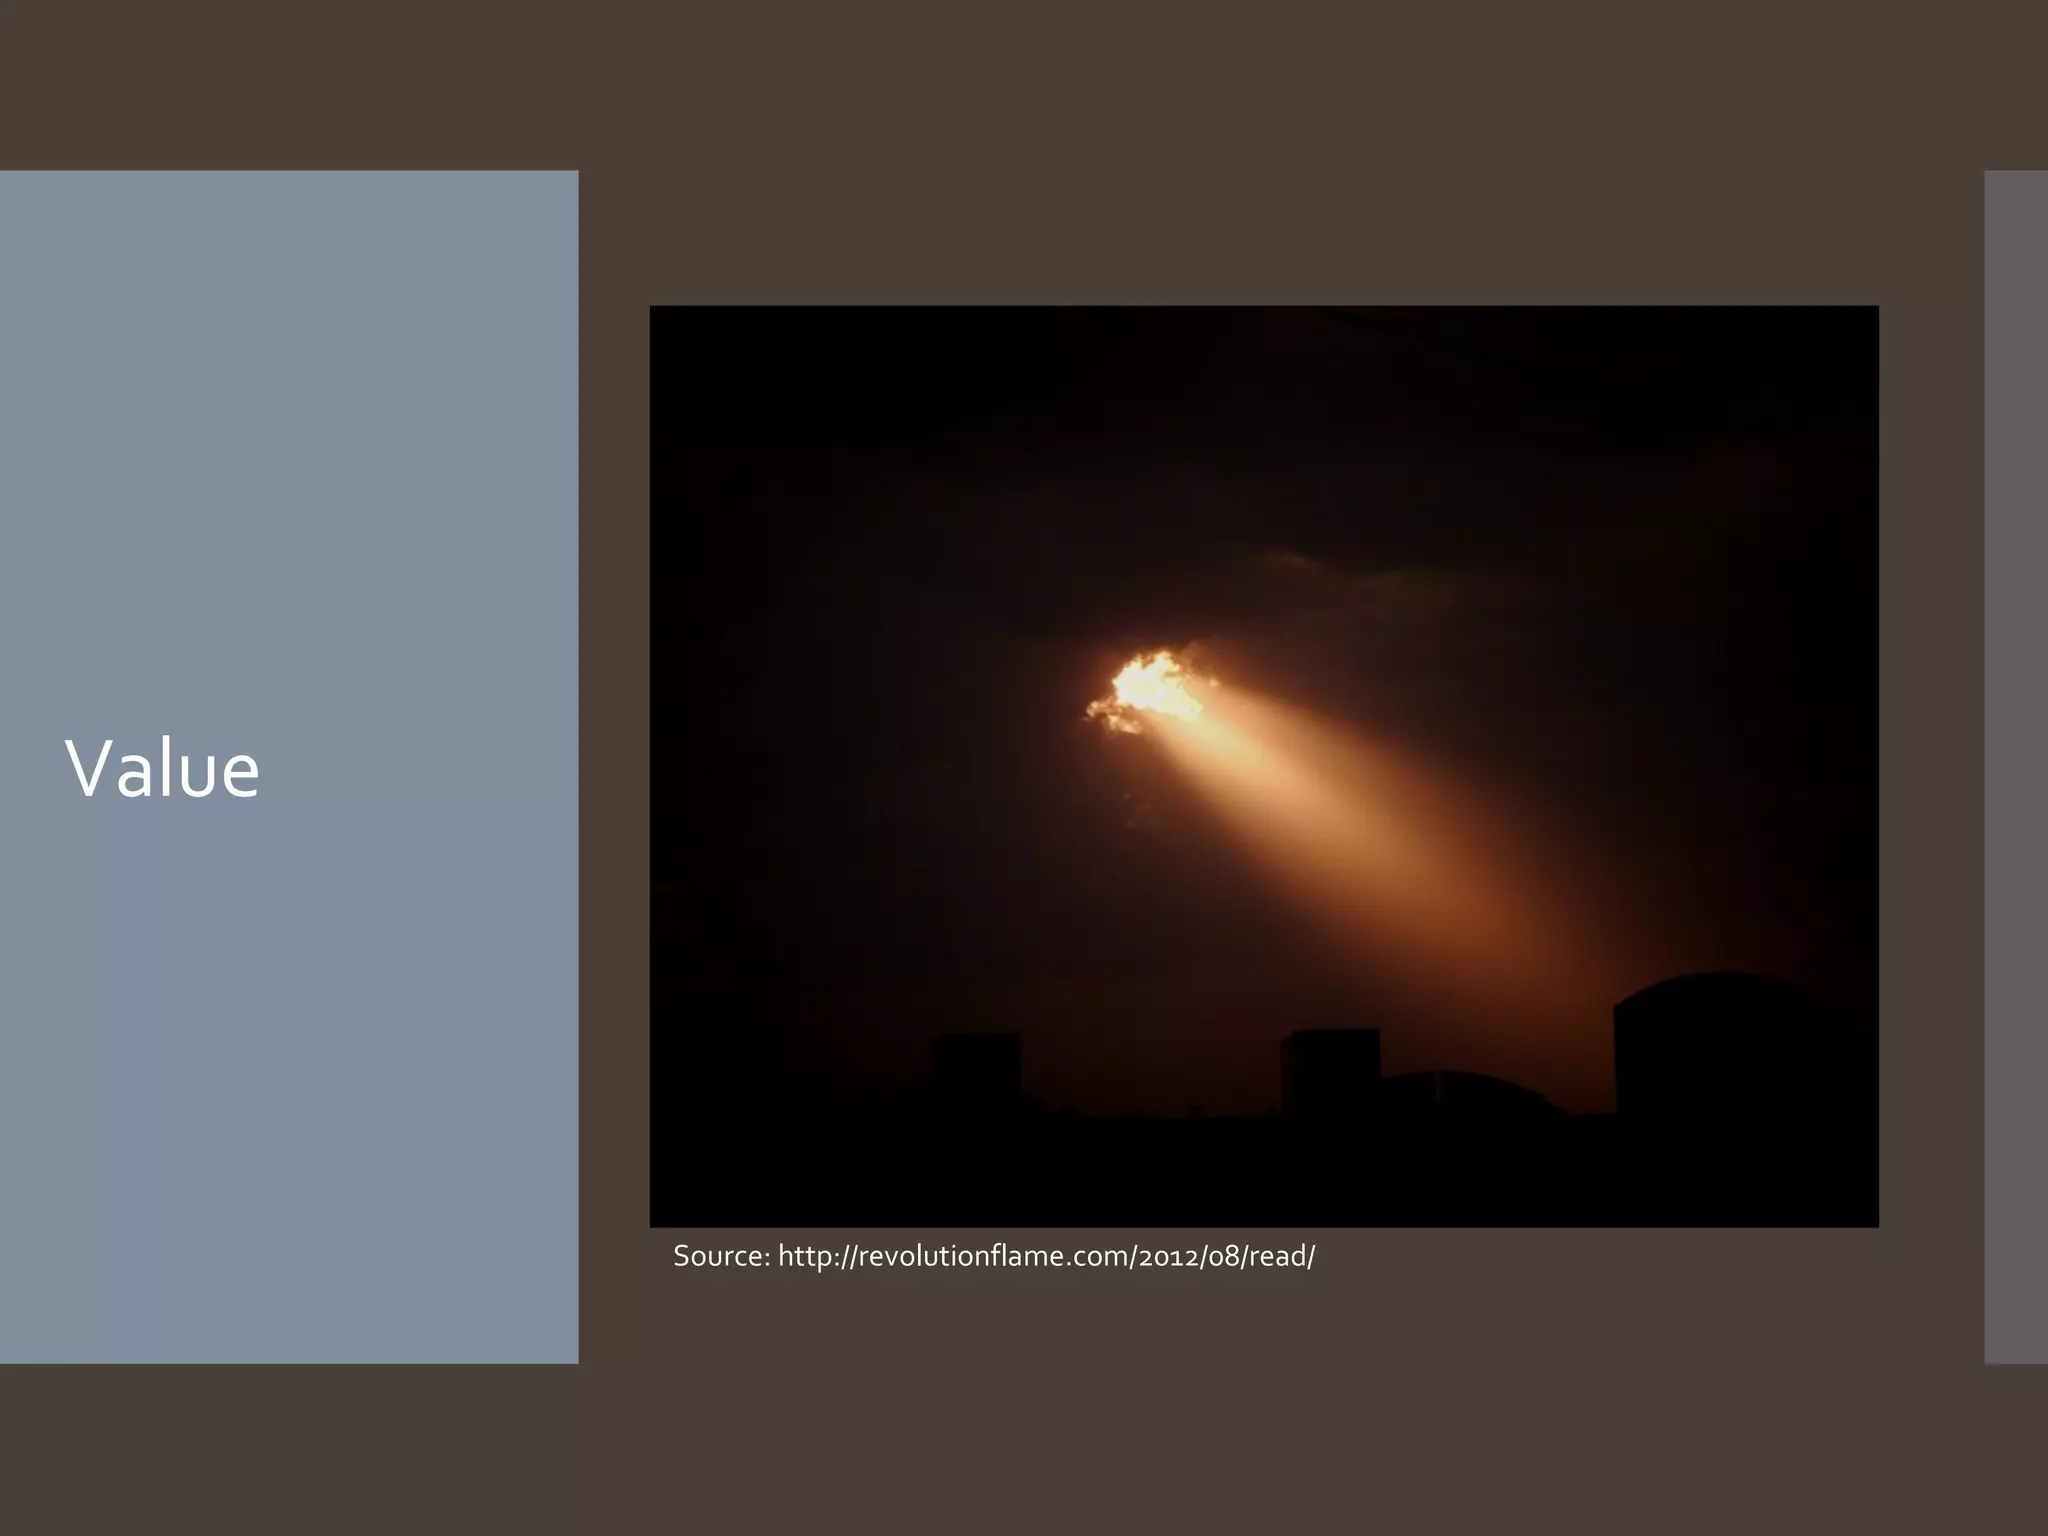
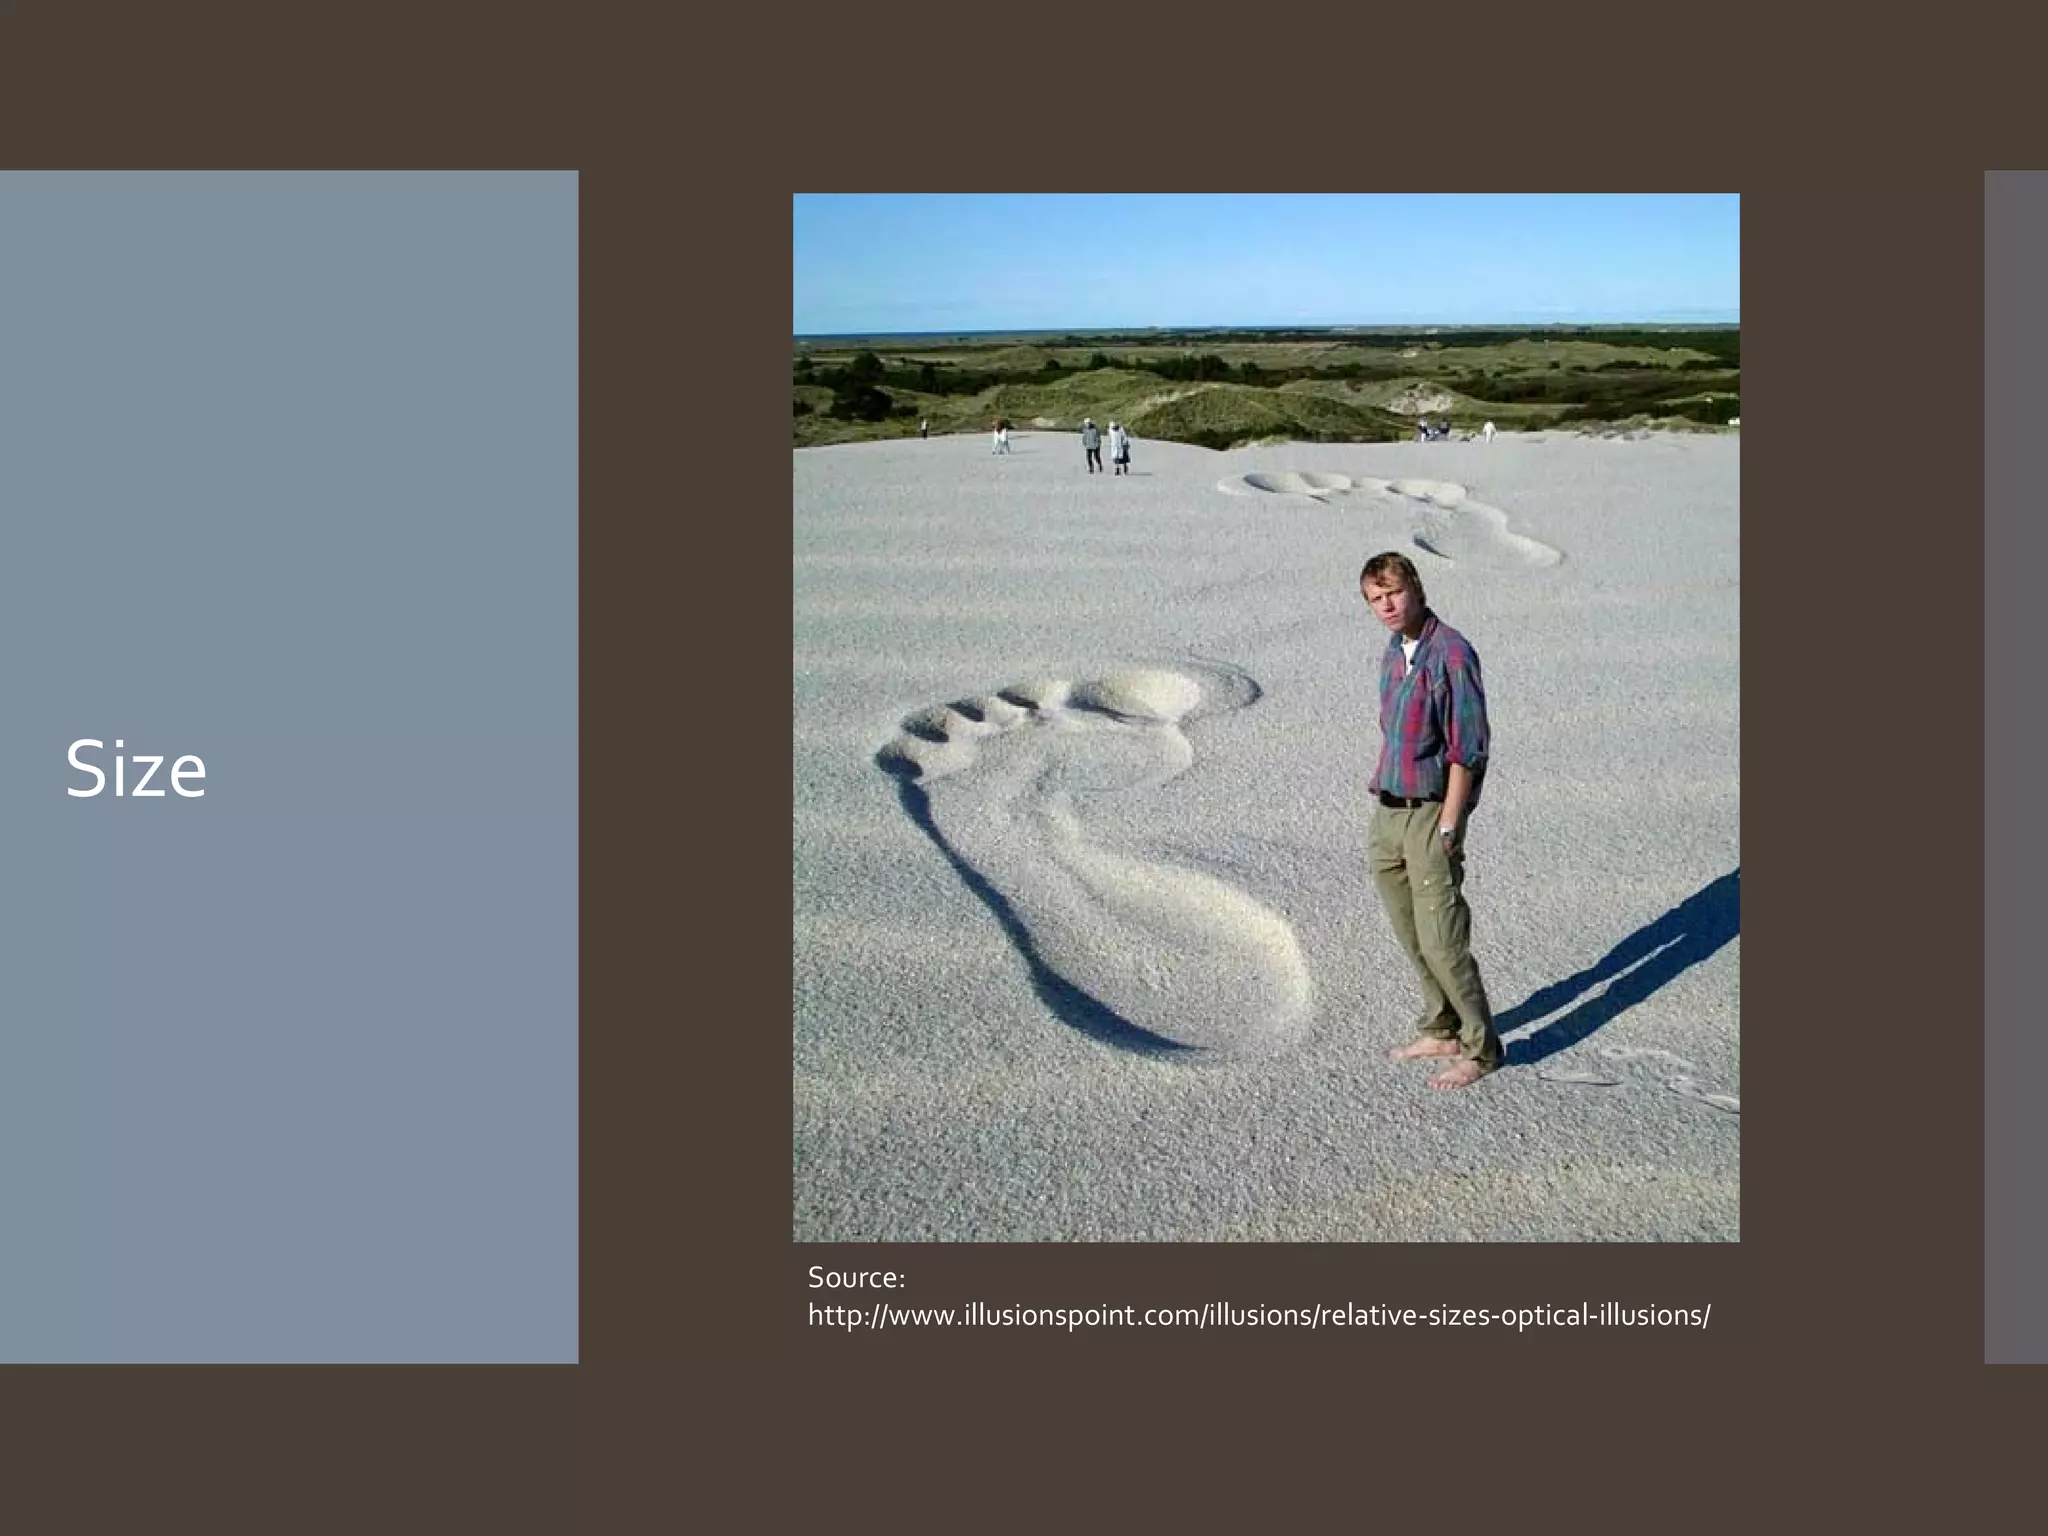
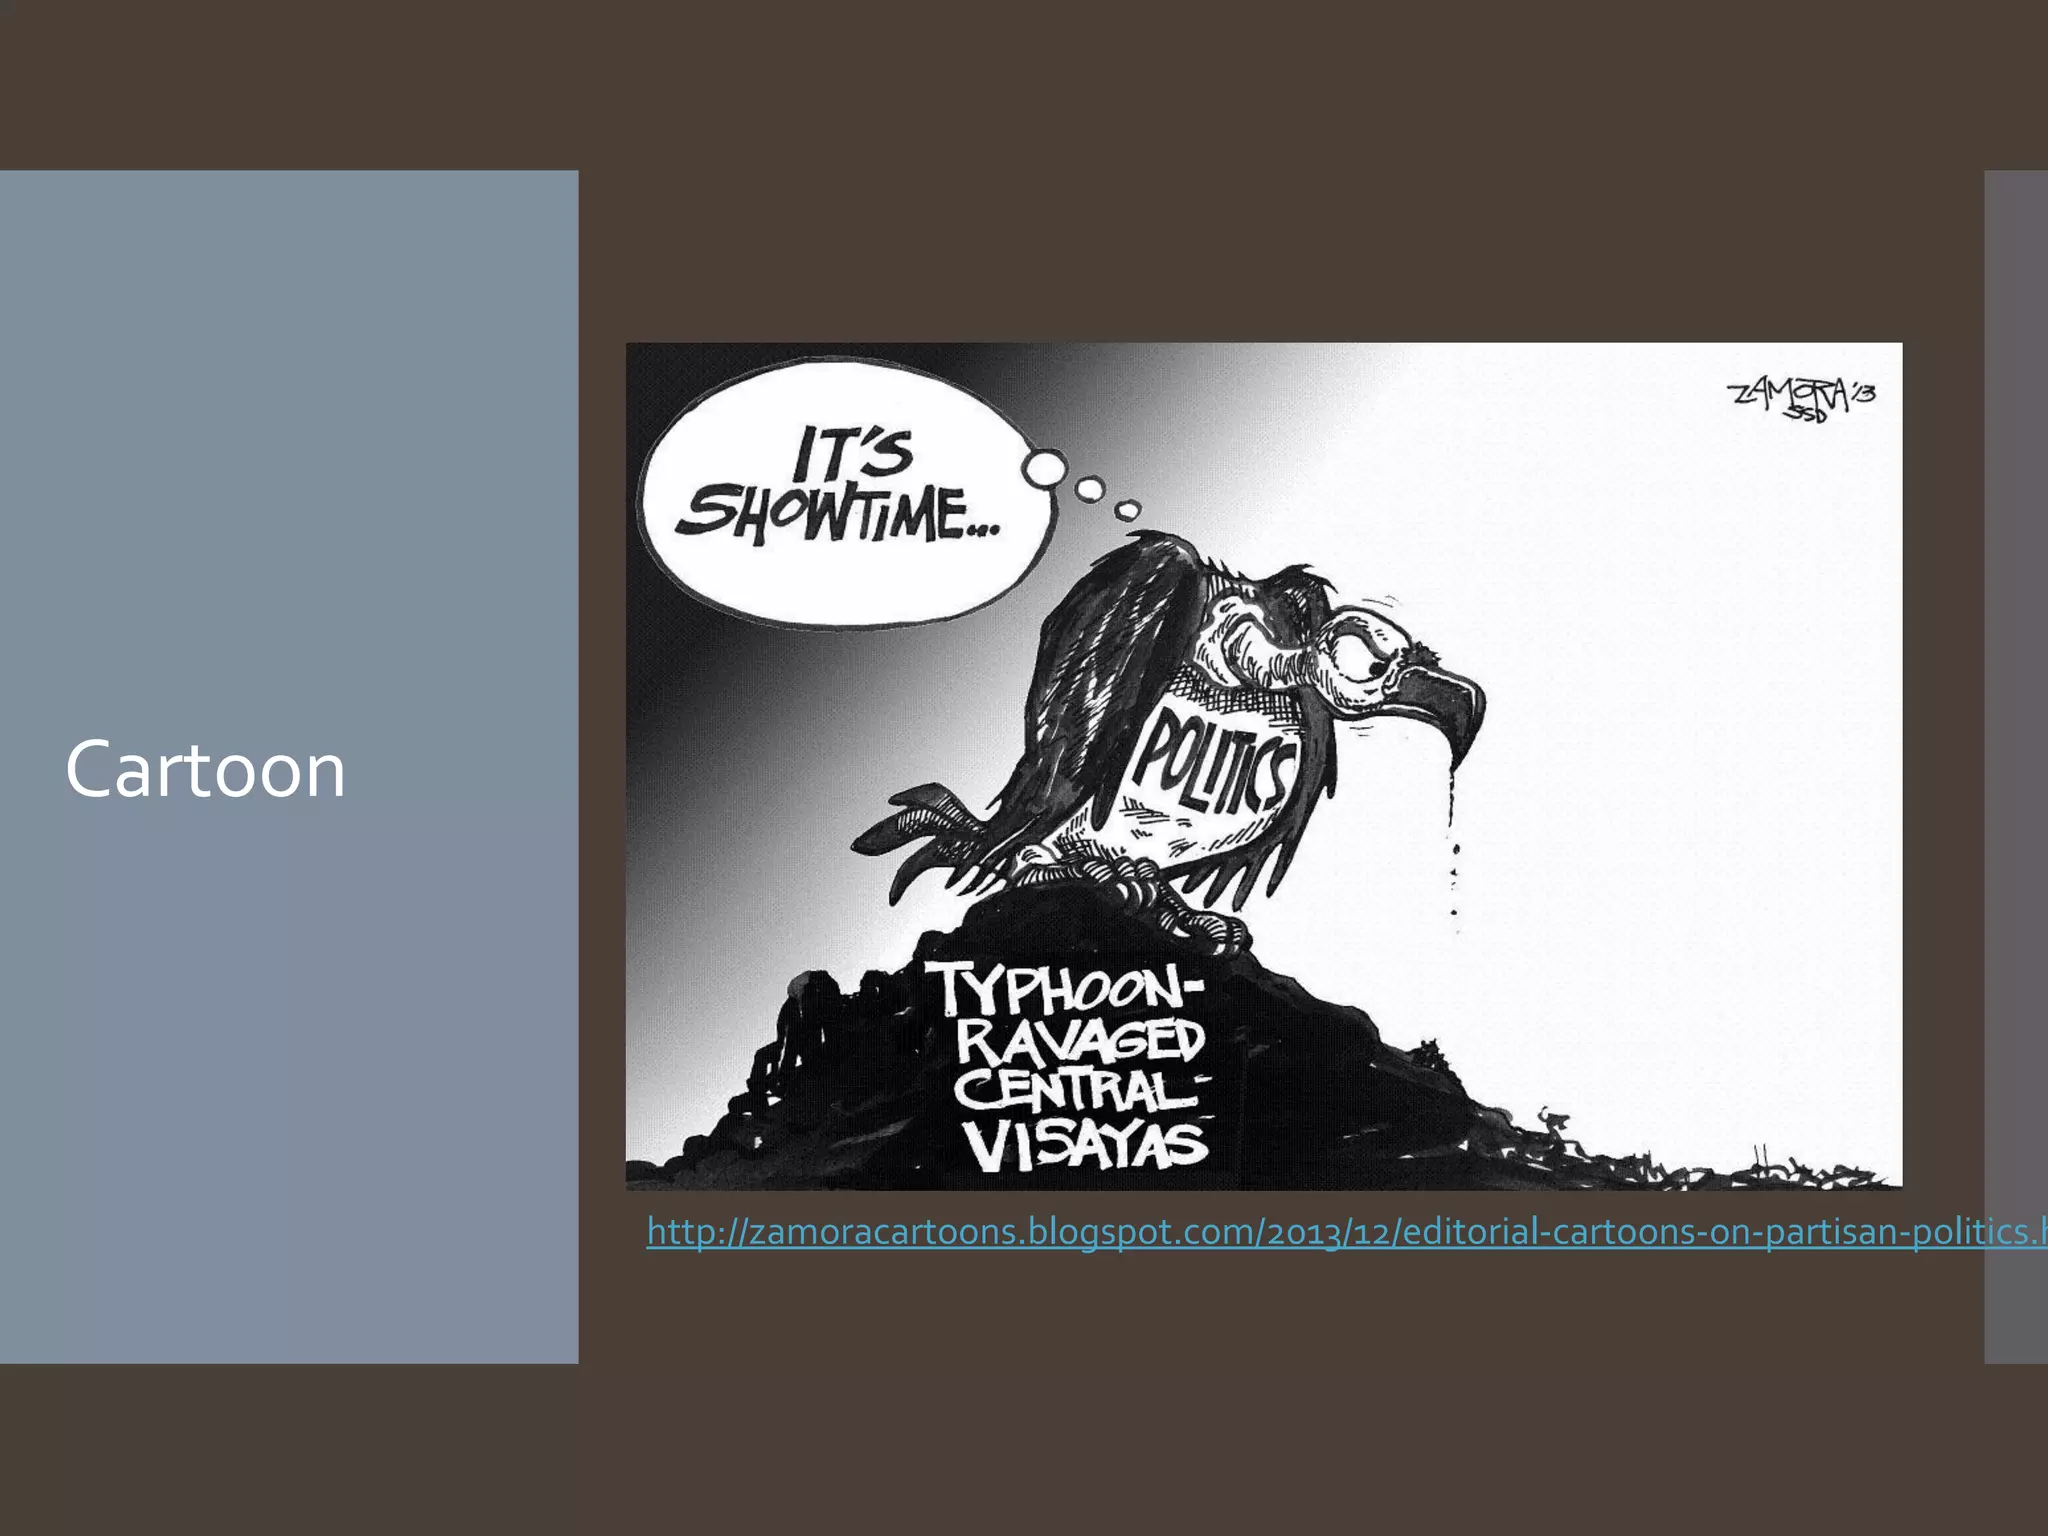
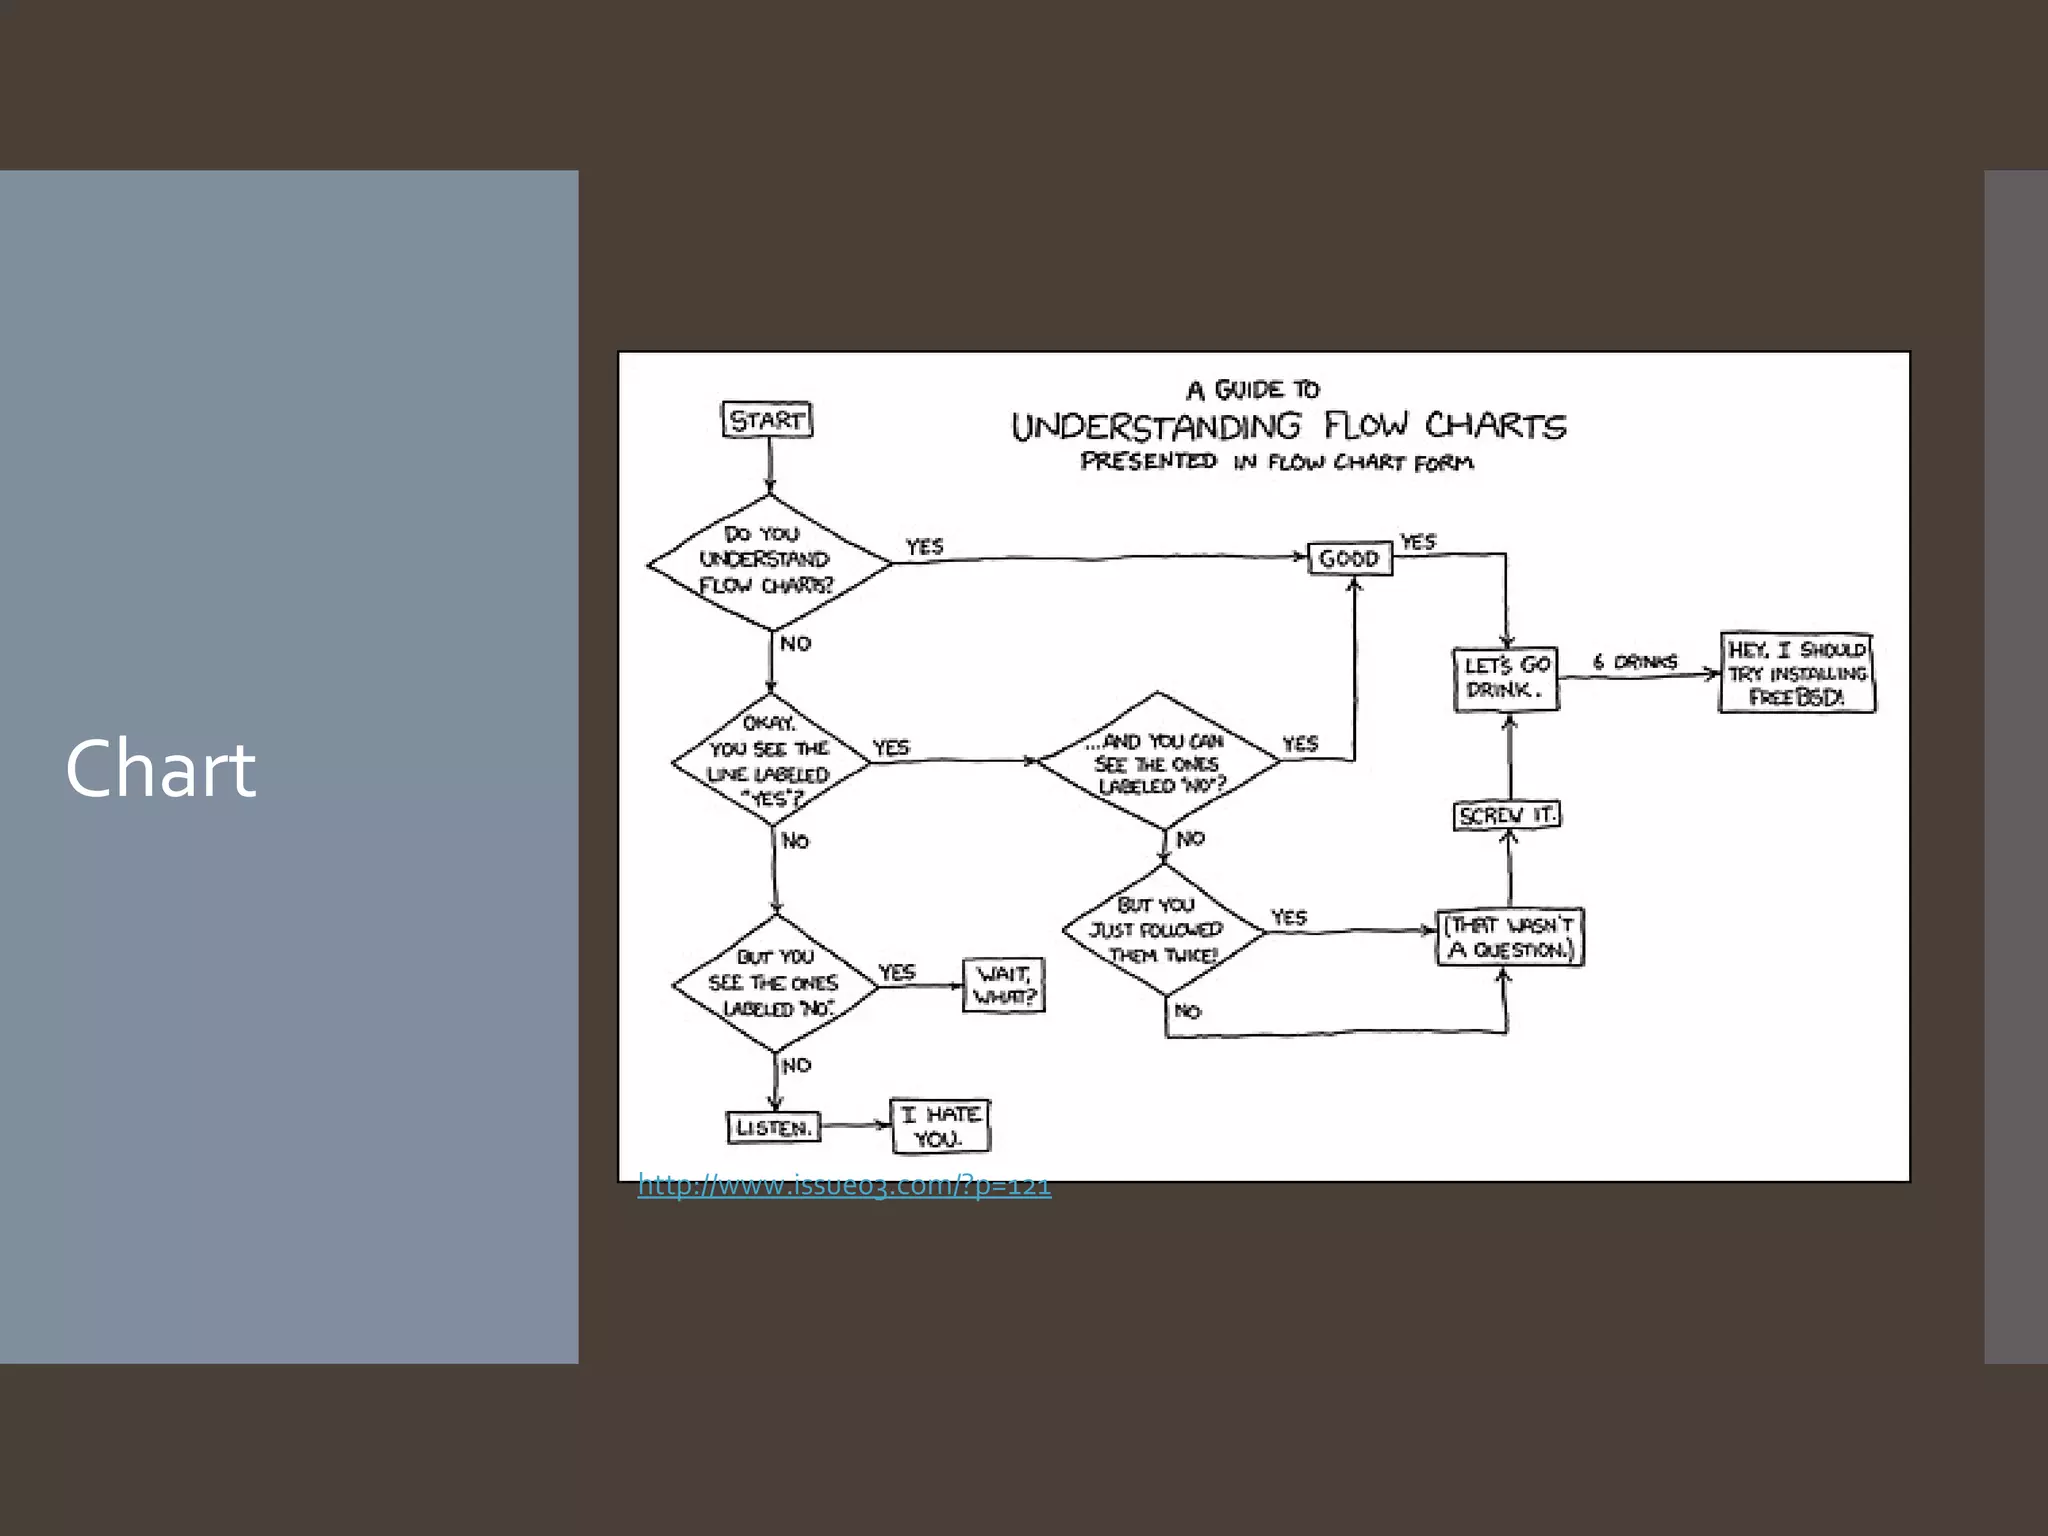
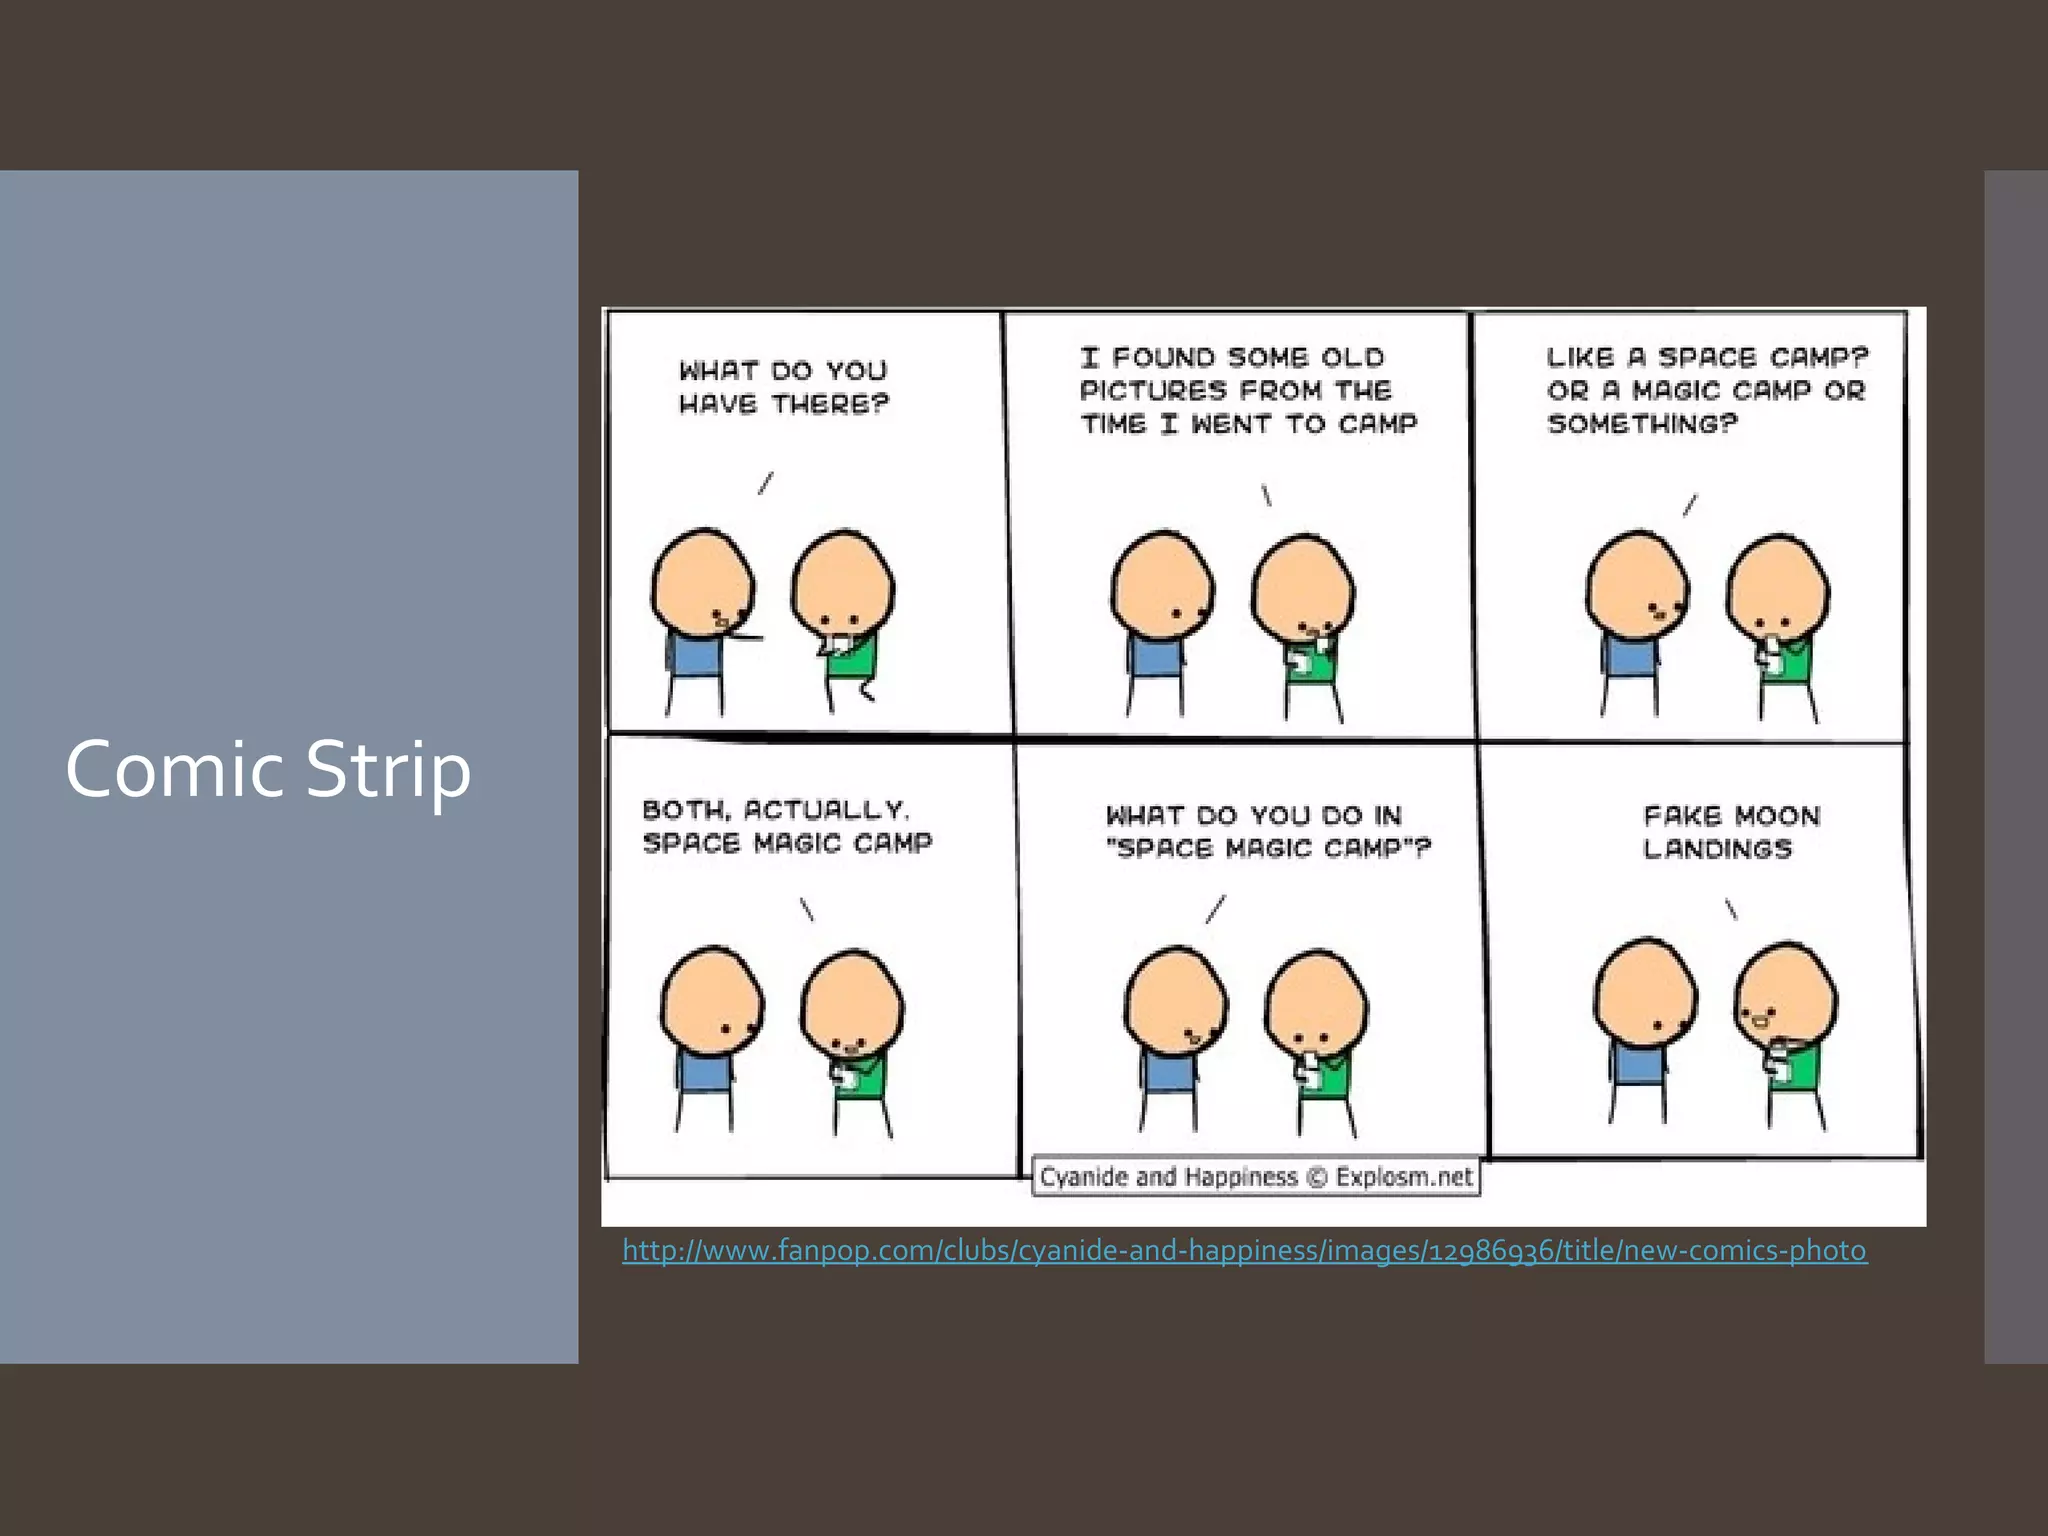
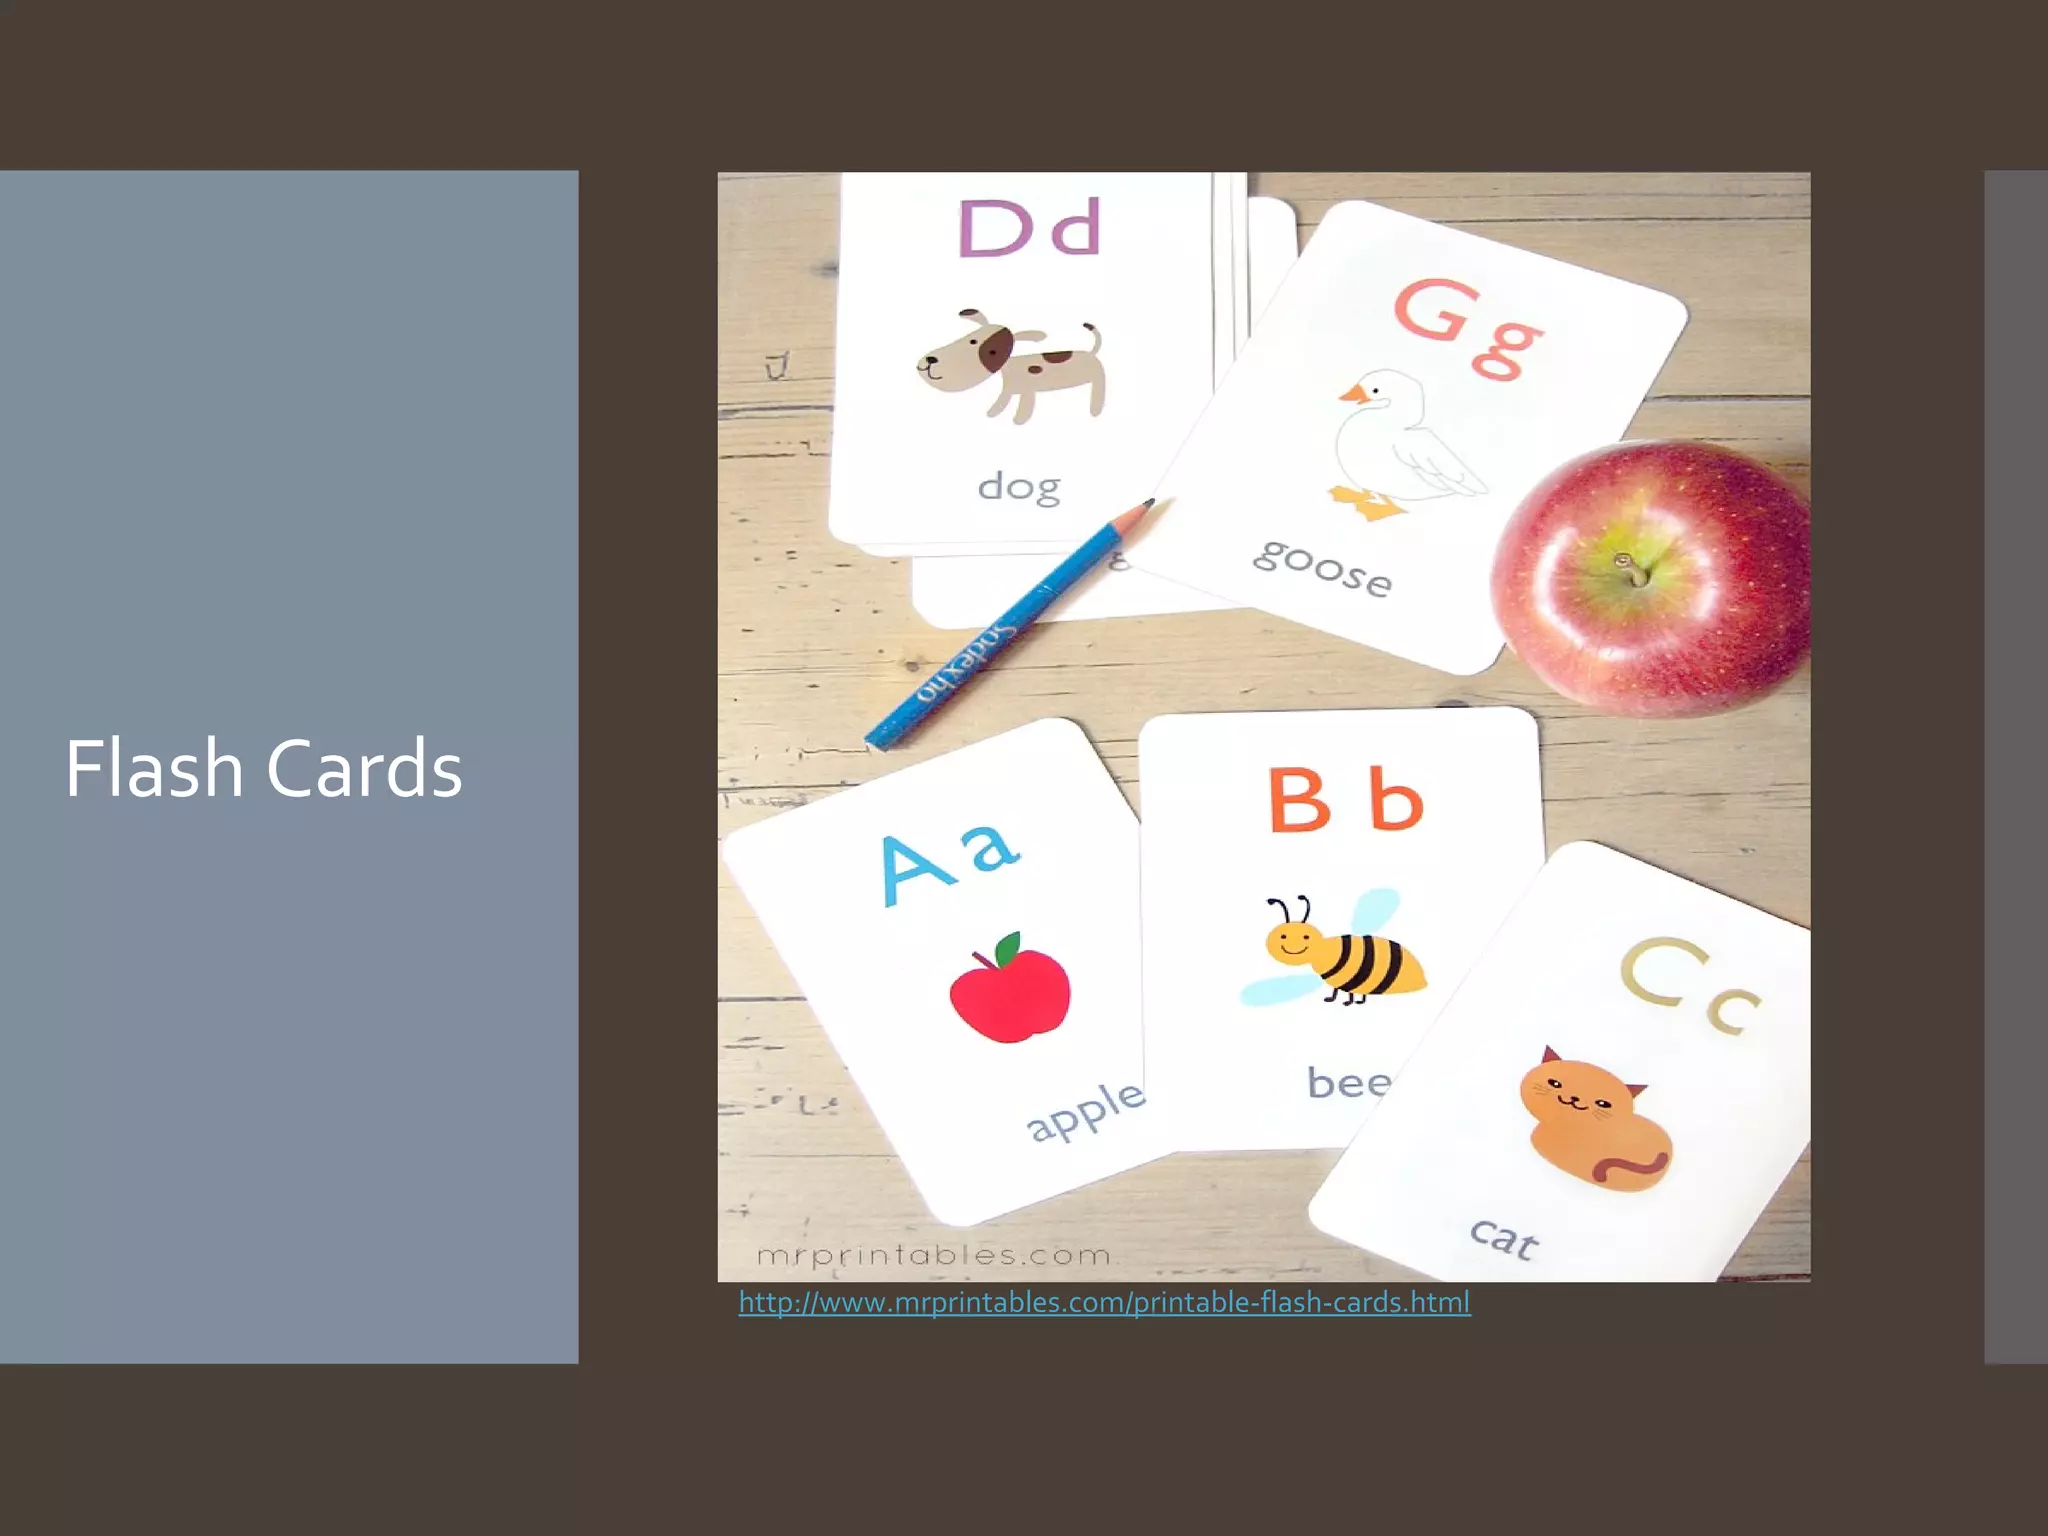
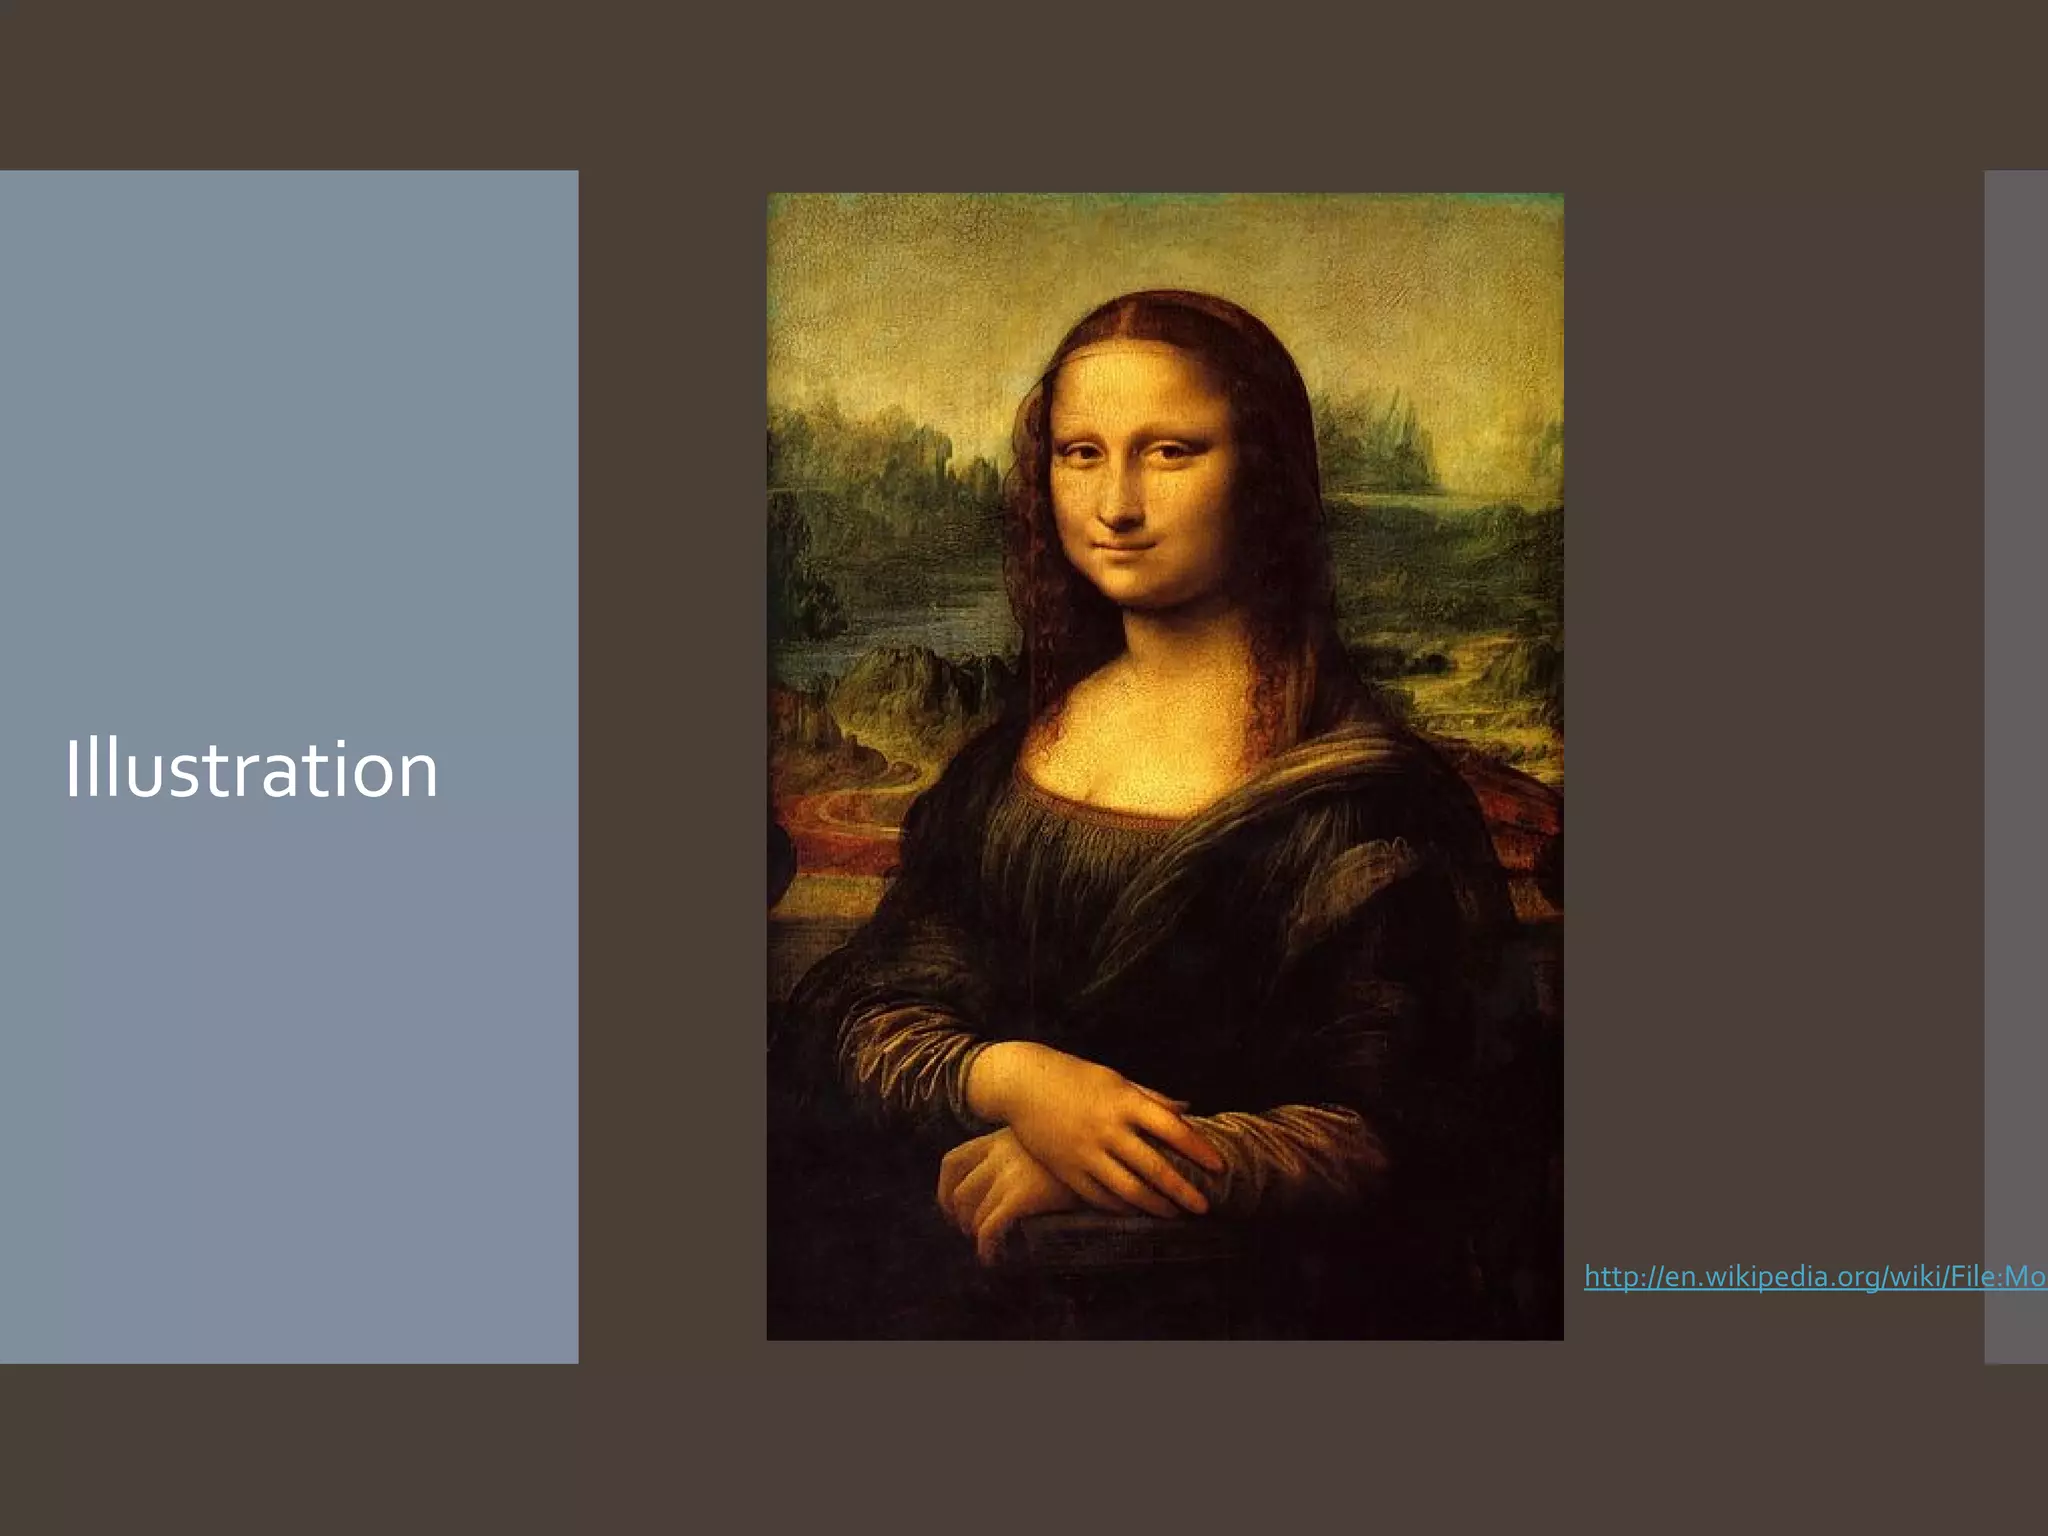
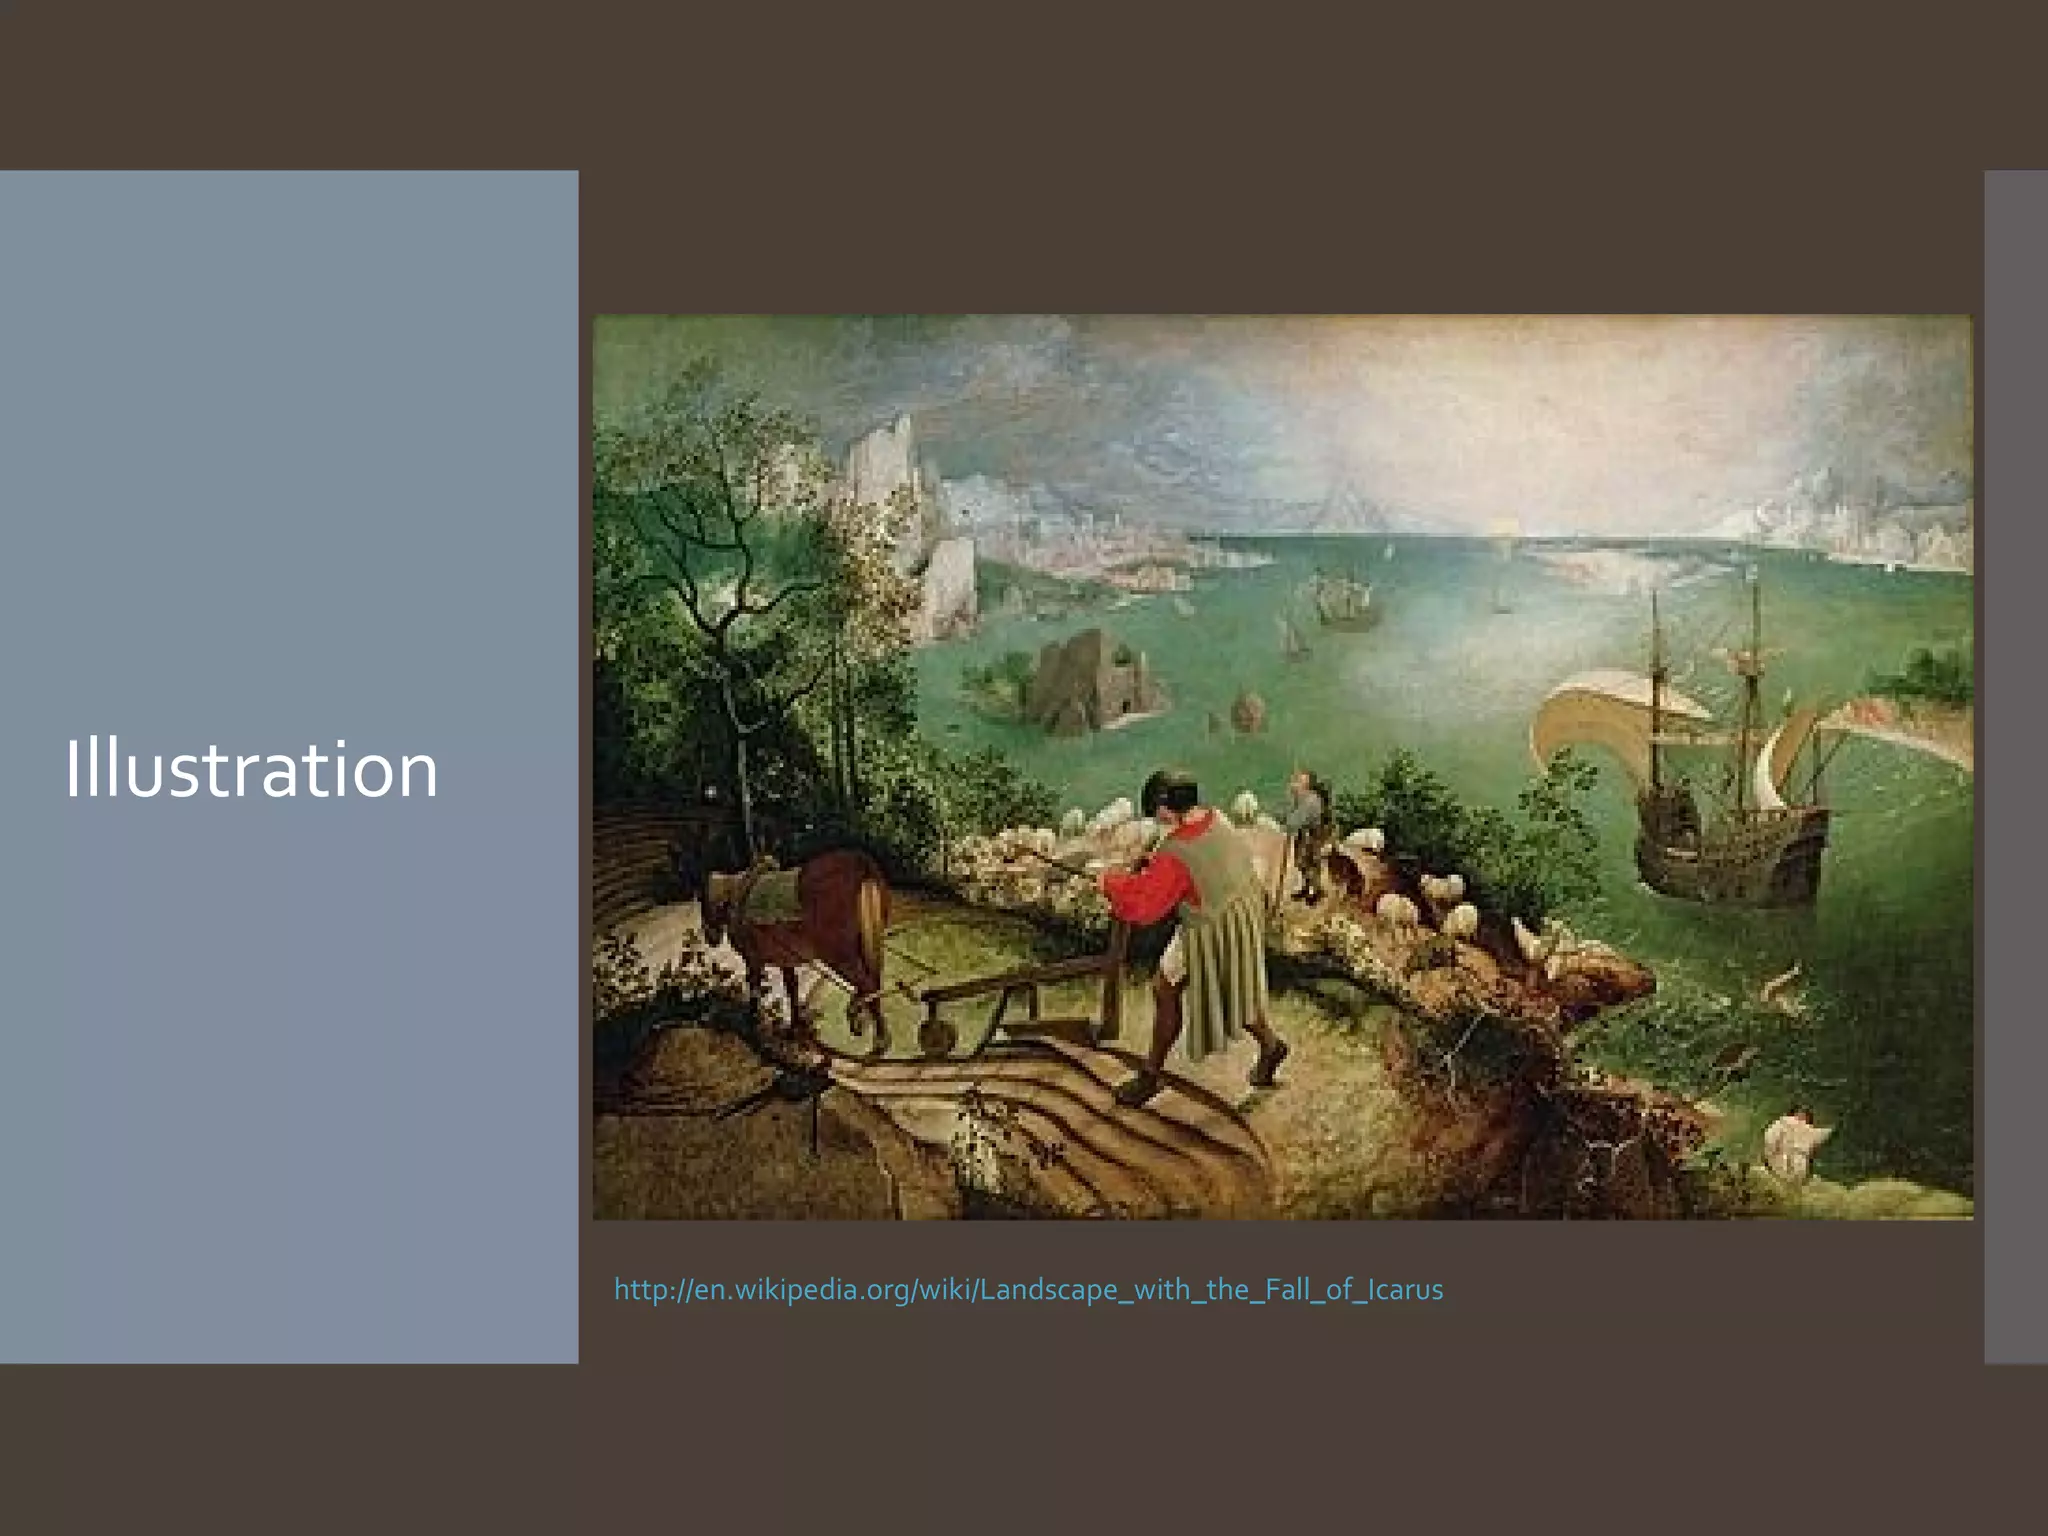
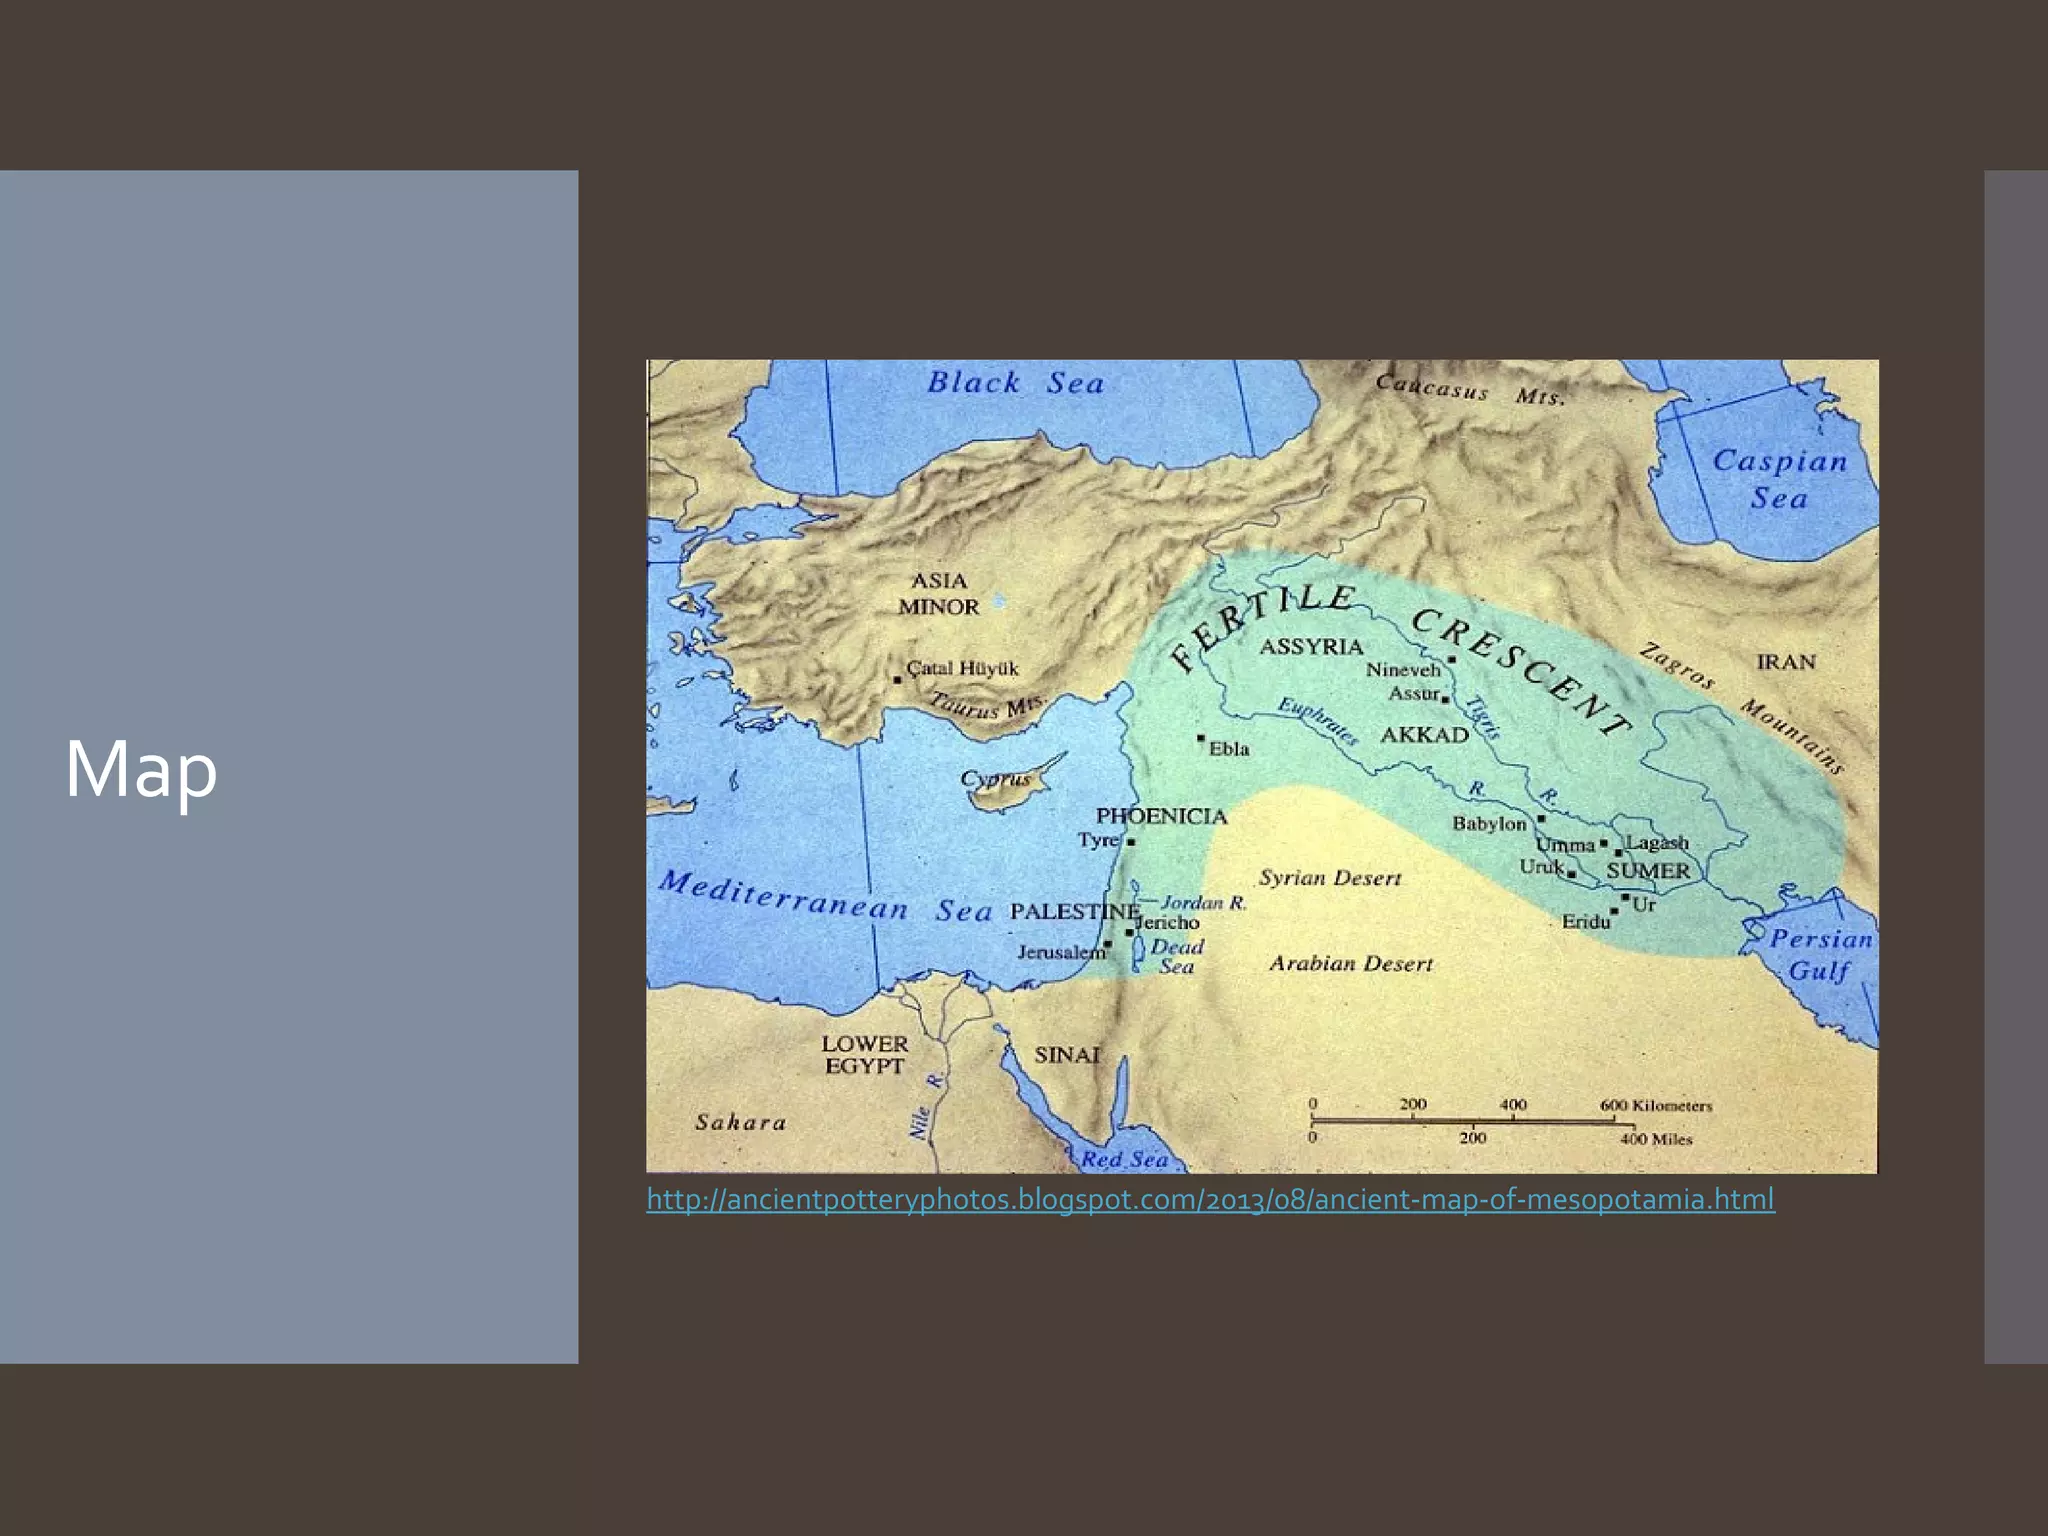
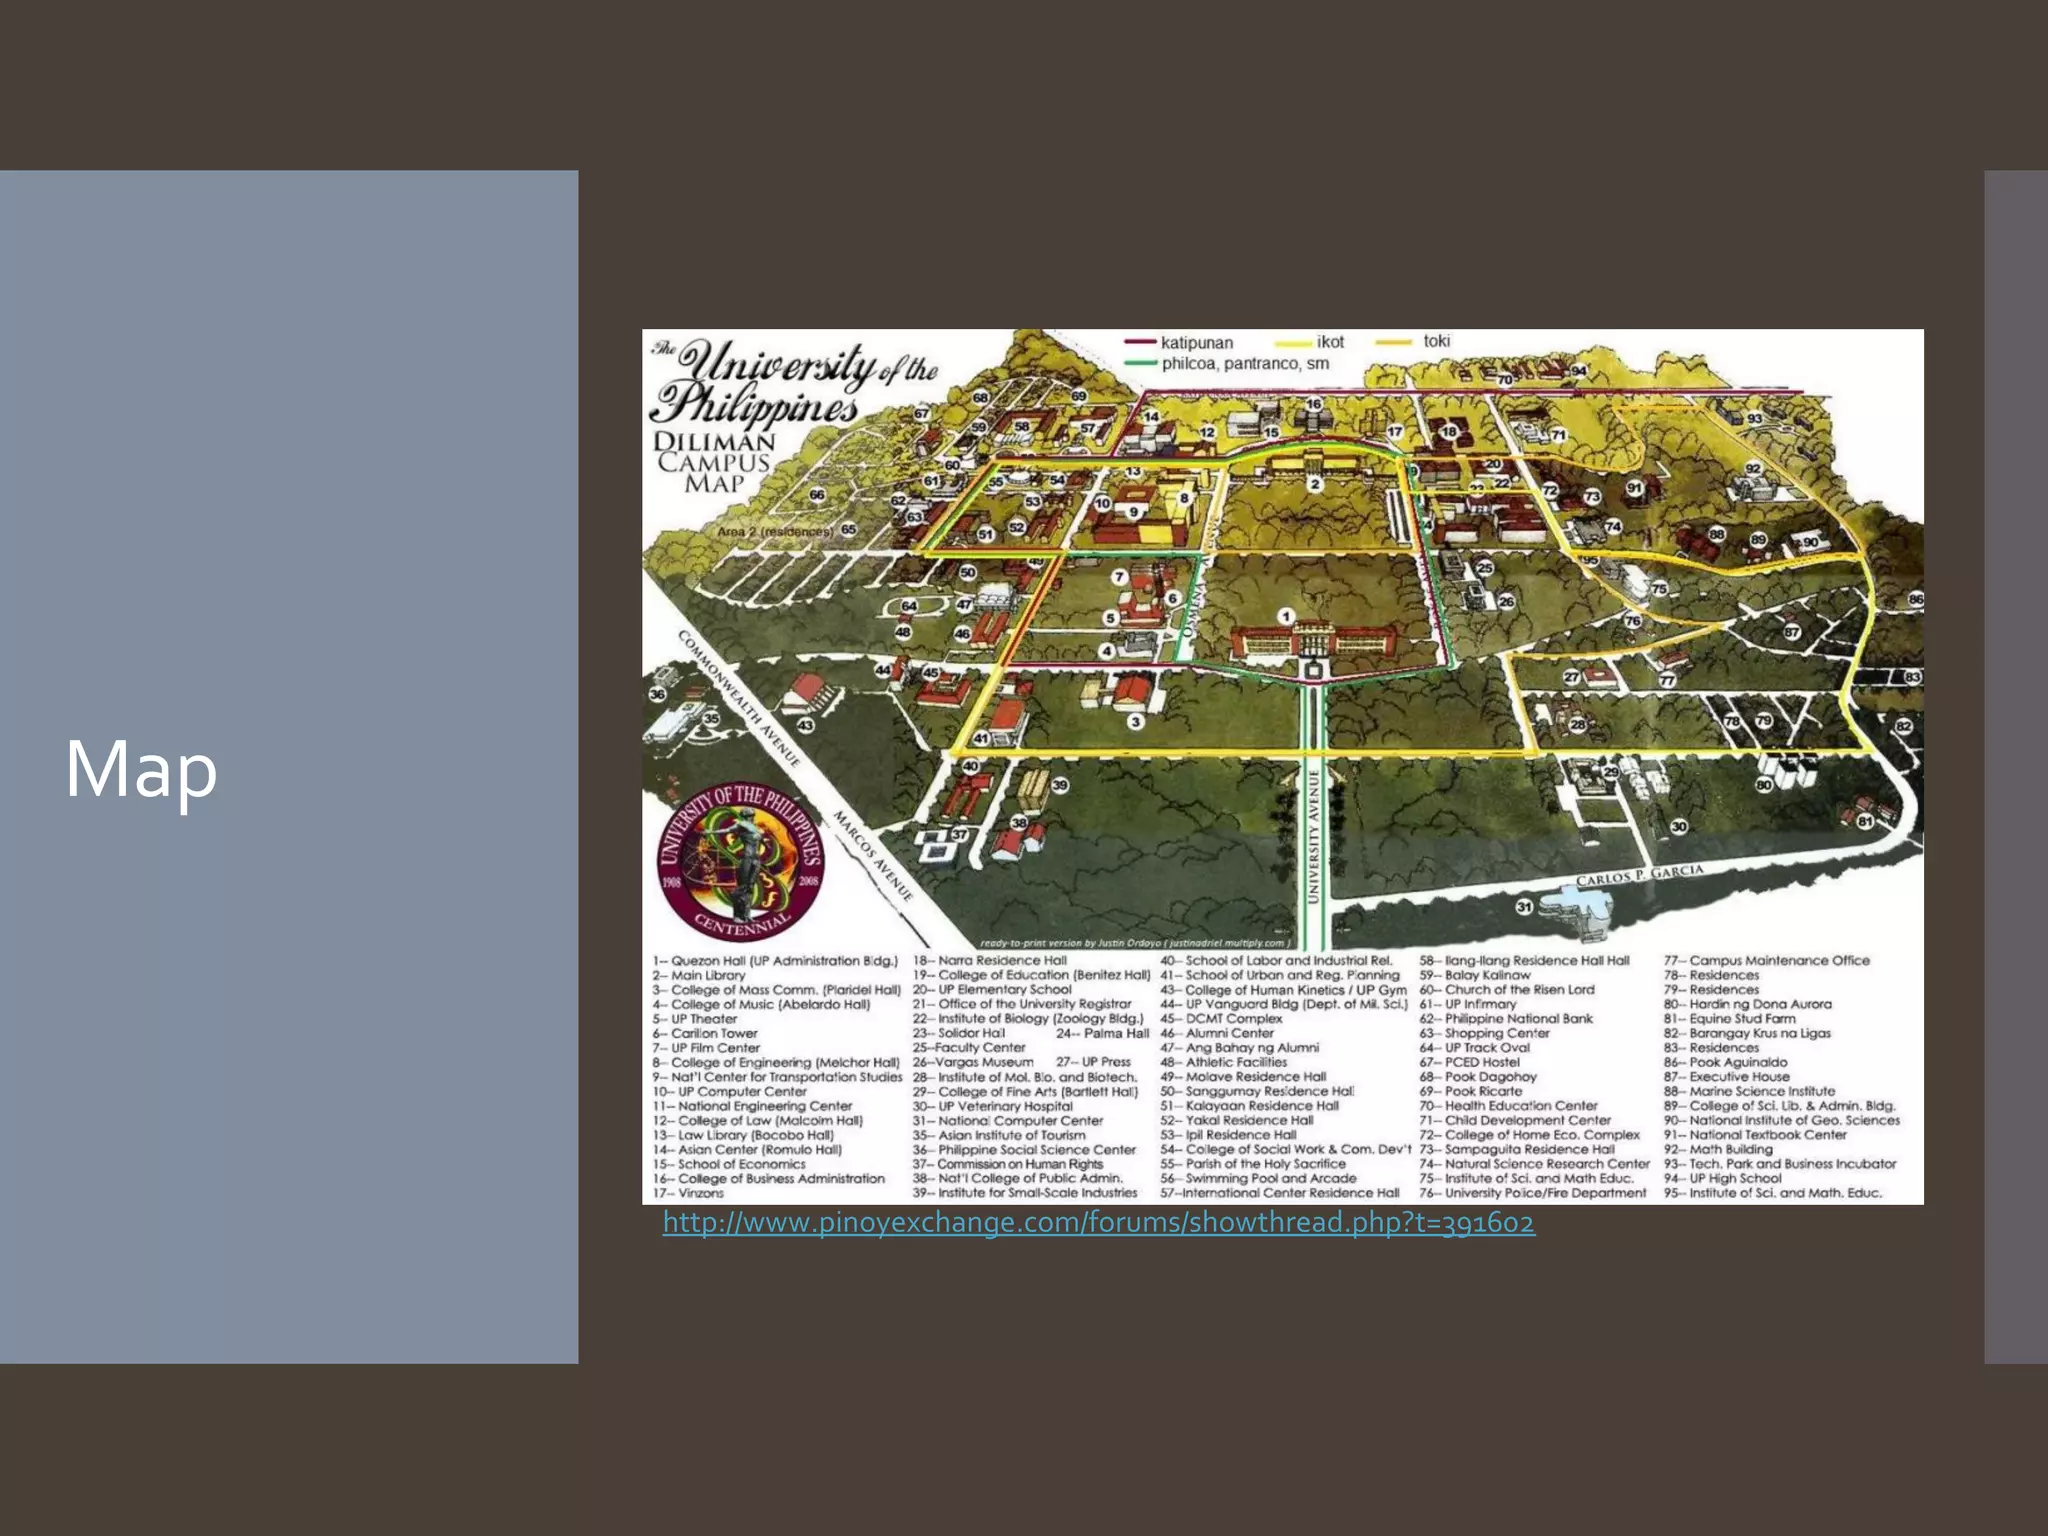
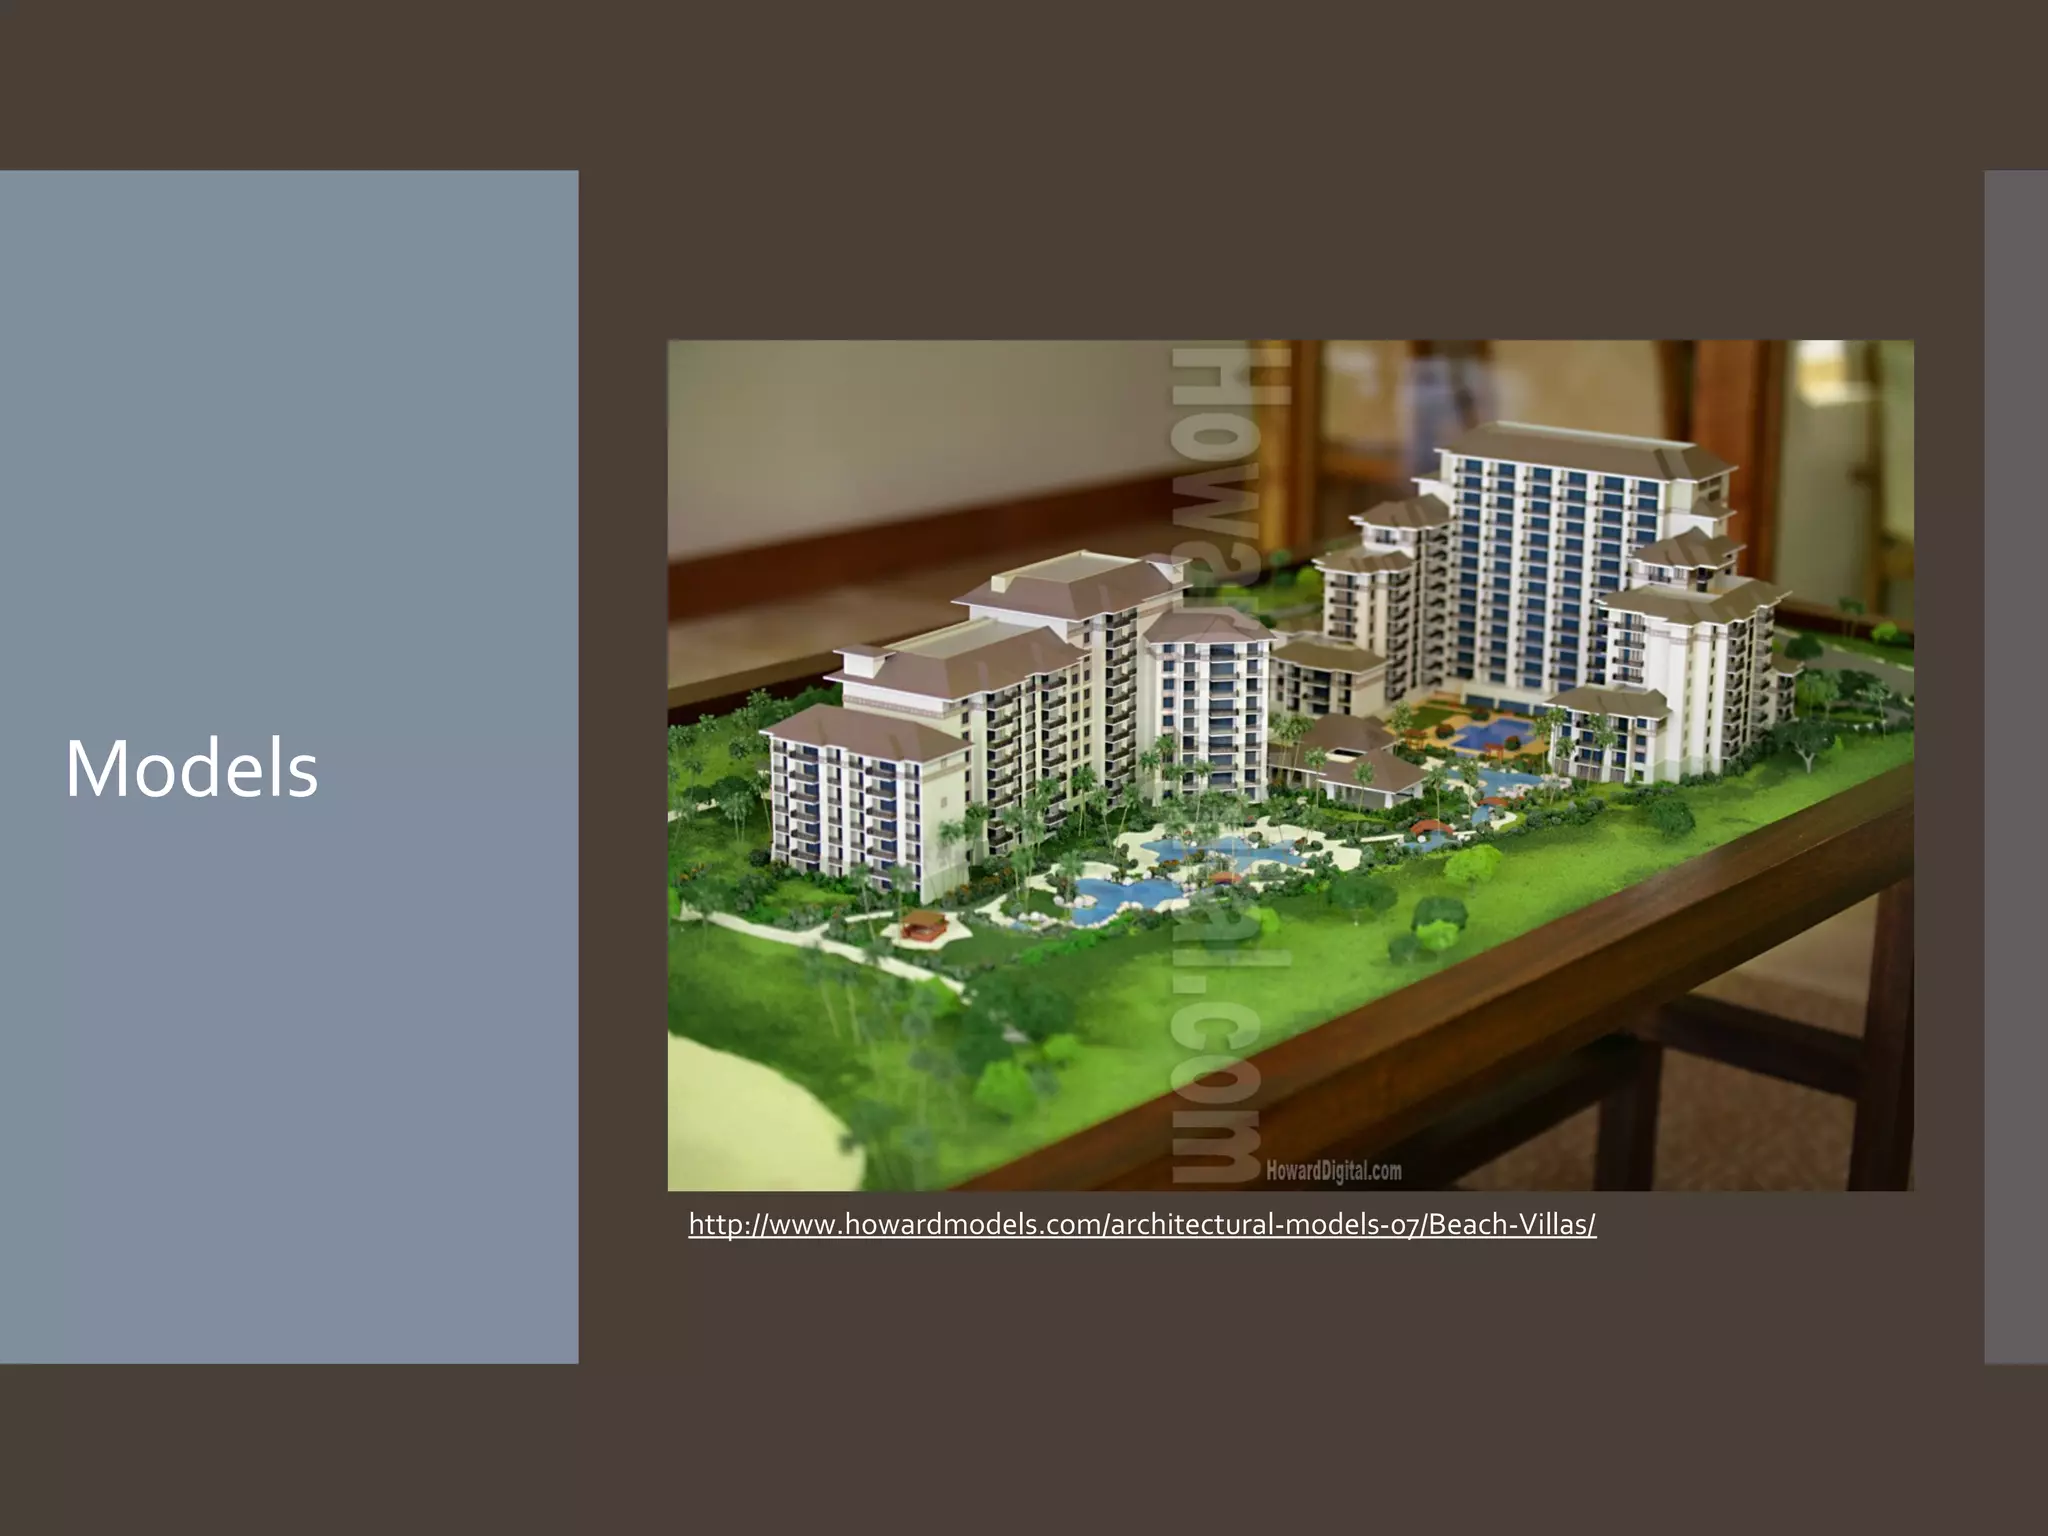
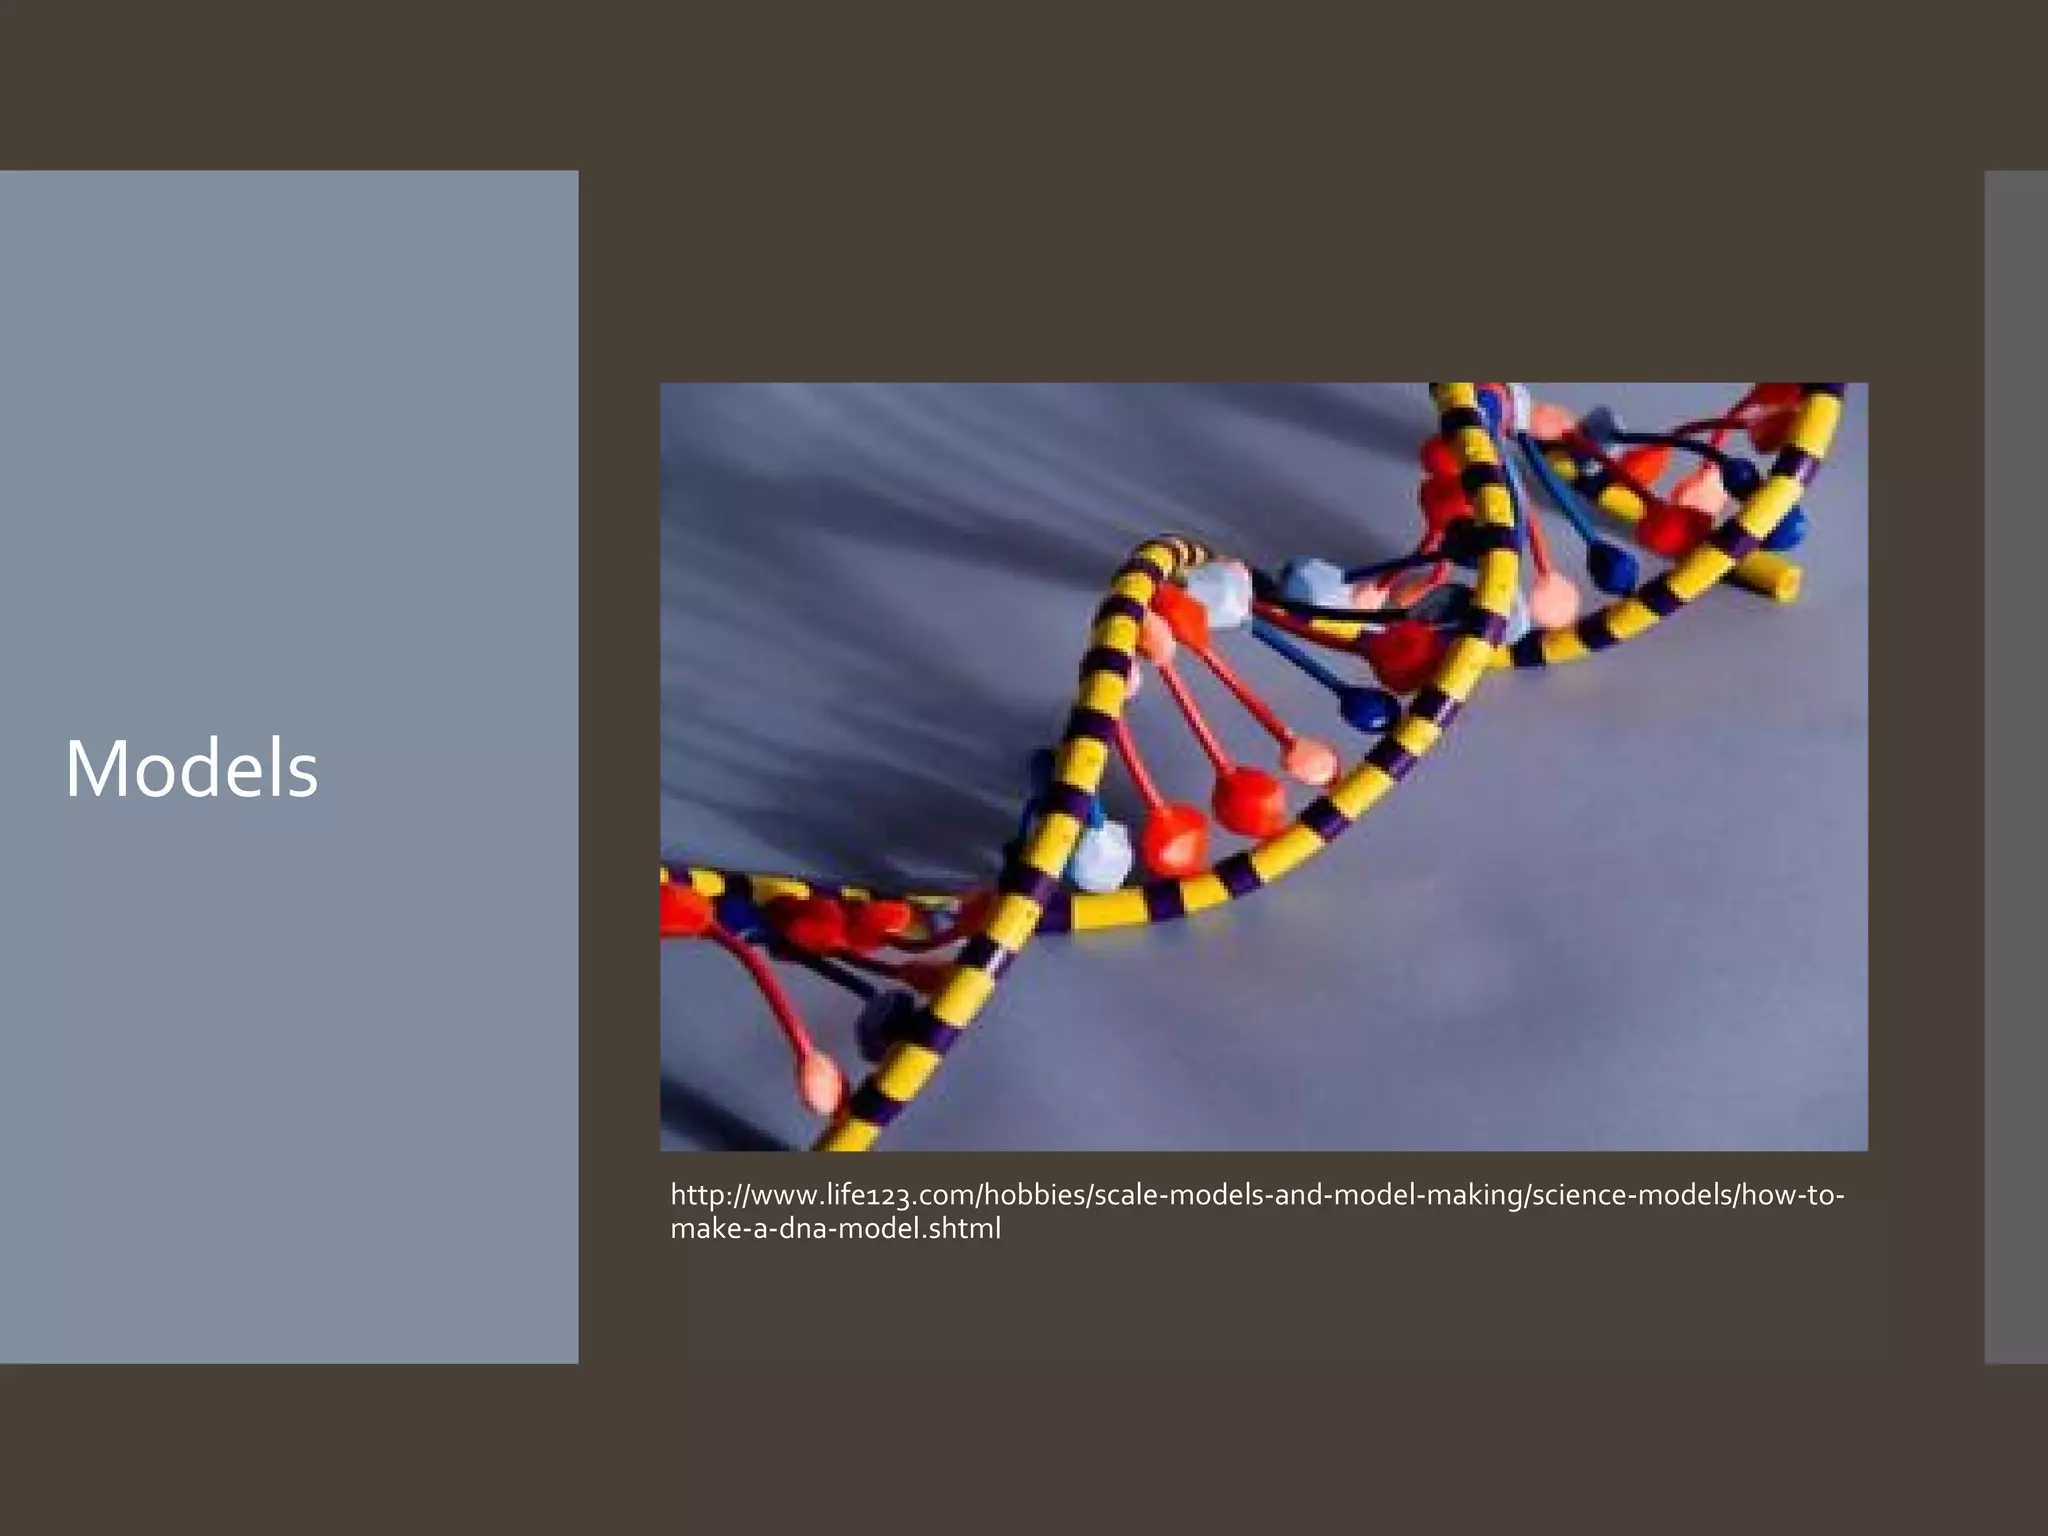
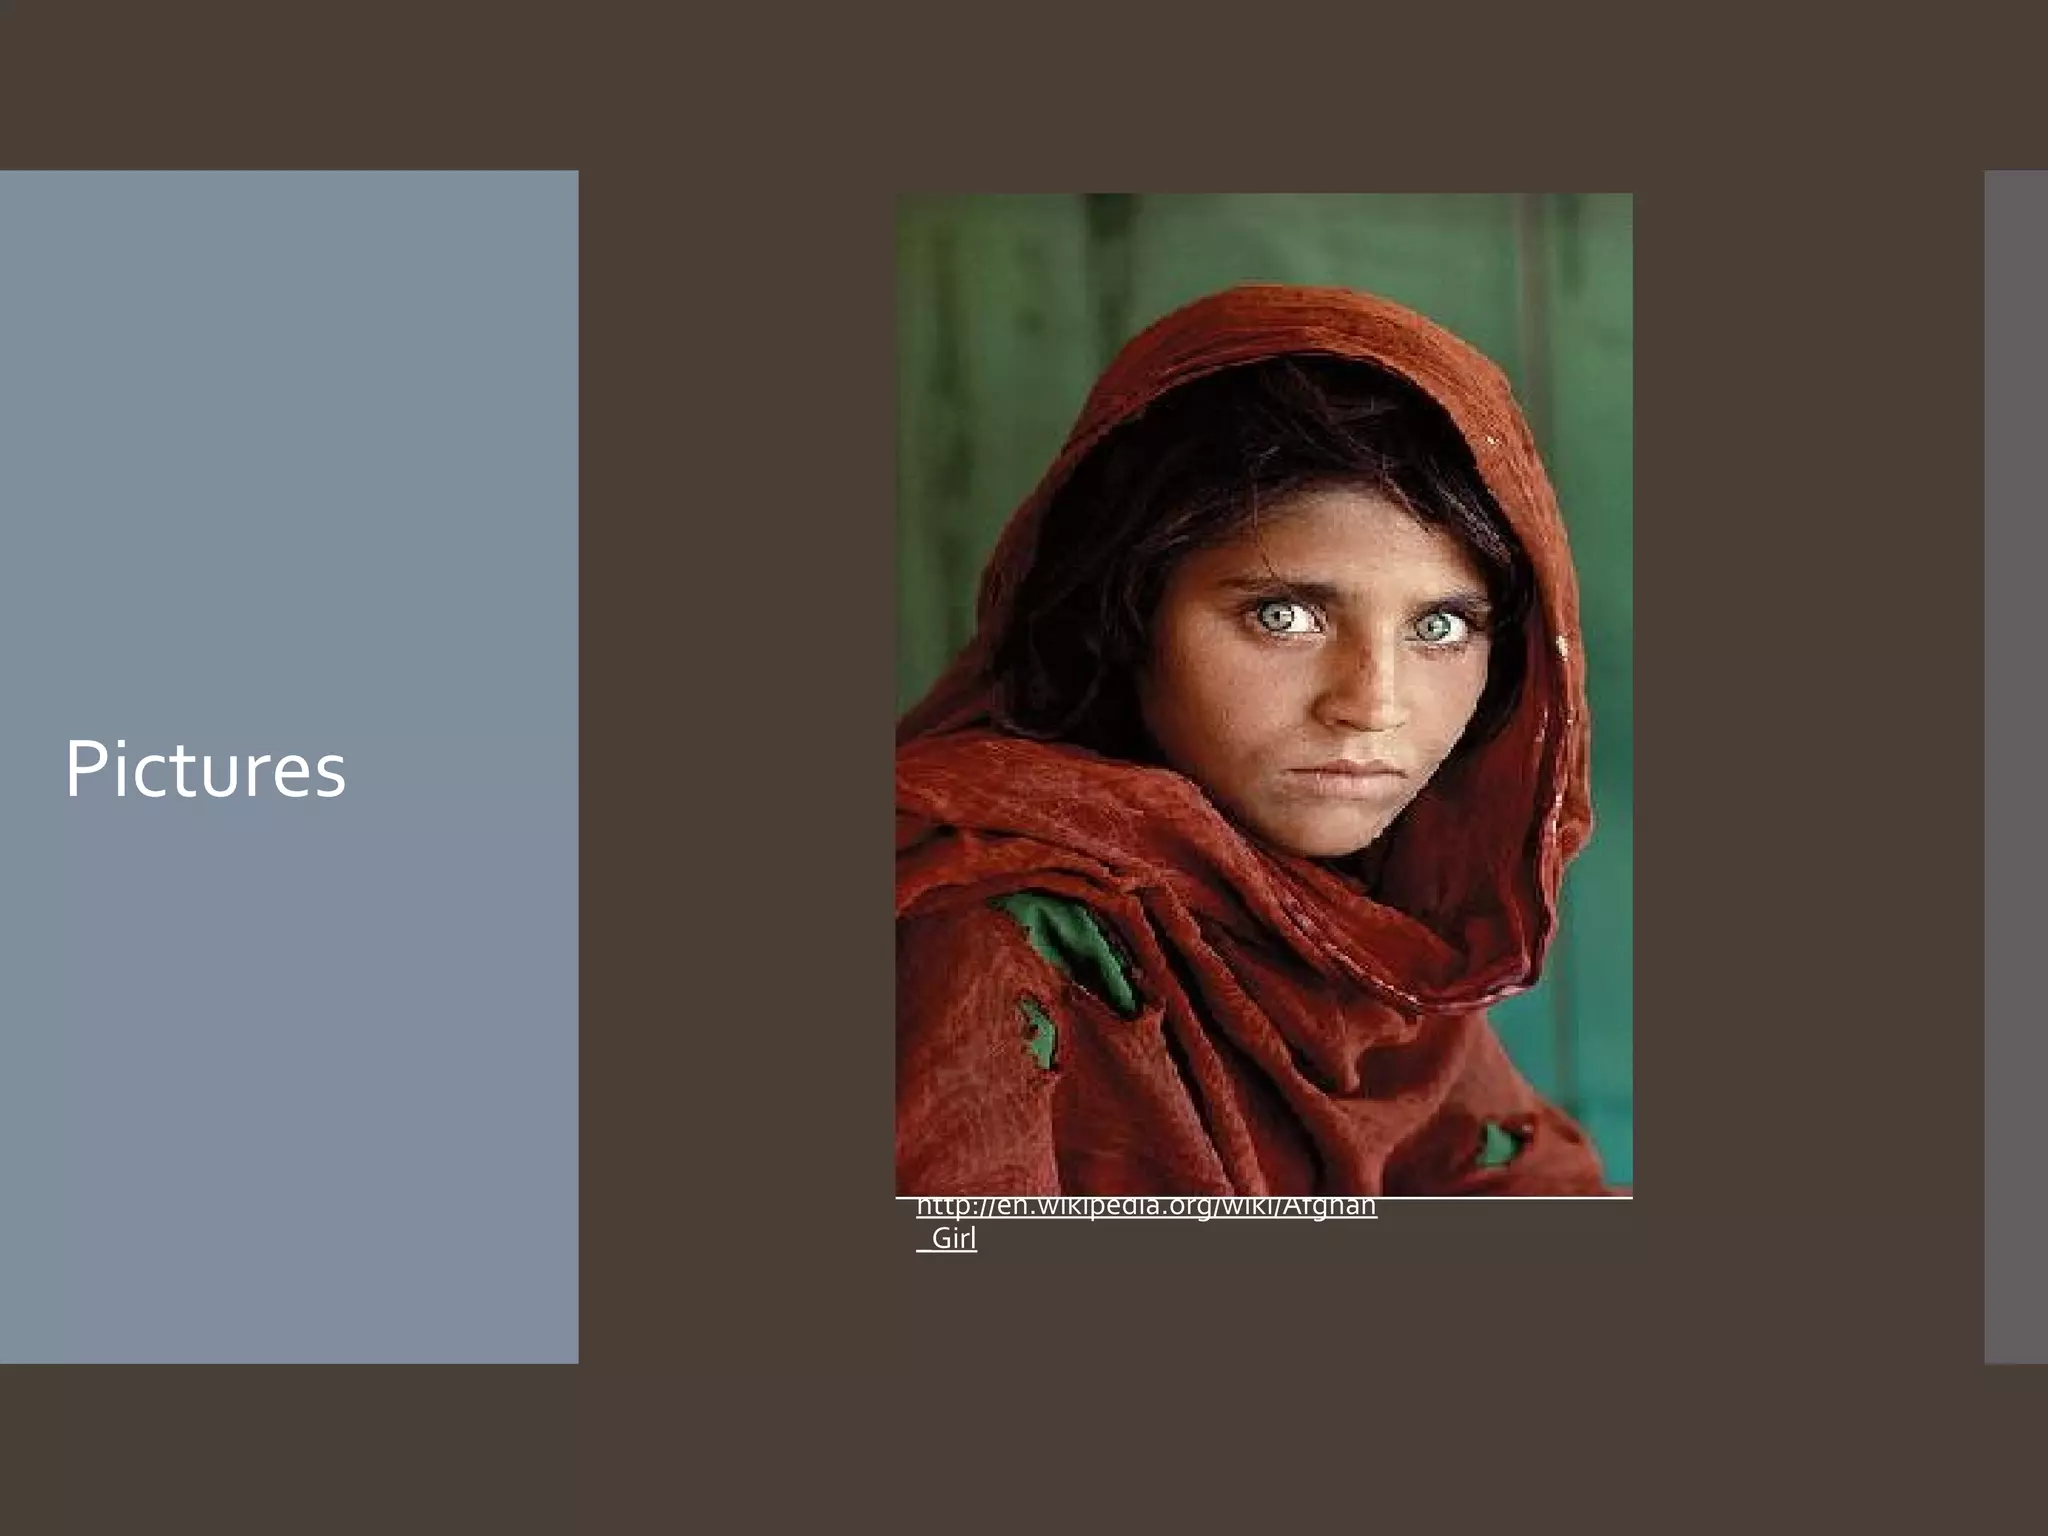
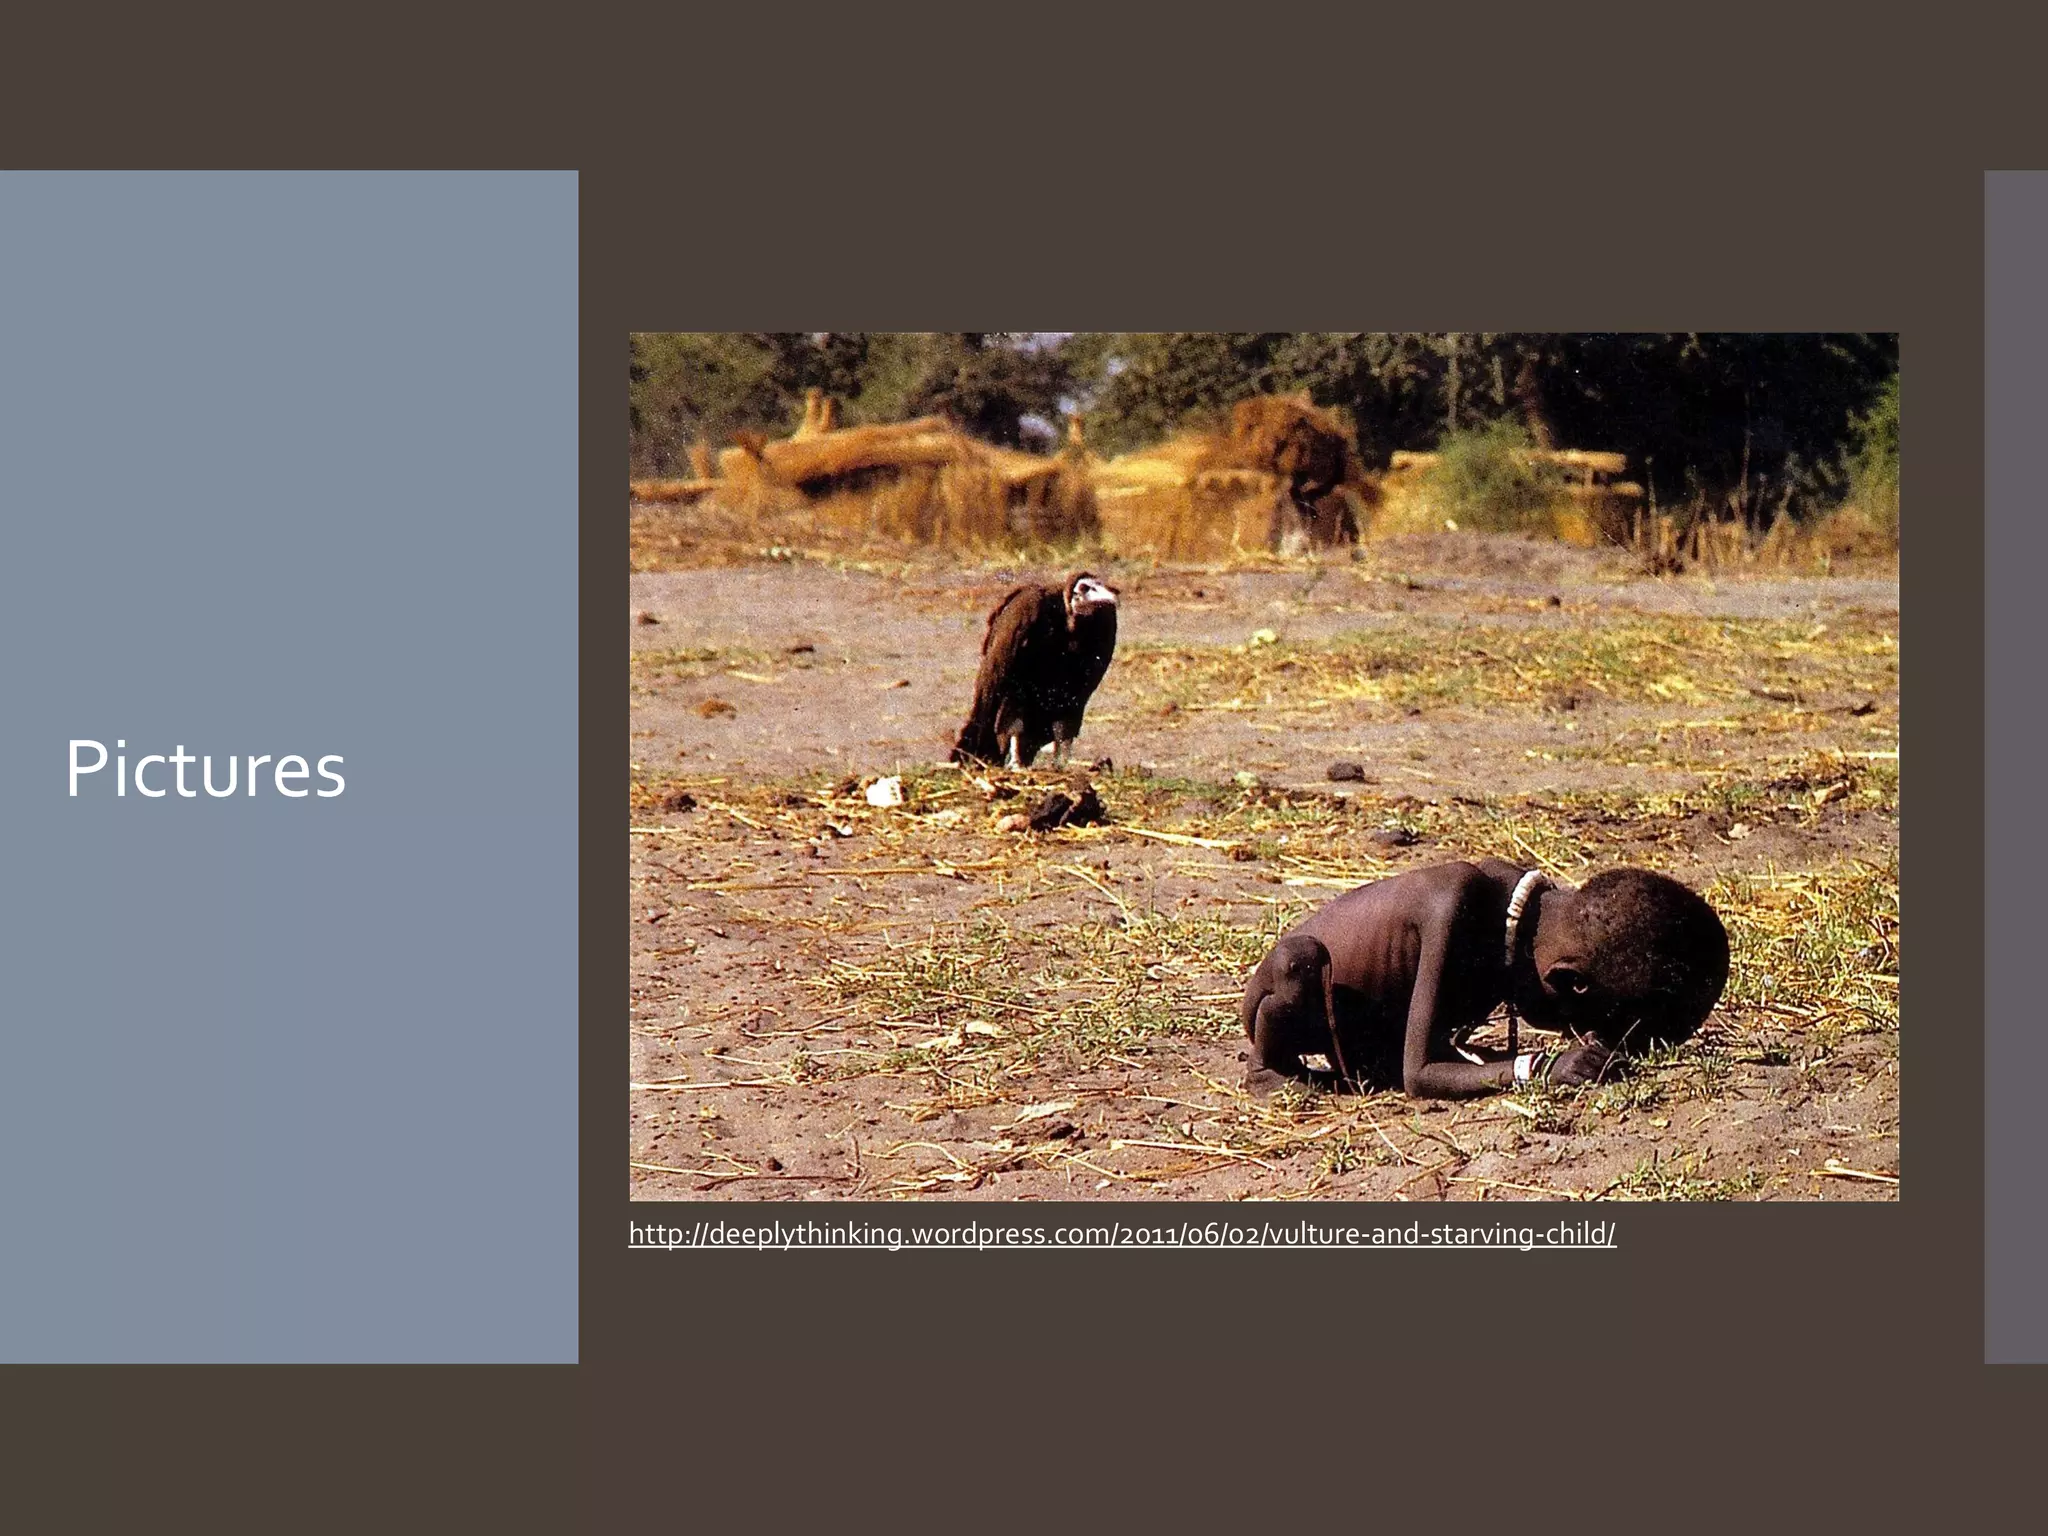
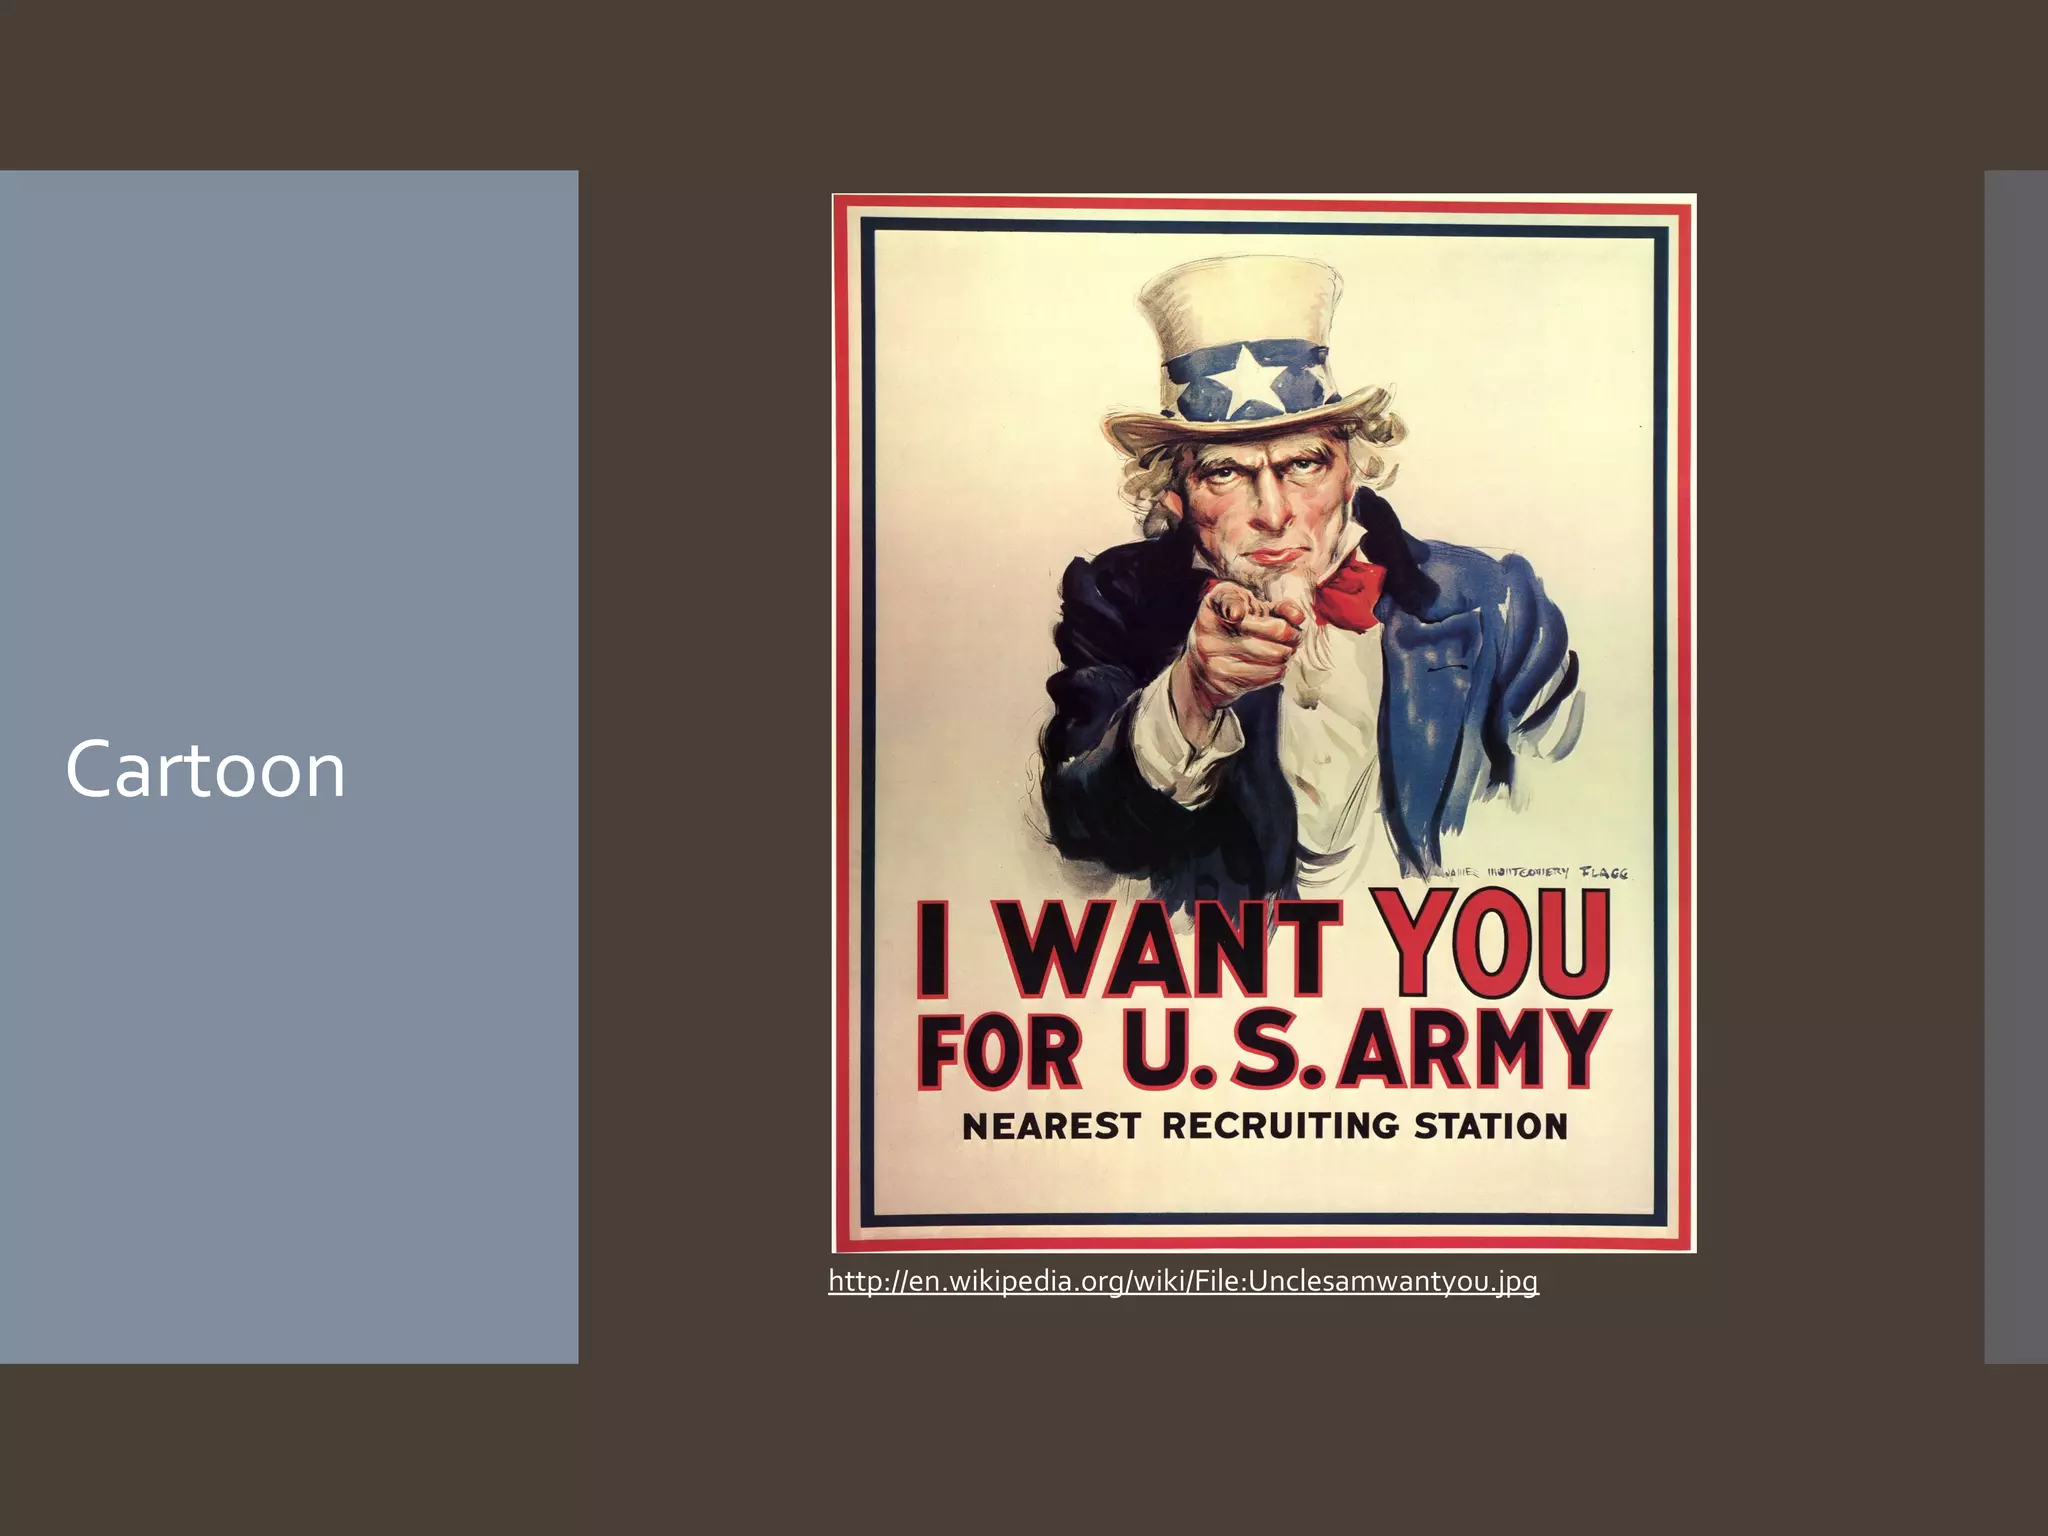
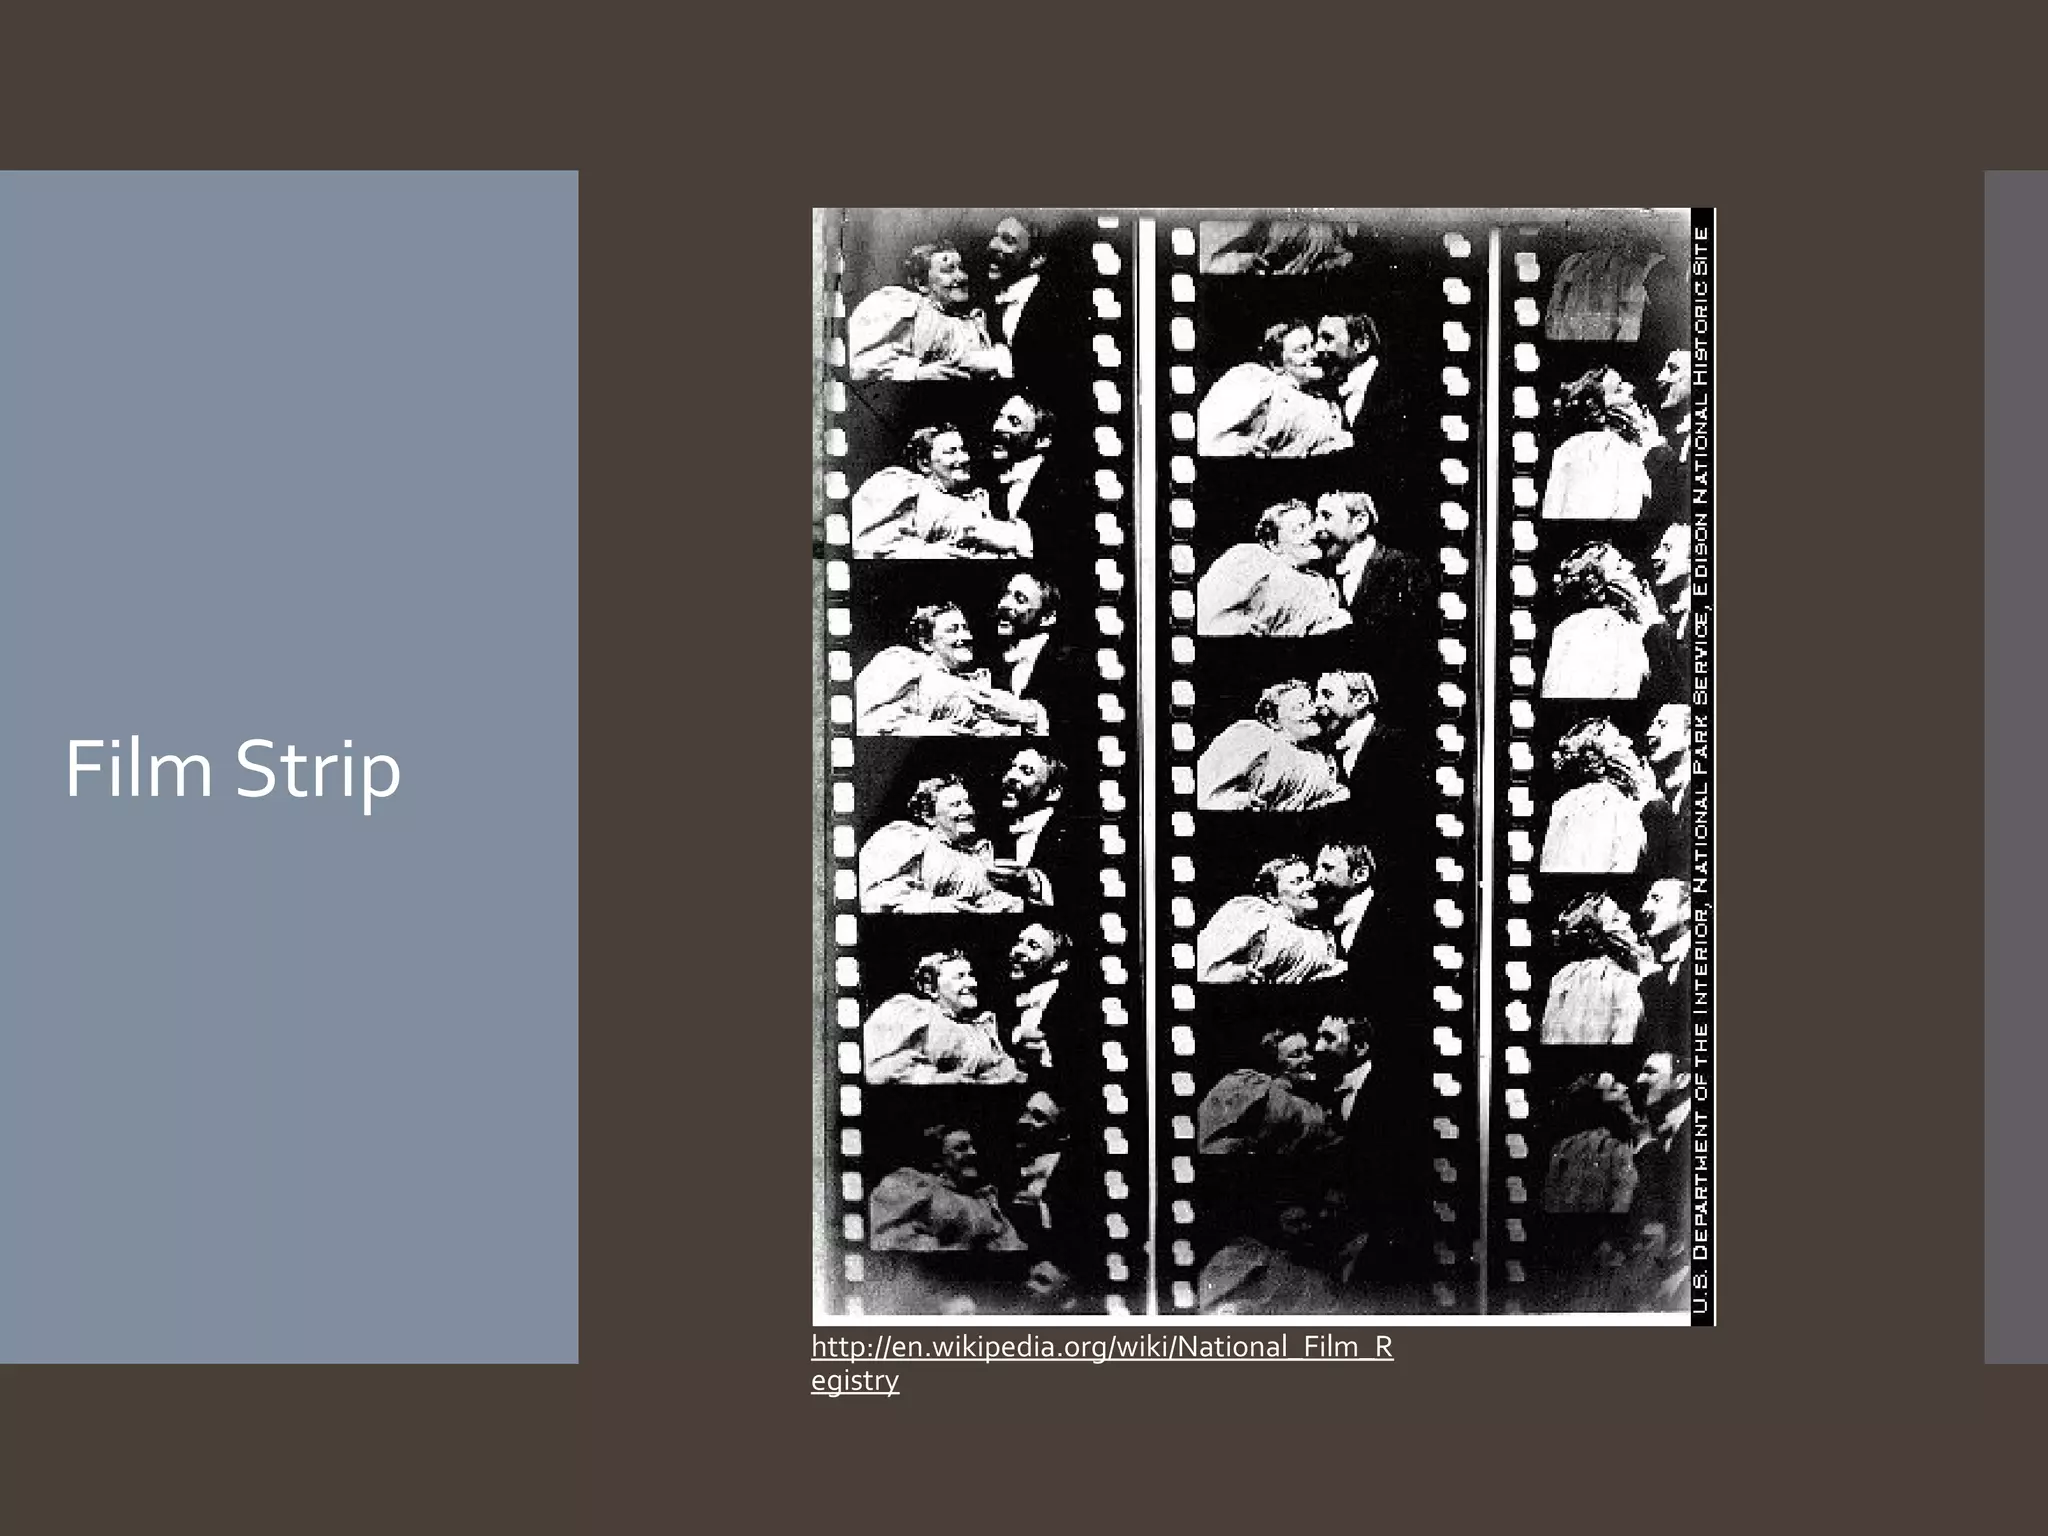
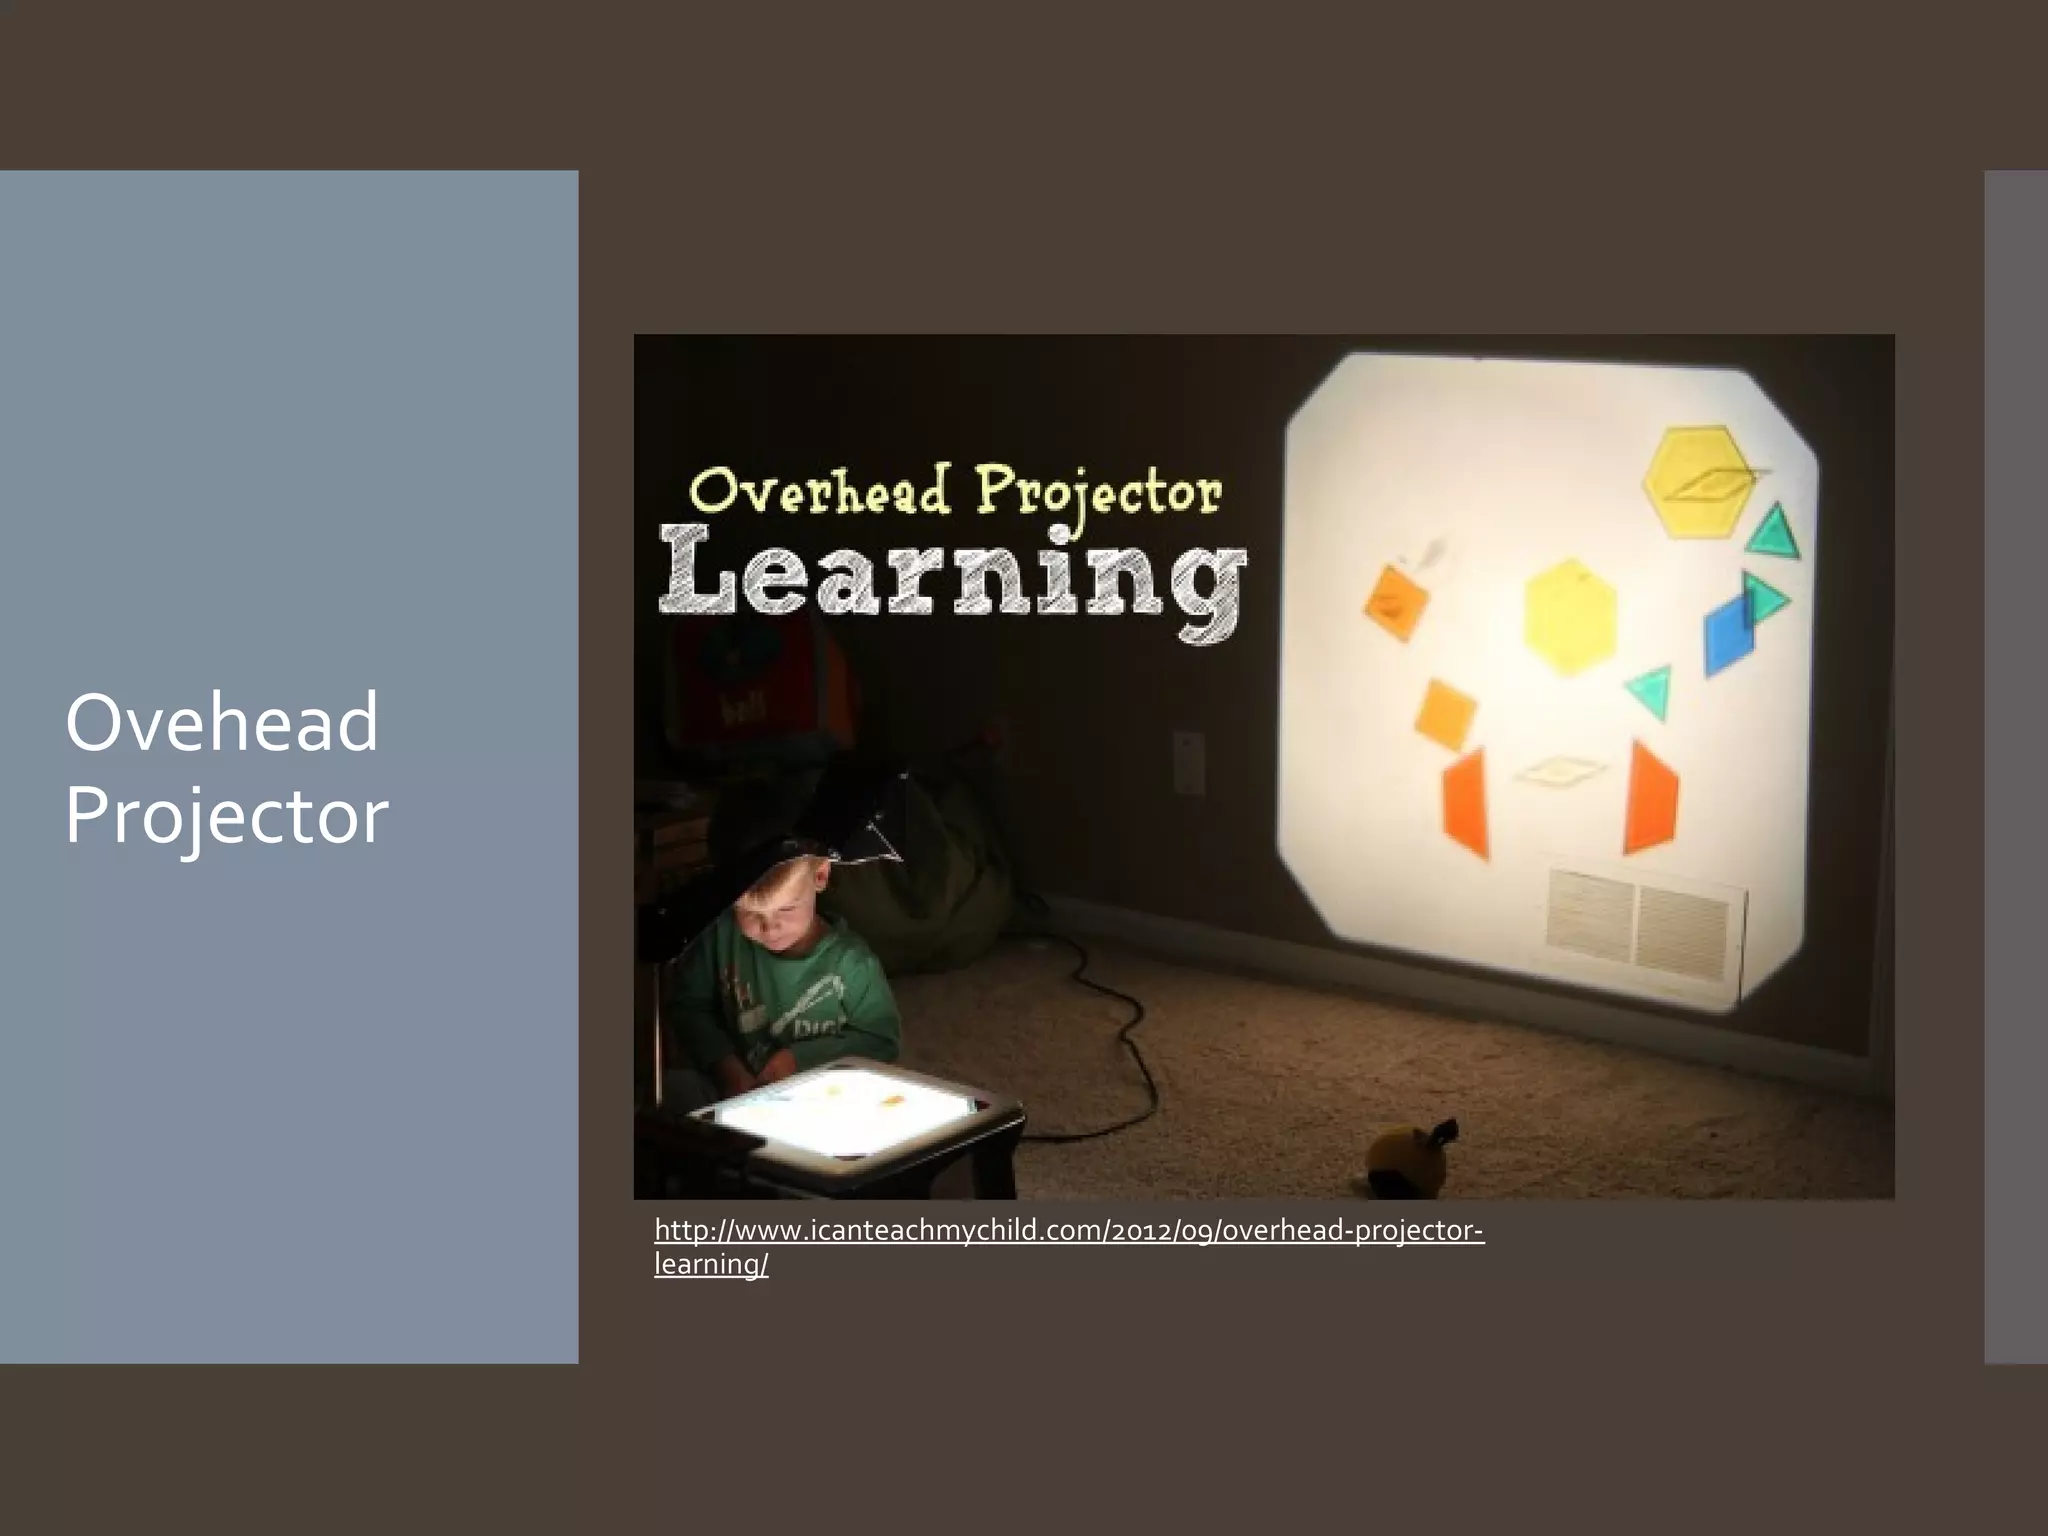
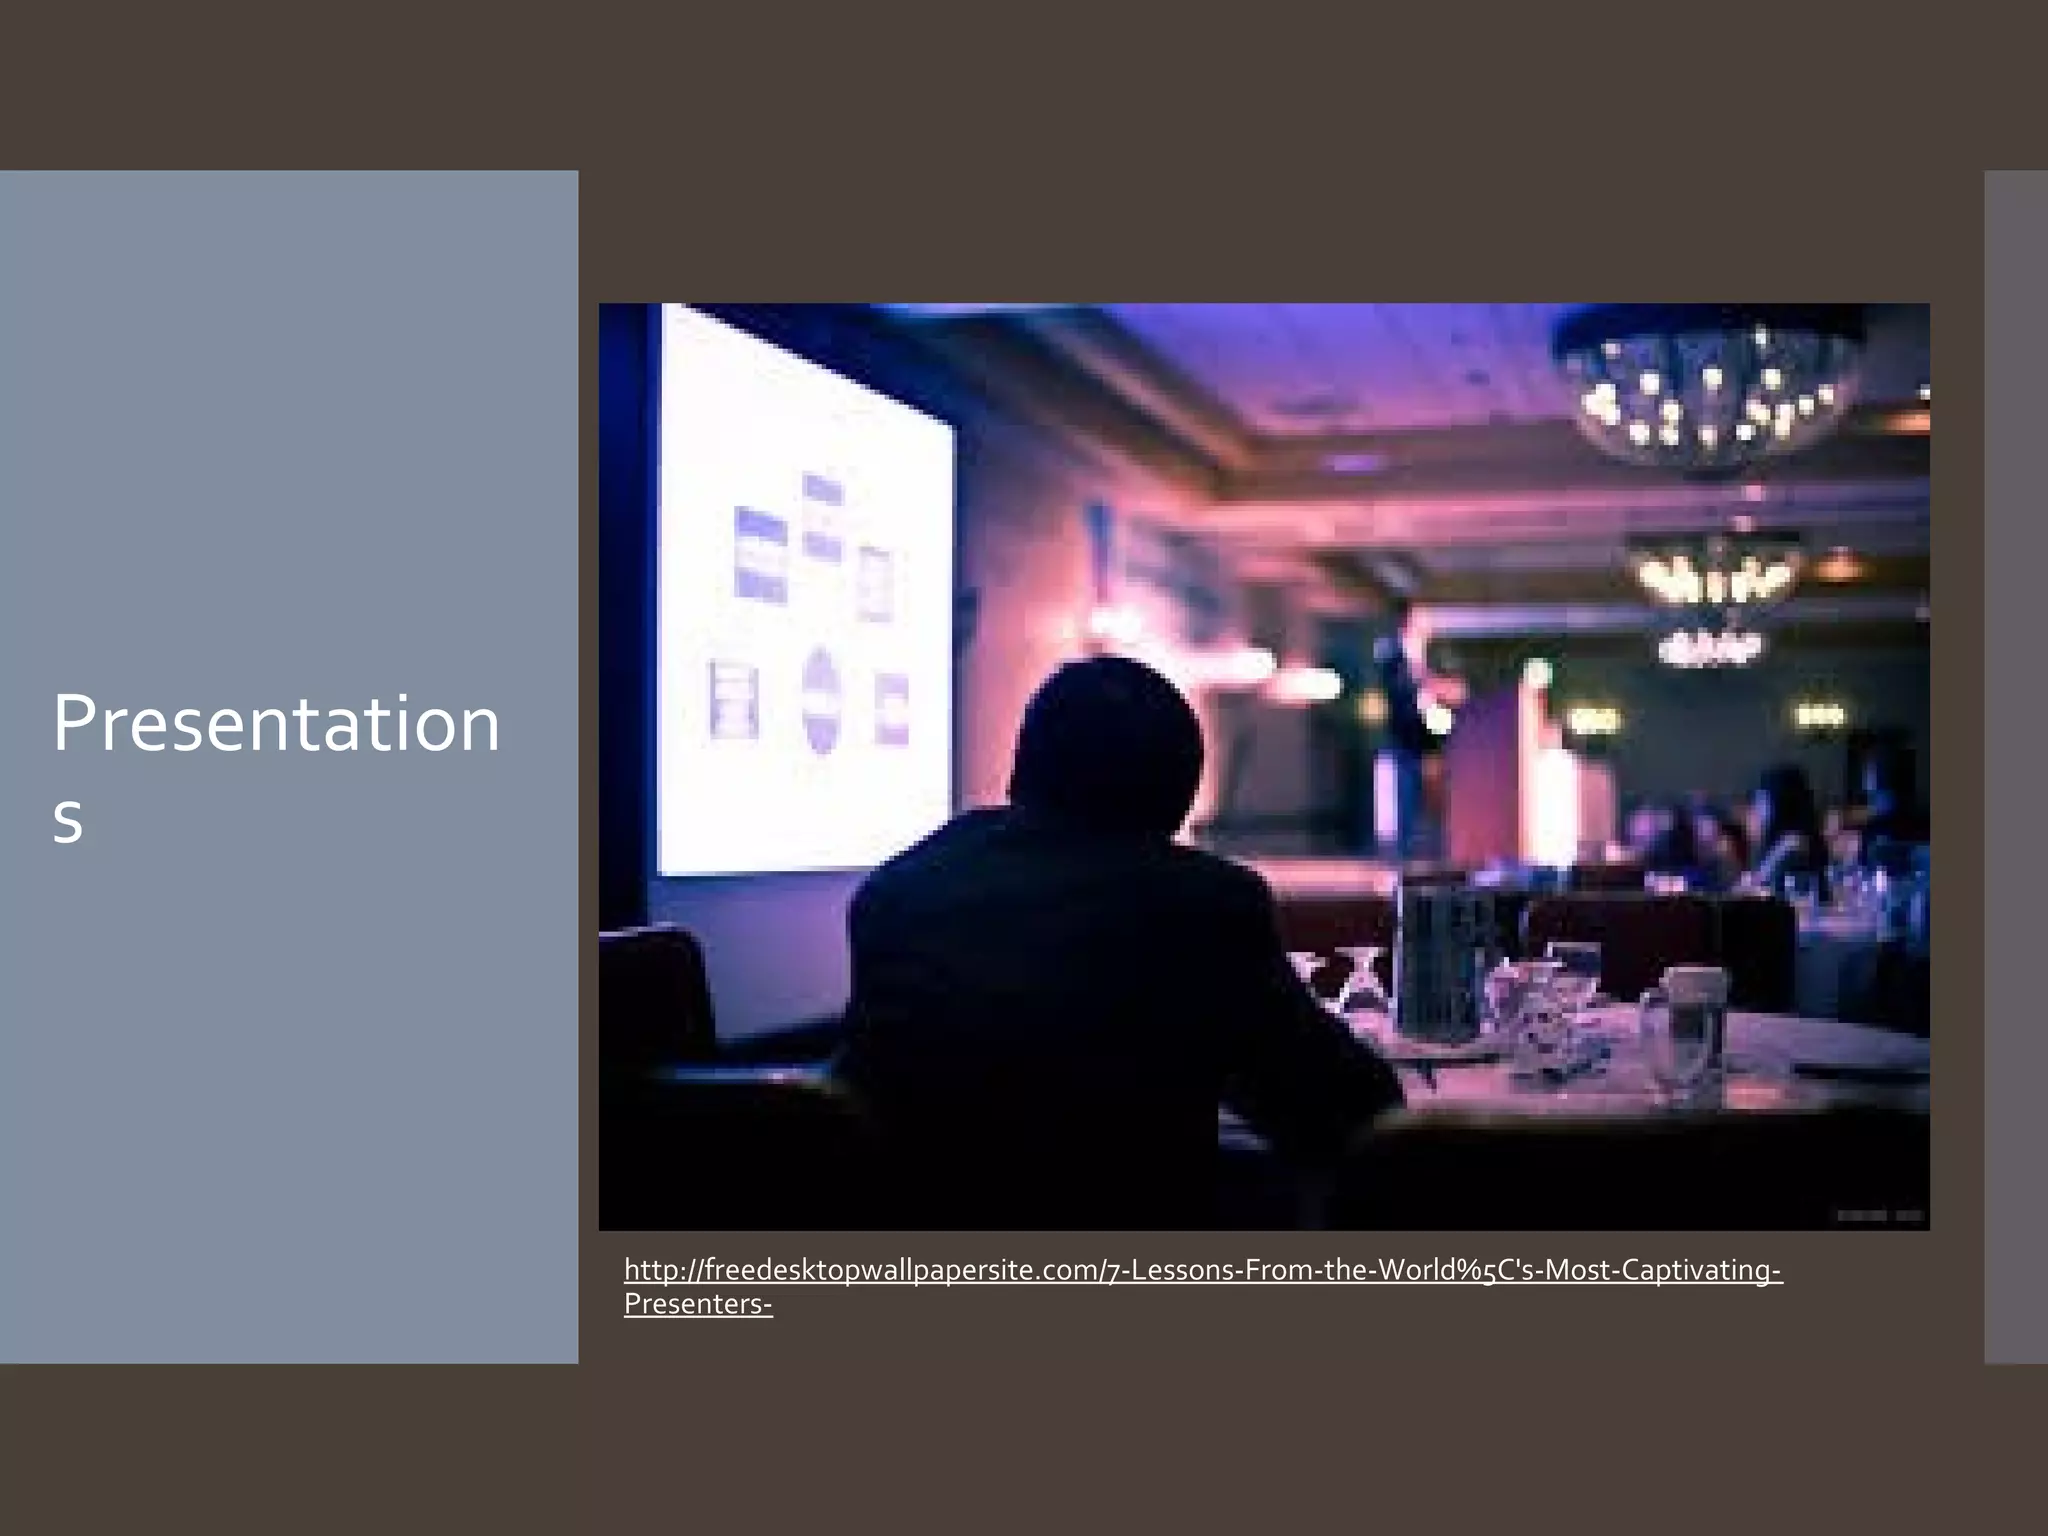
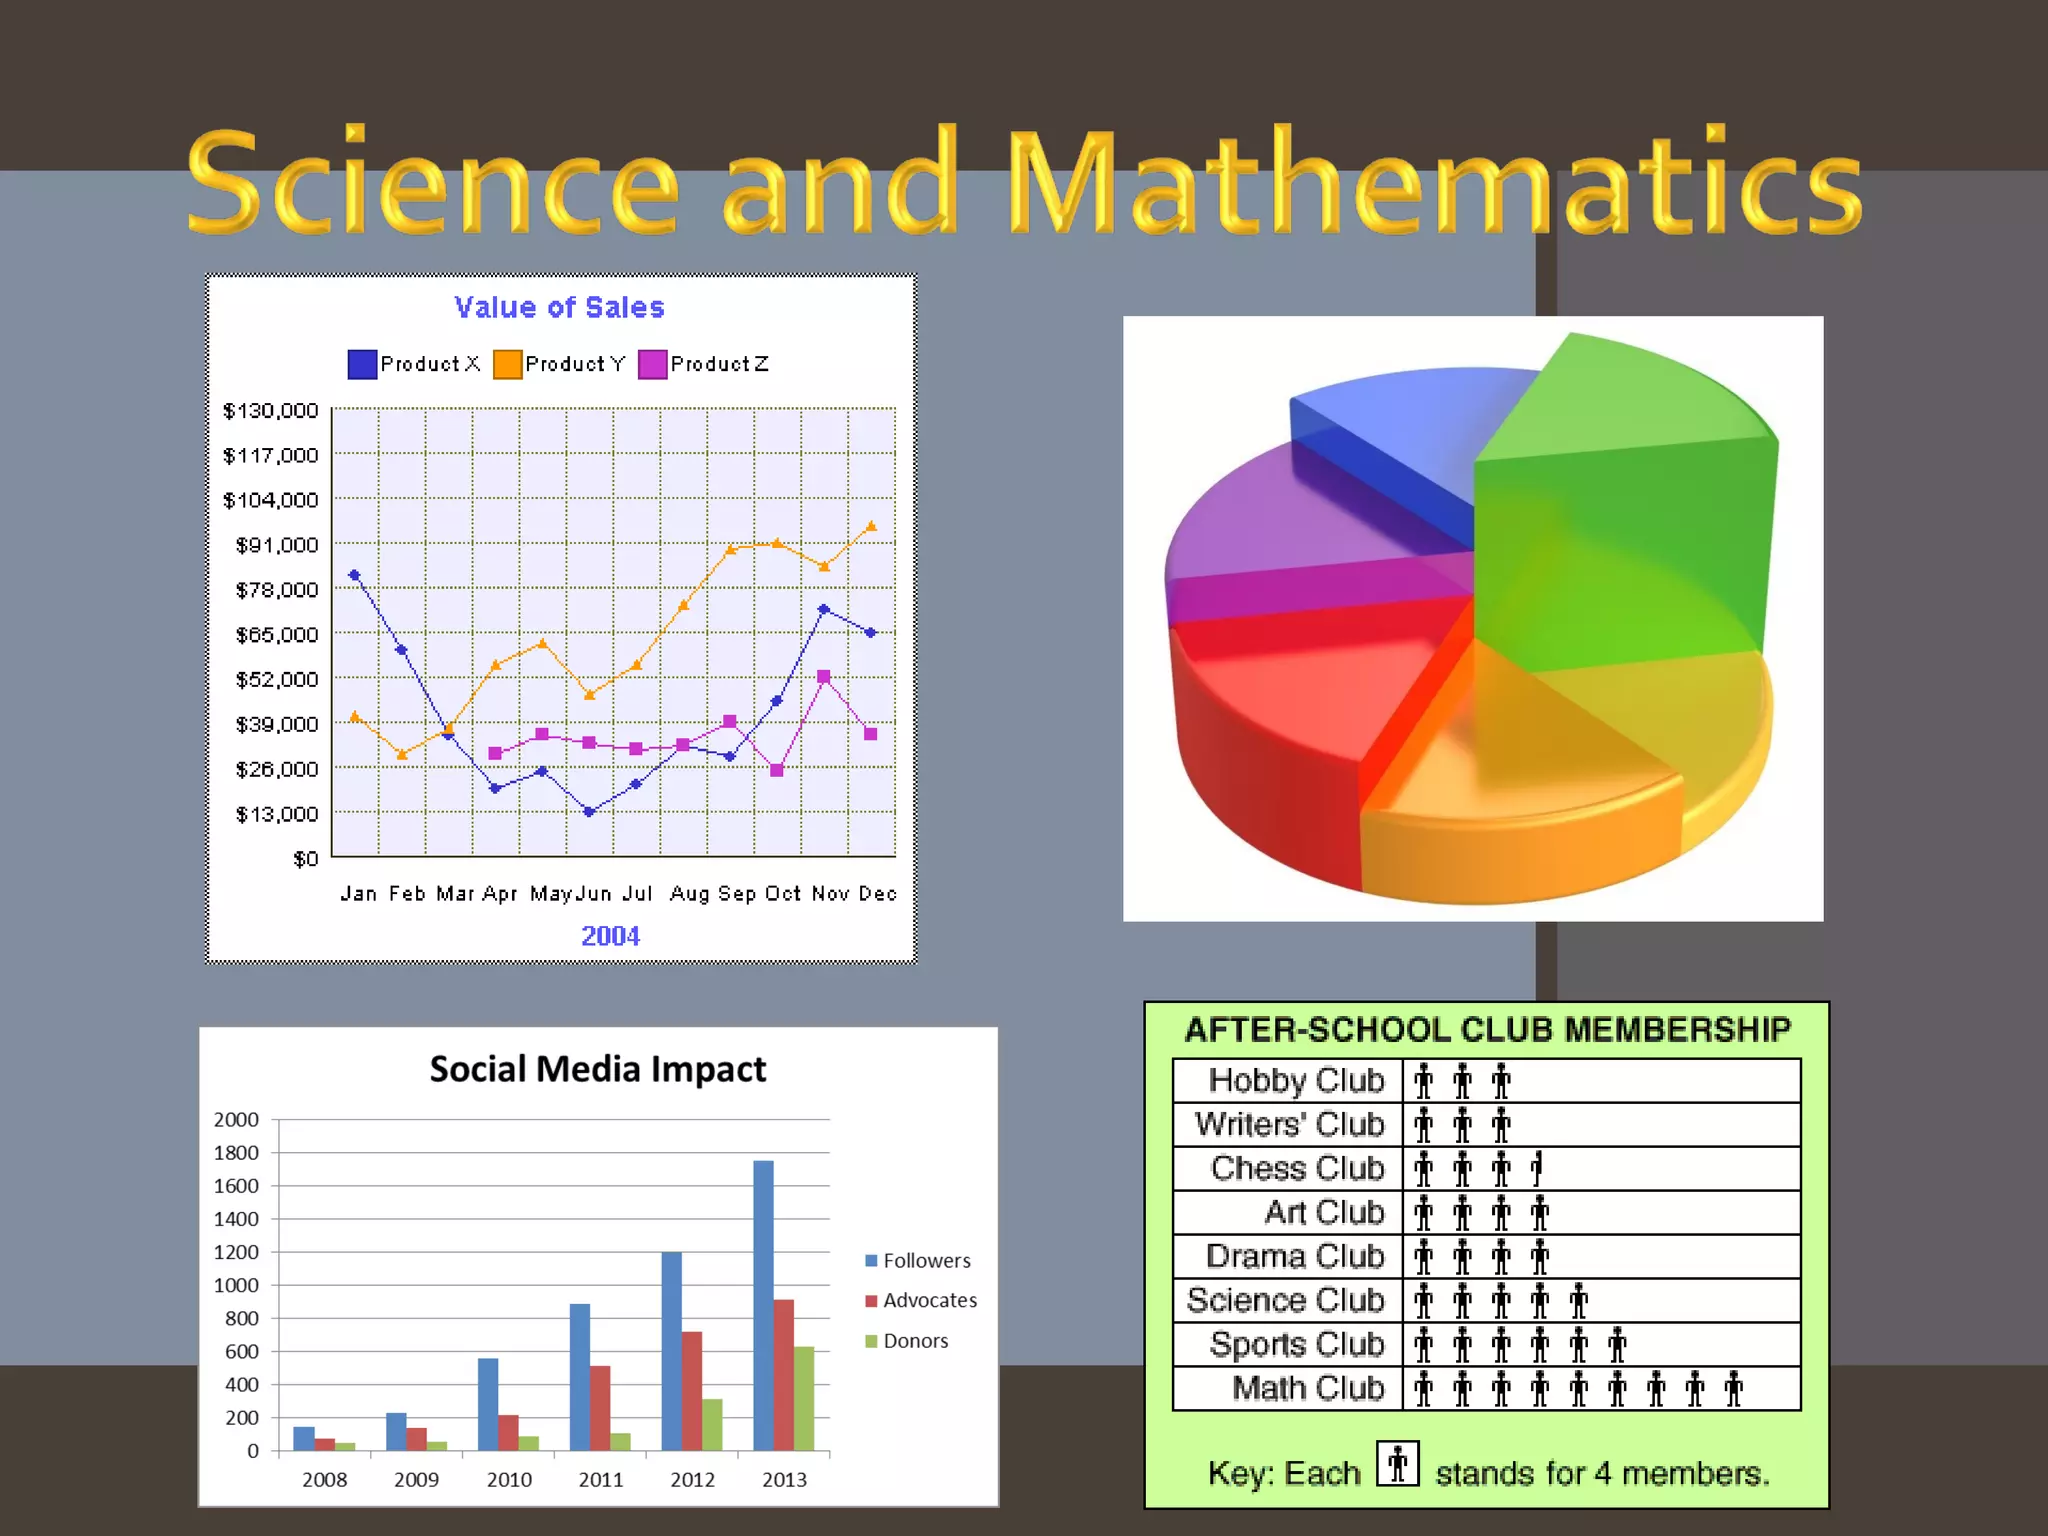
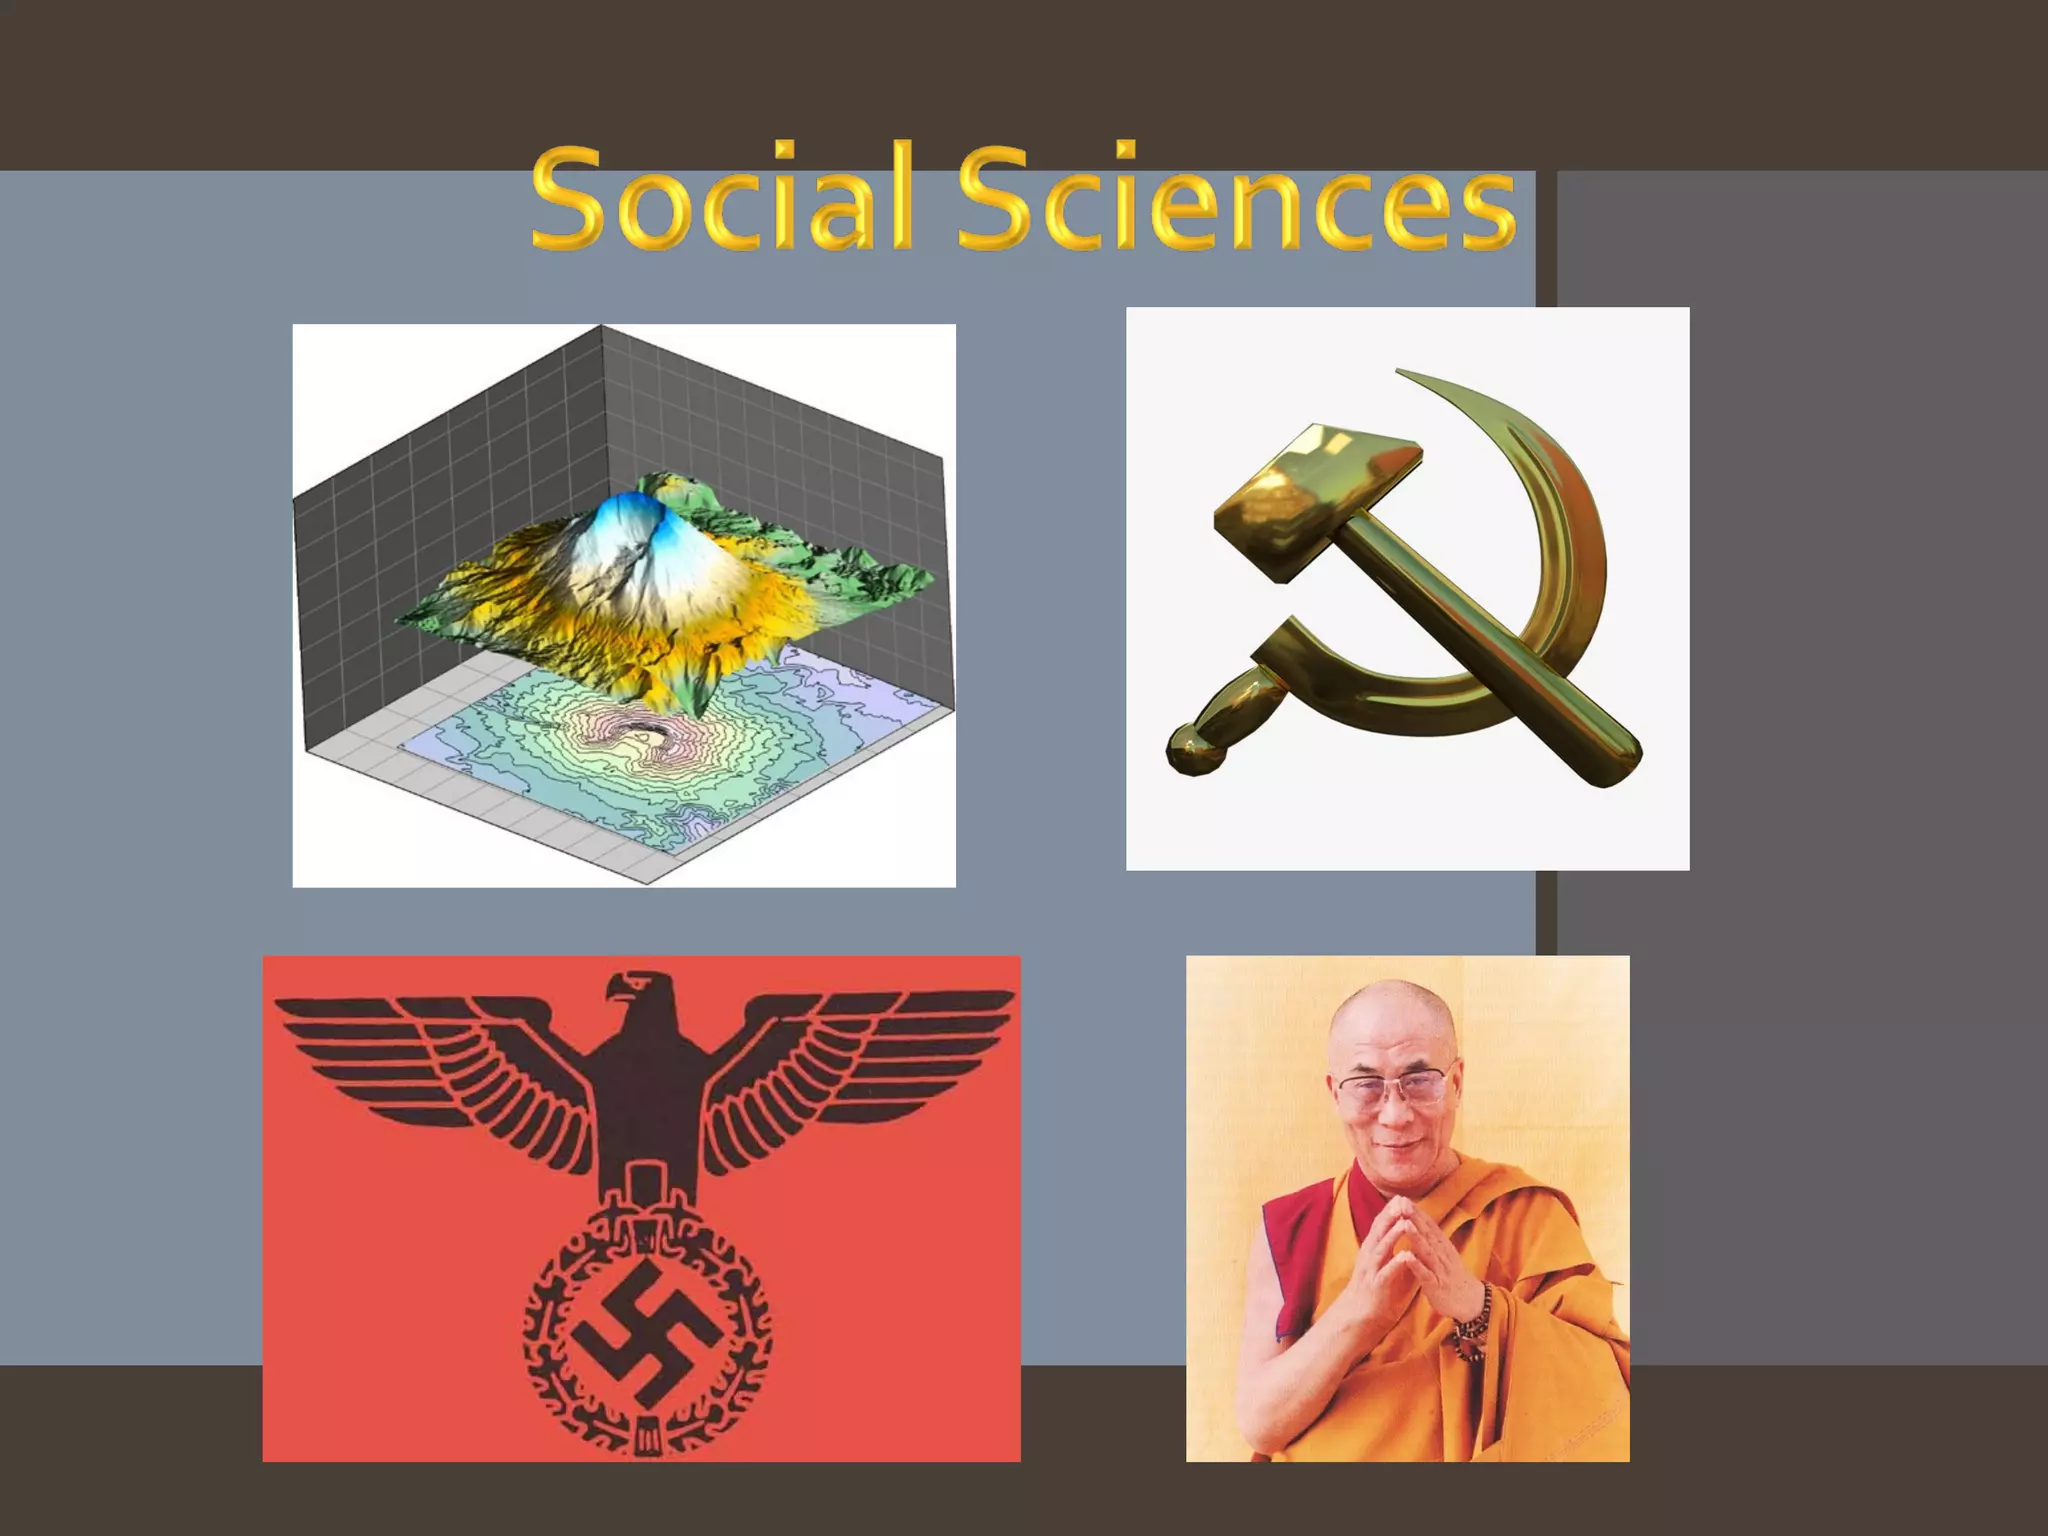
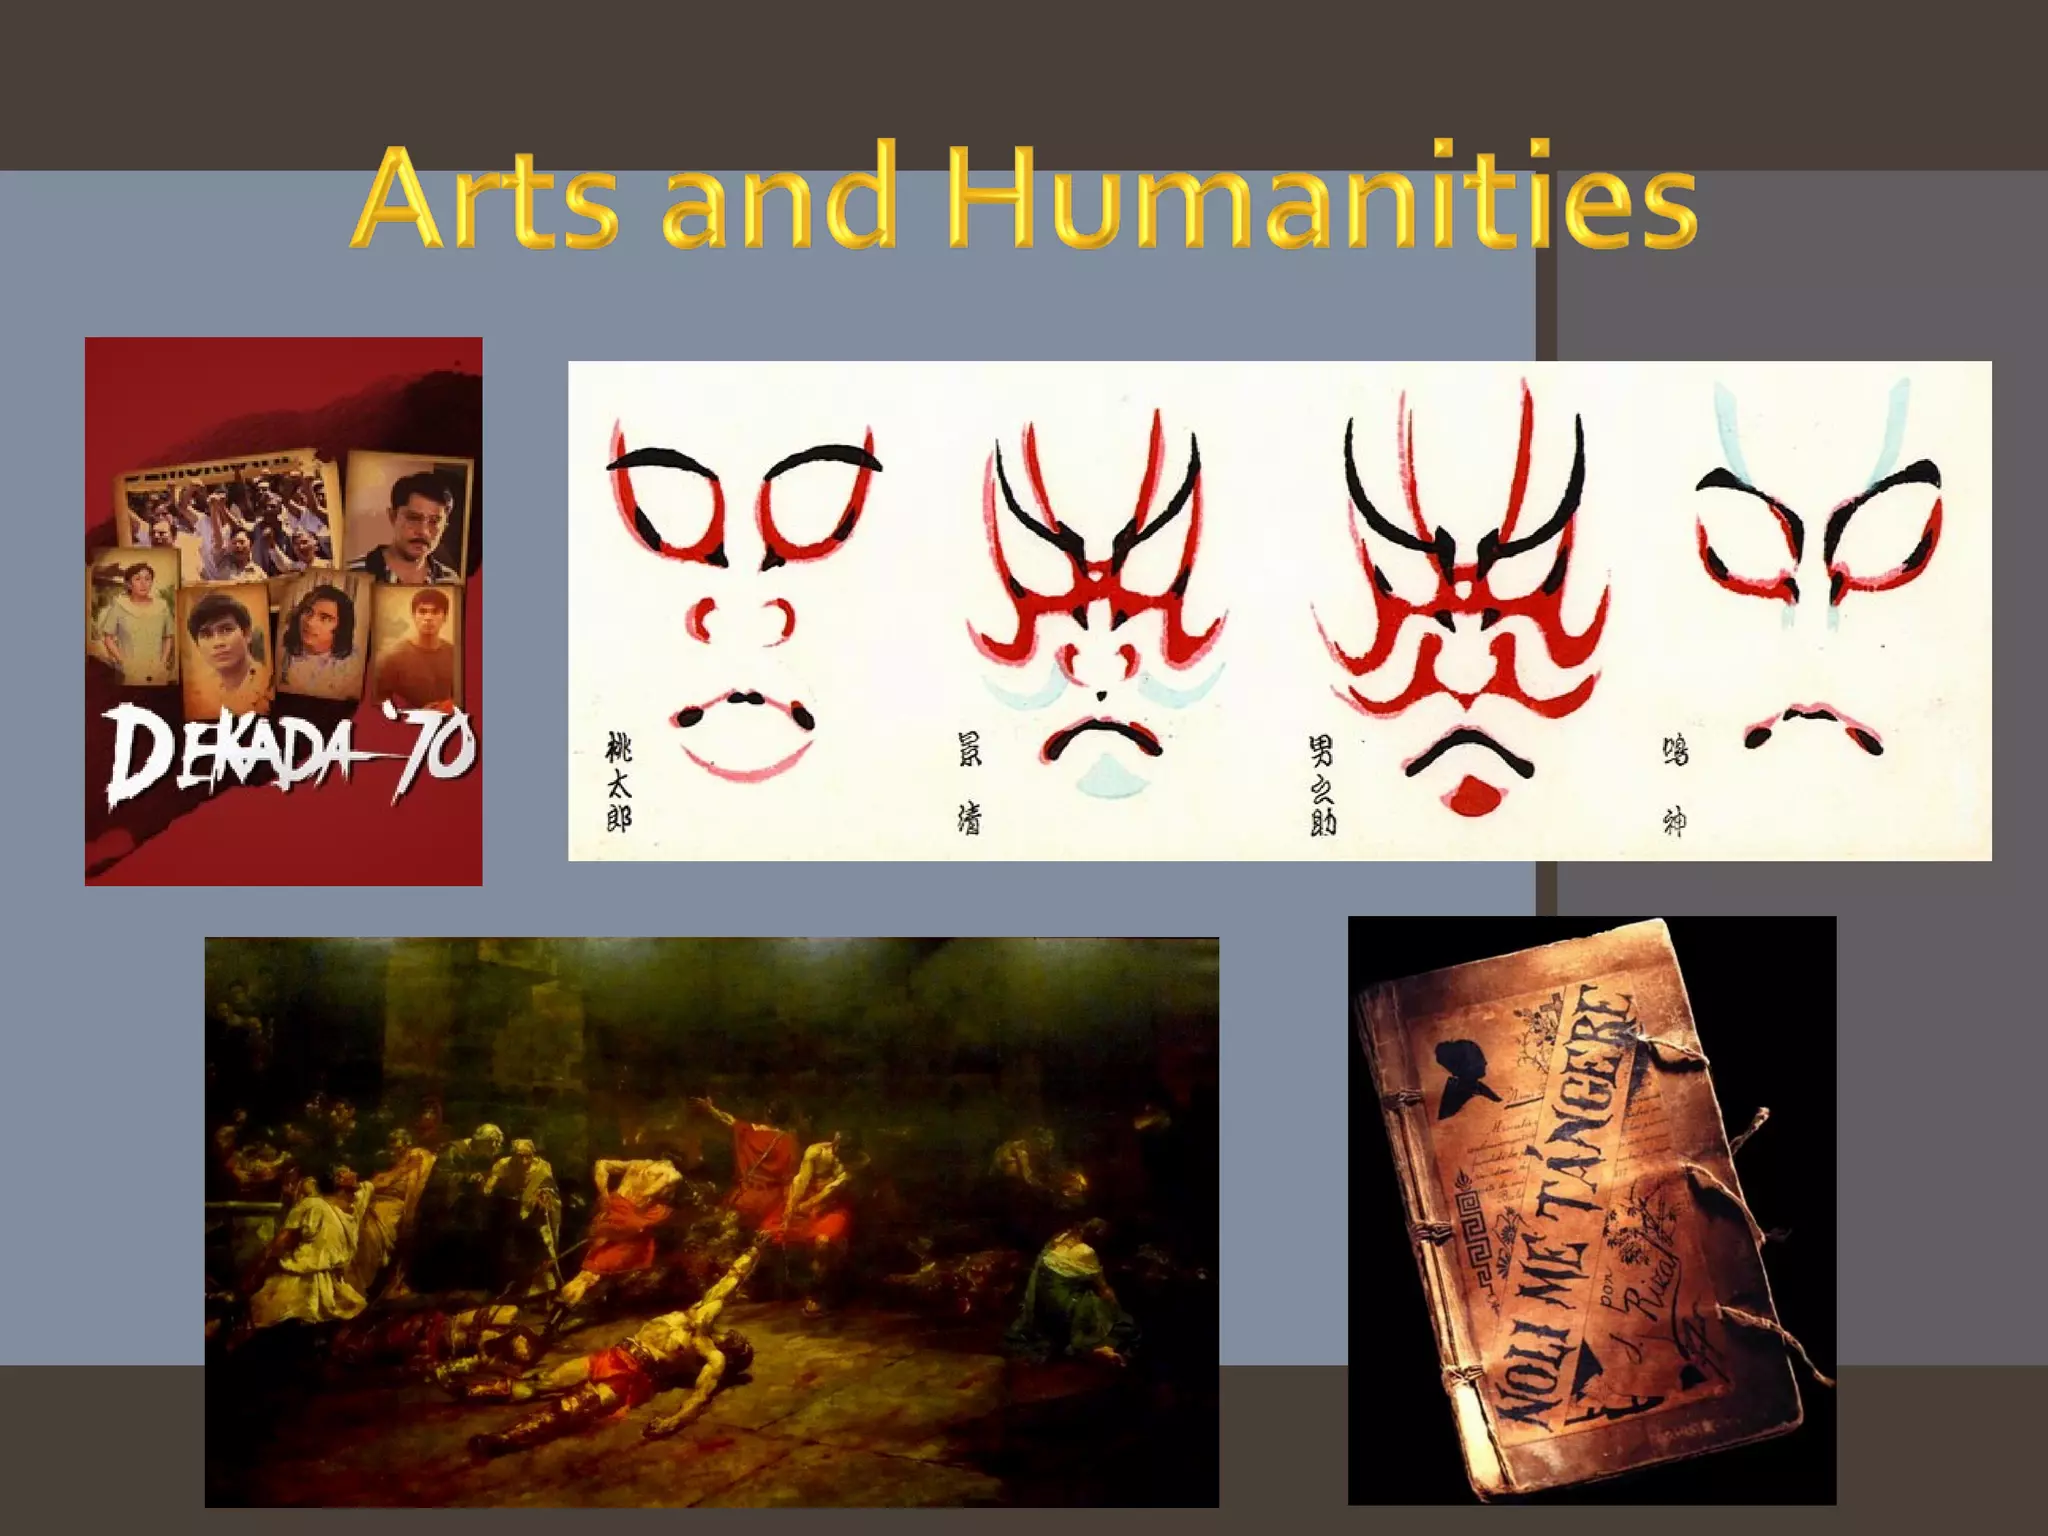
The document then discusses key elements of visual design like line, color, texture, shape, form, value, and size. It also categorizes types of visual media as non-projected (cartoons, charts, comics, flashcards, illustrations, maps, models, pictures, posters) and projected (films, overhead projectors, presentations, videos).
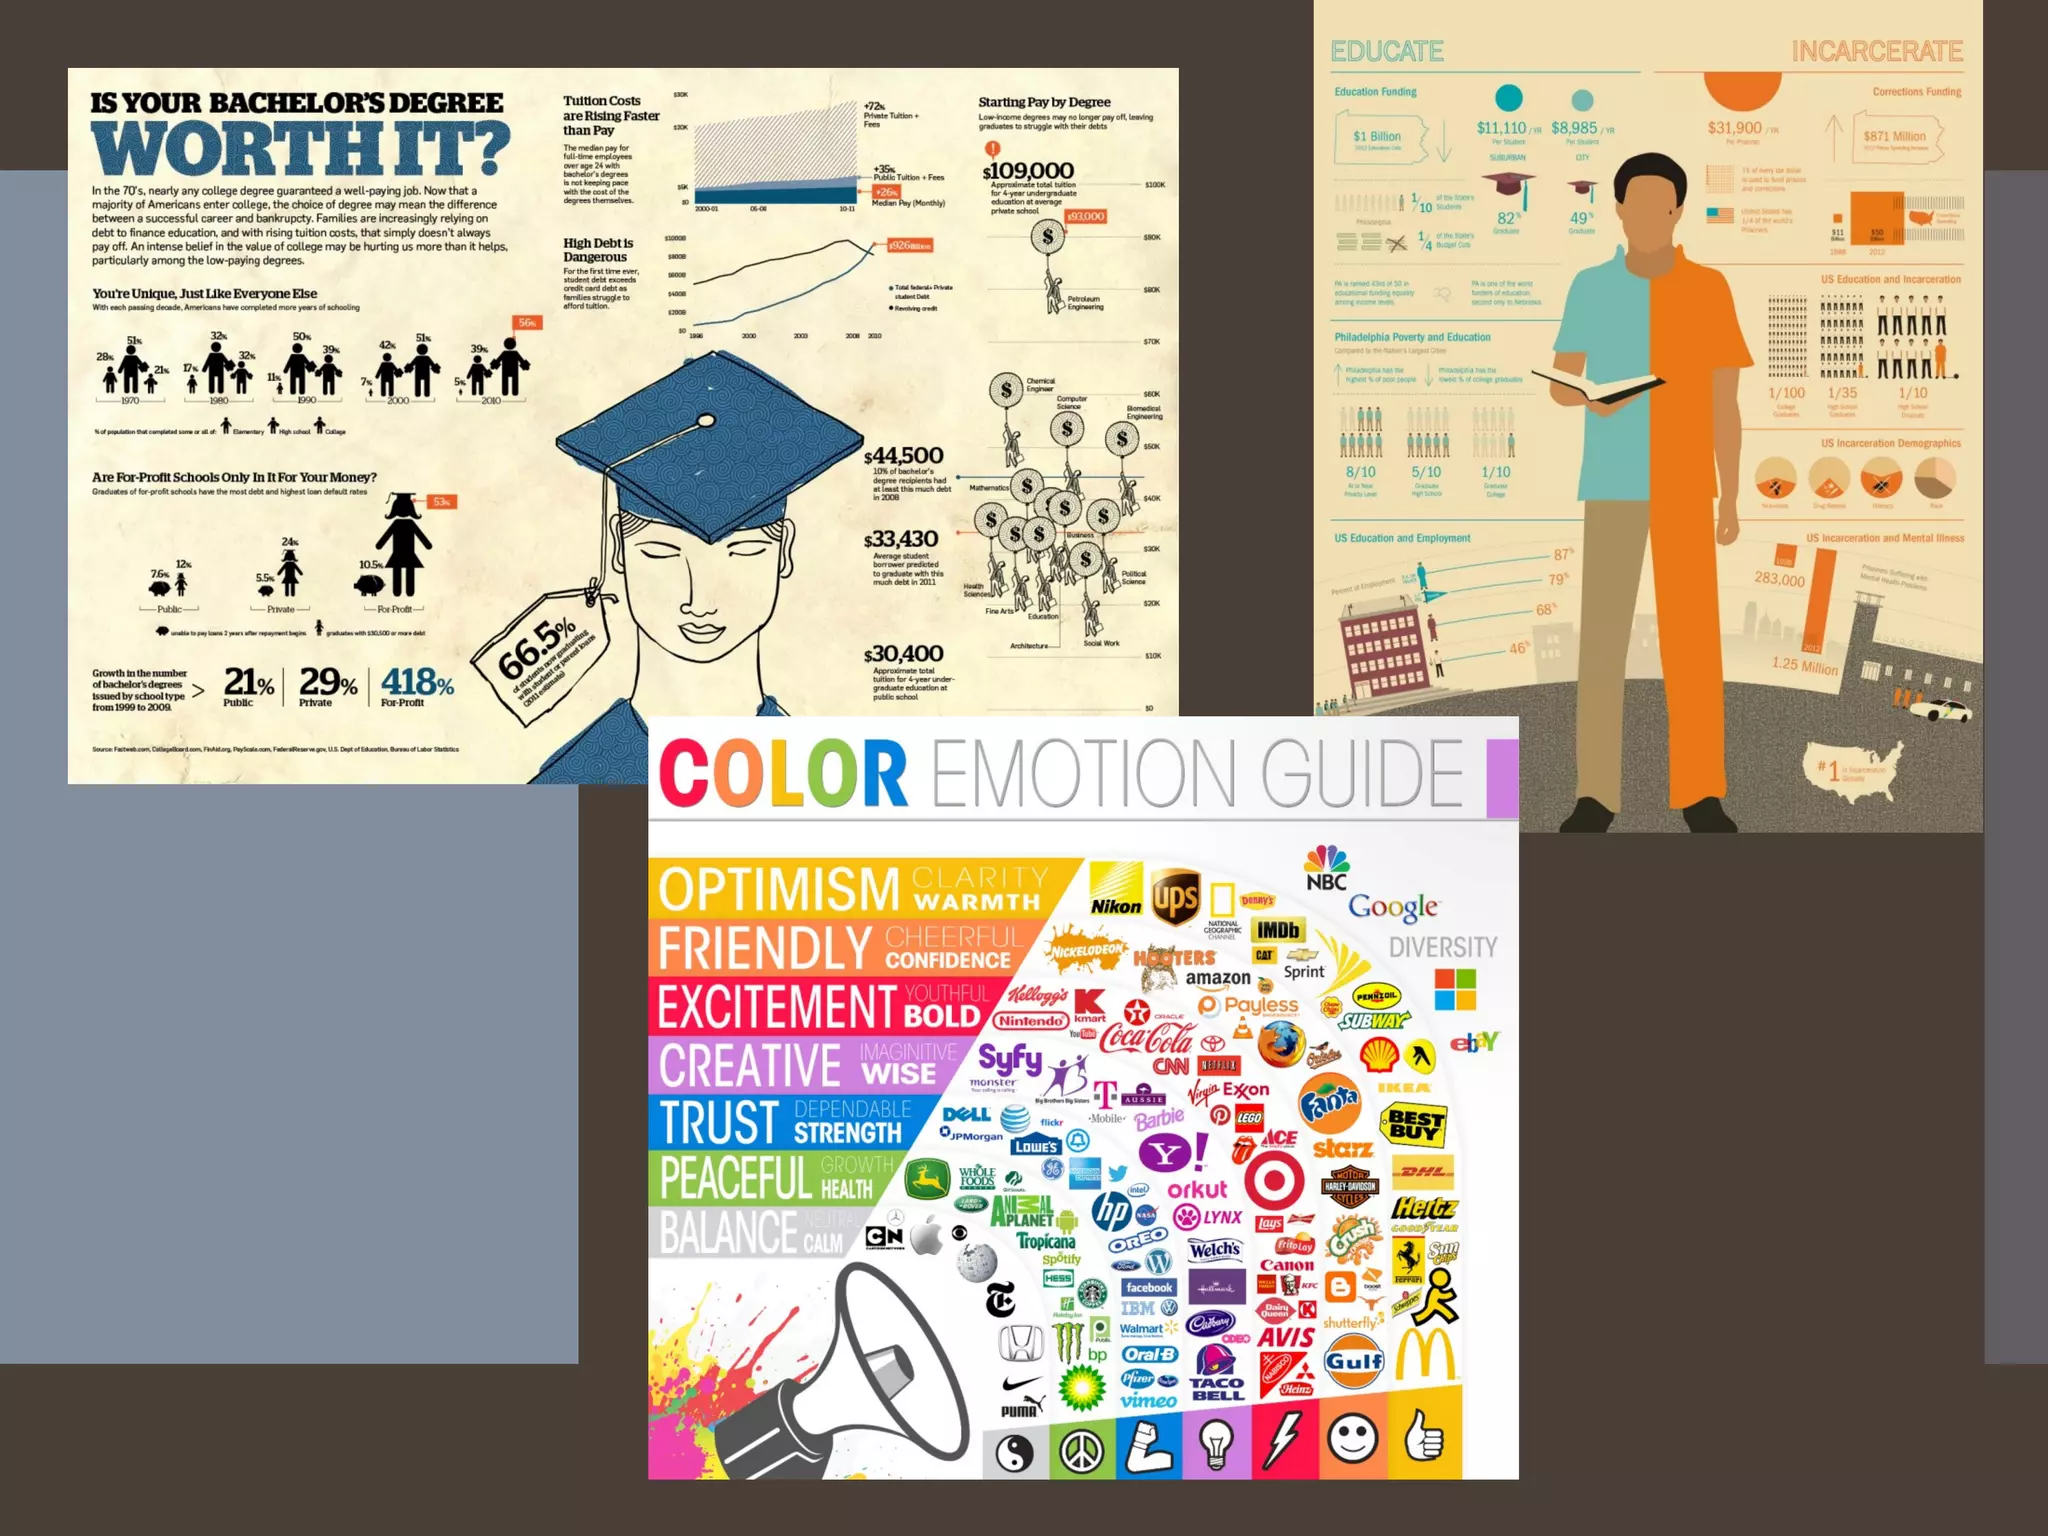
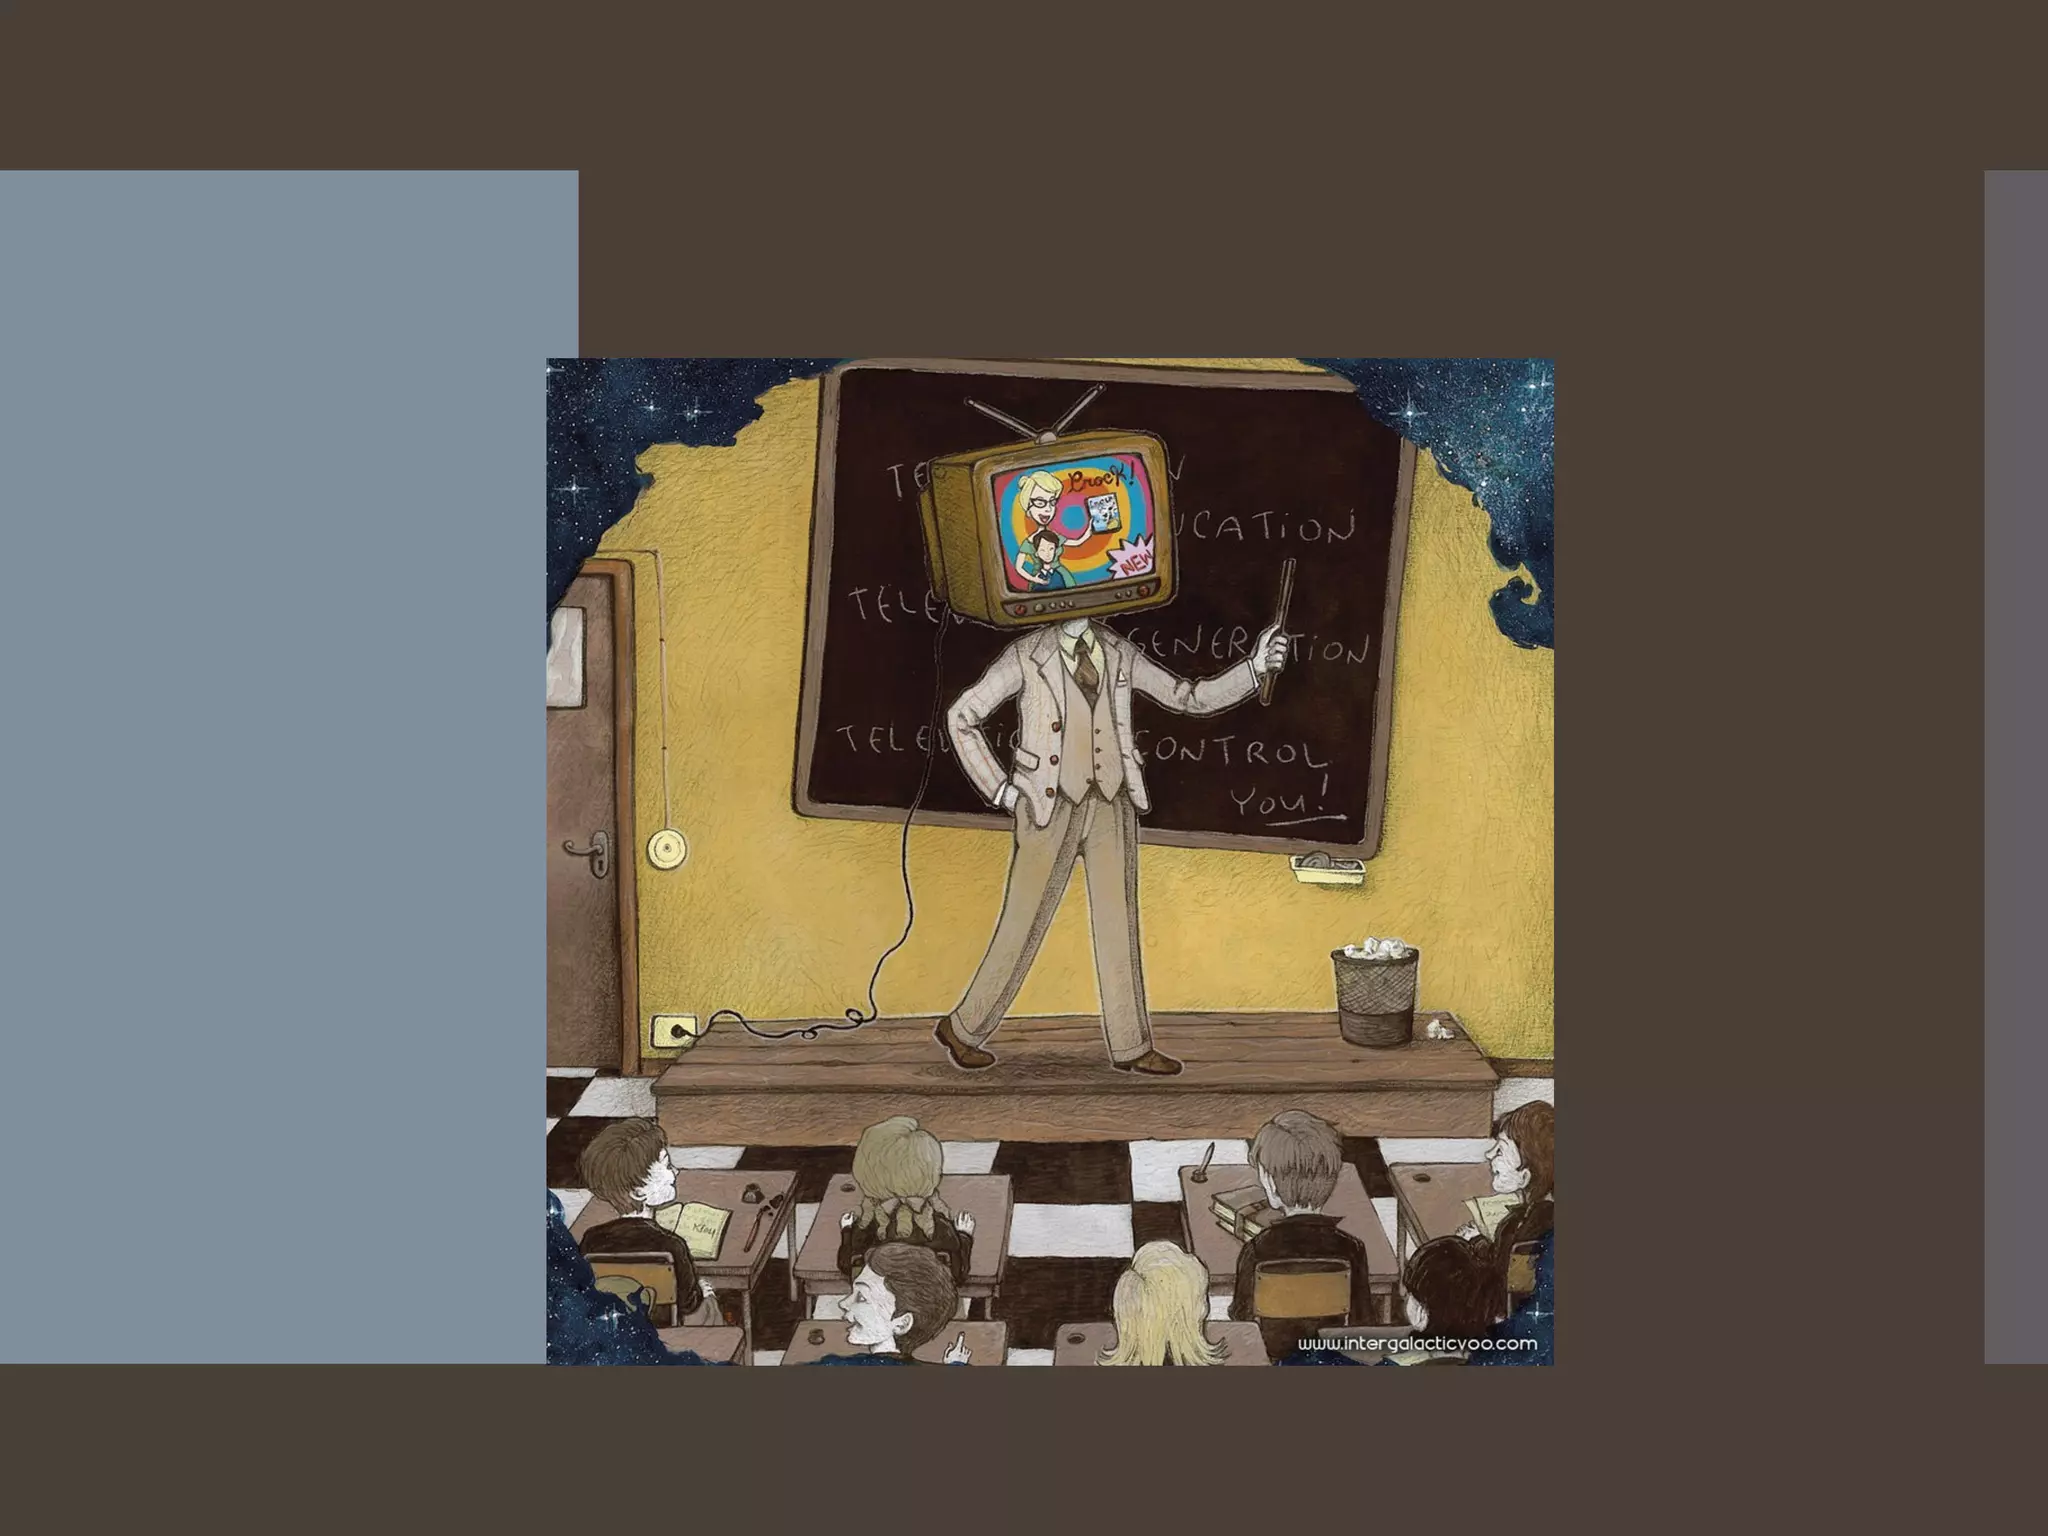
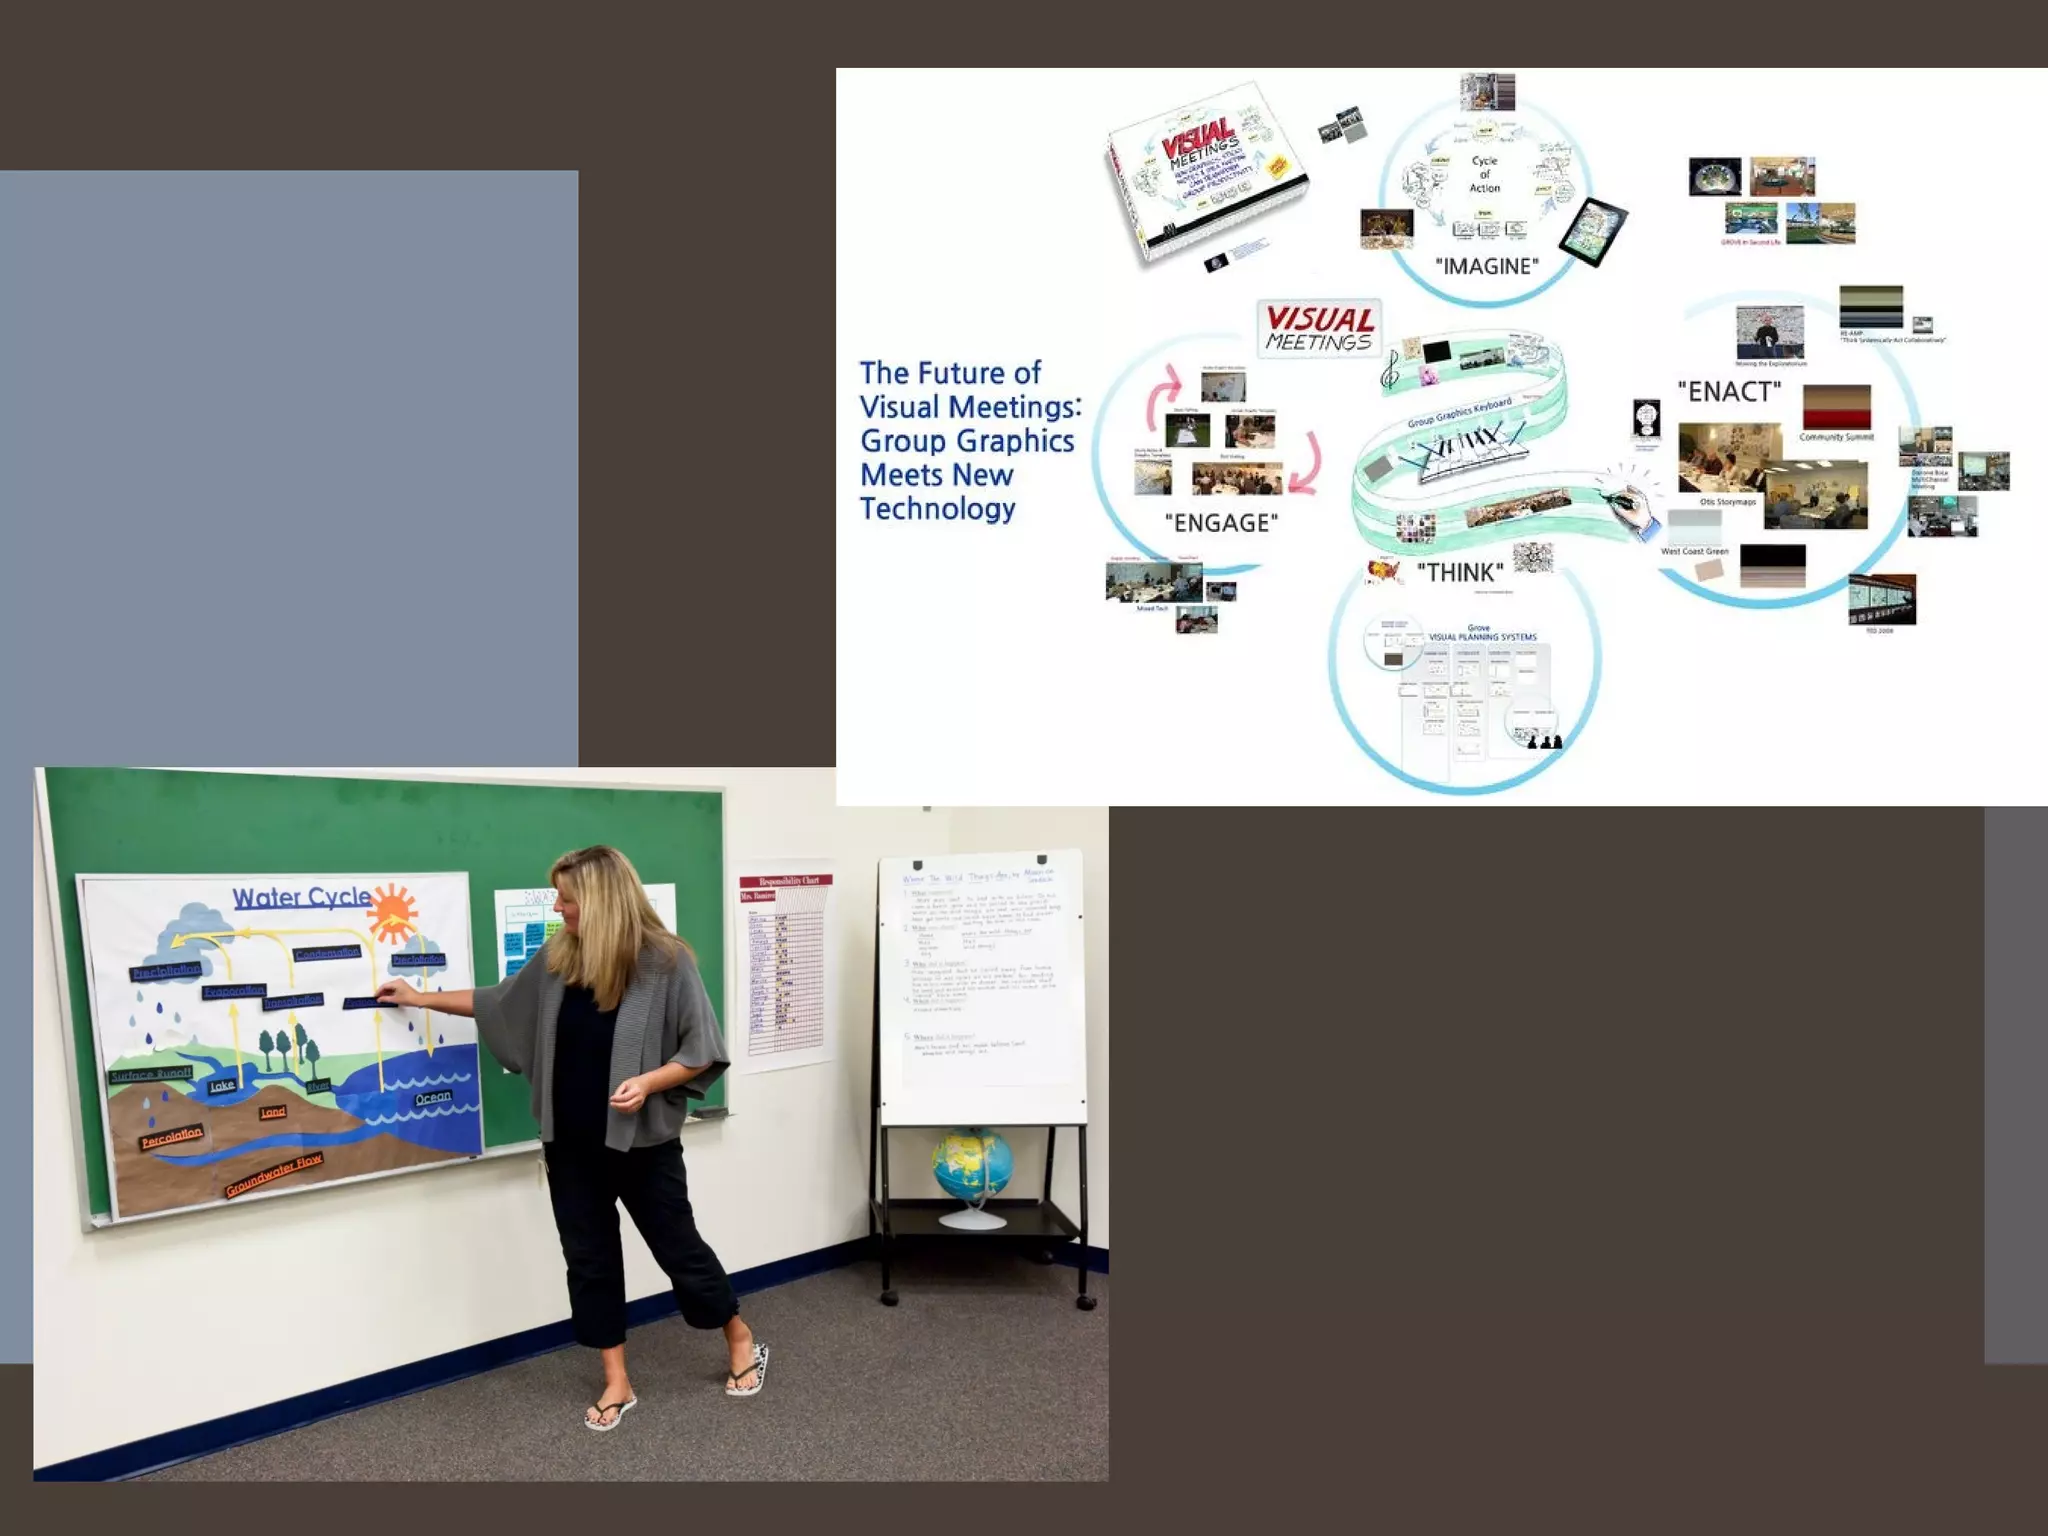
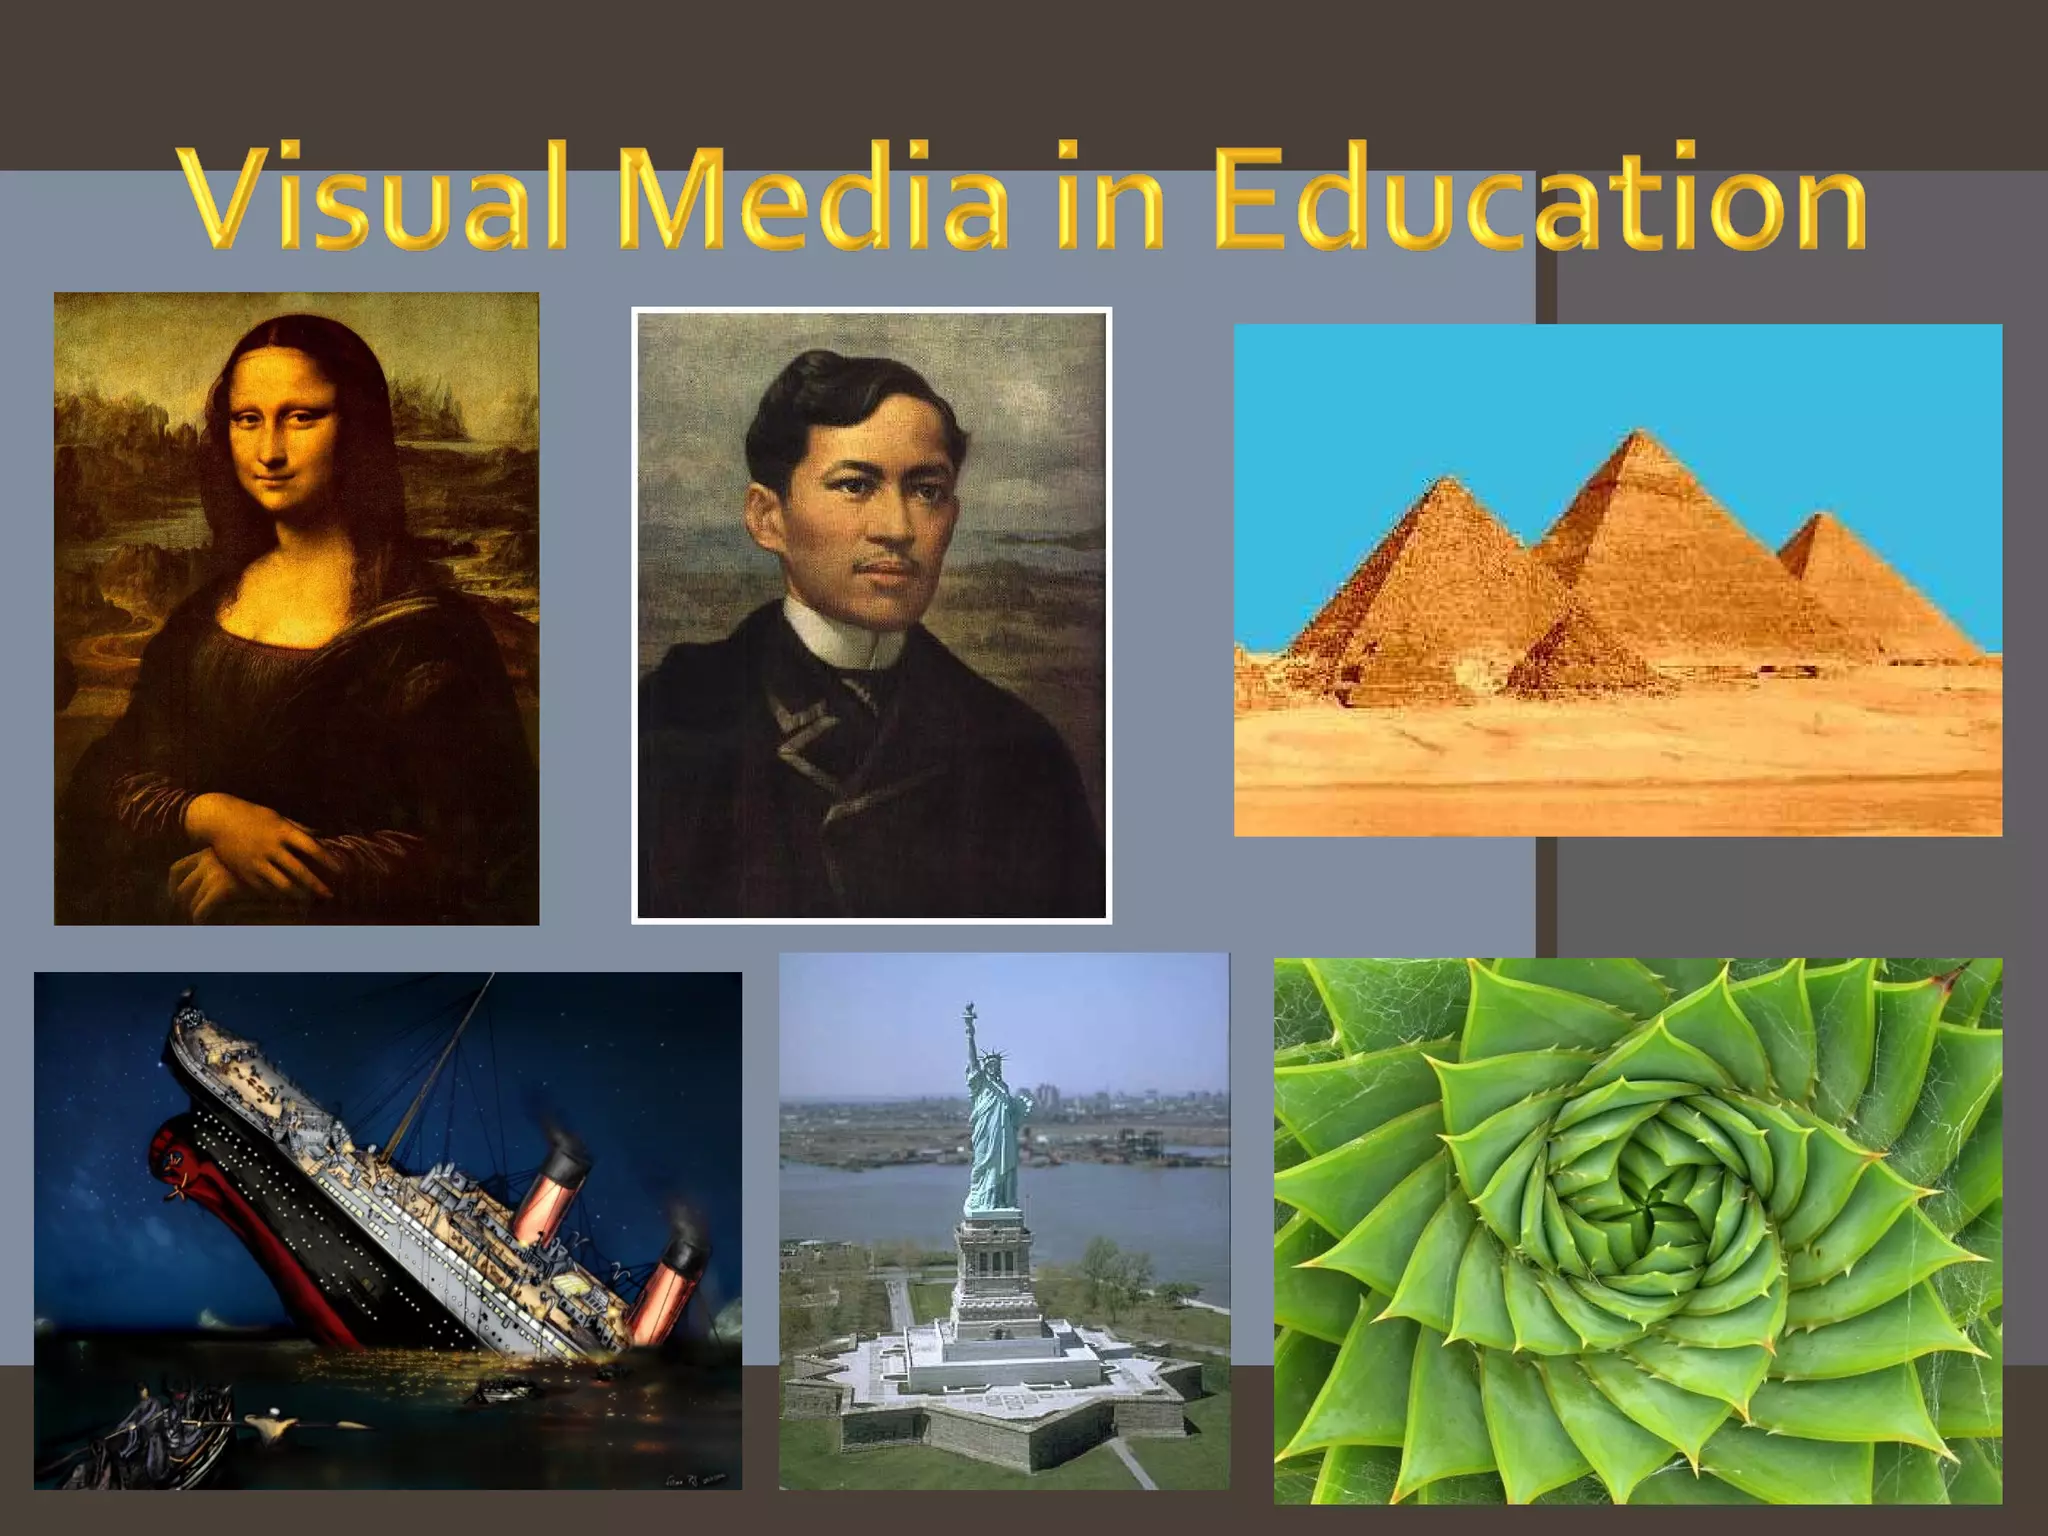
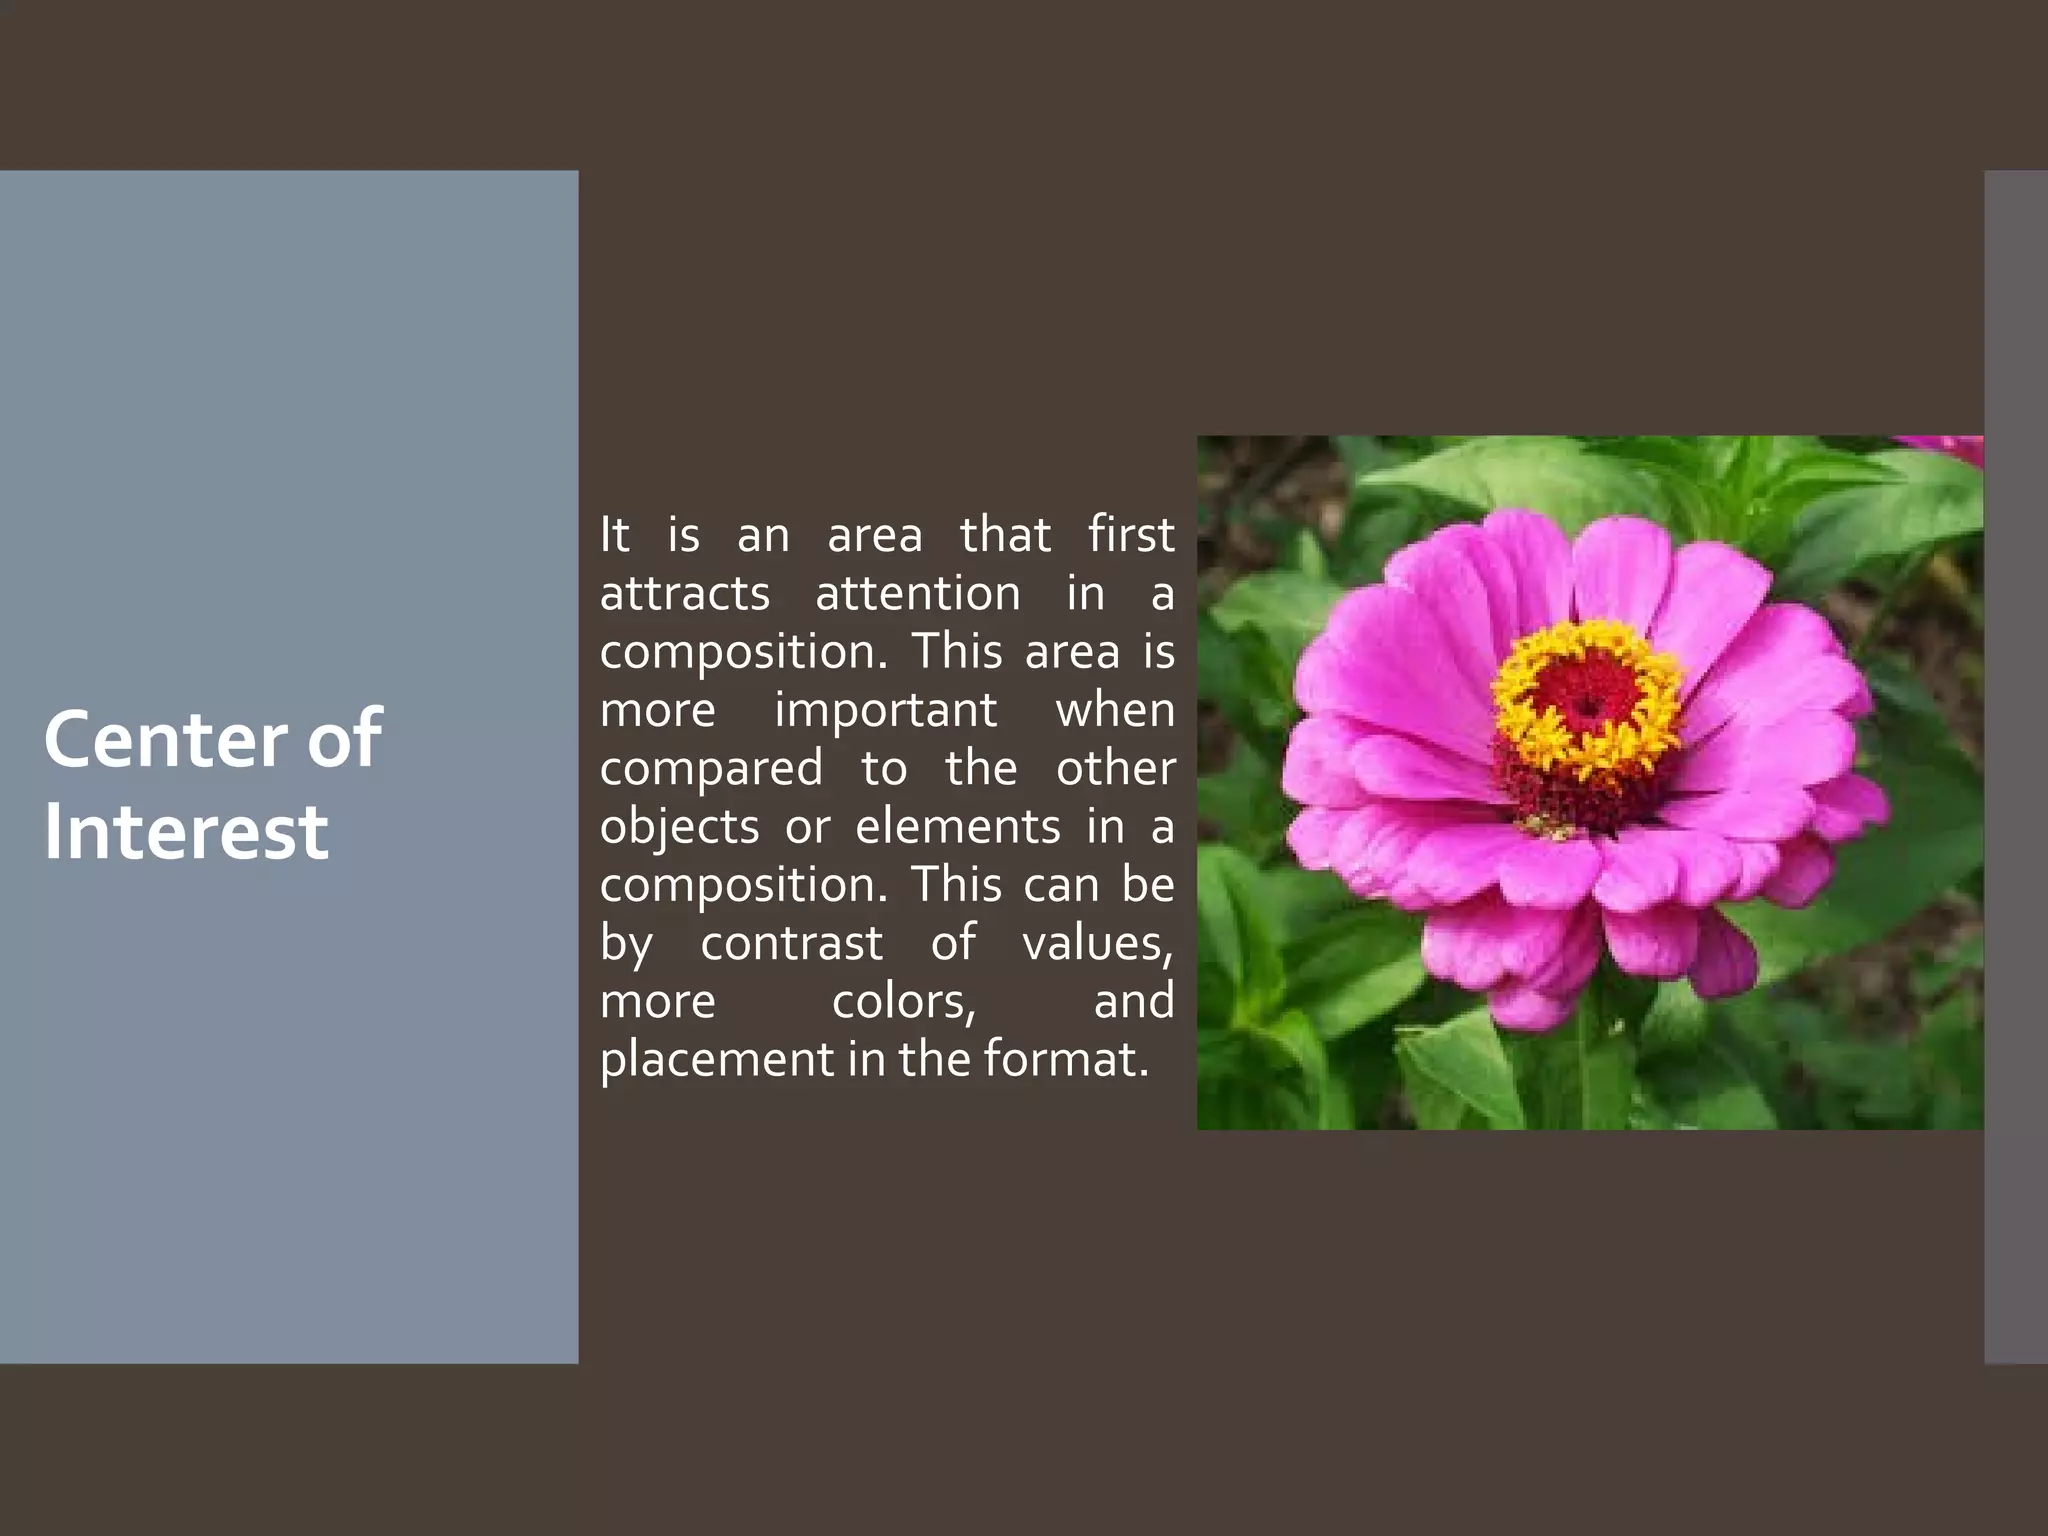
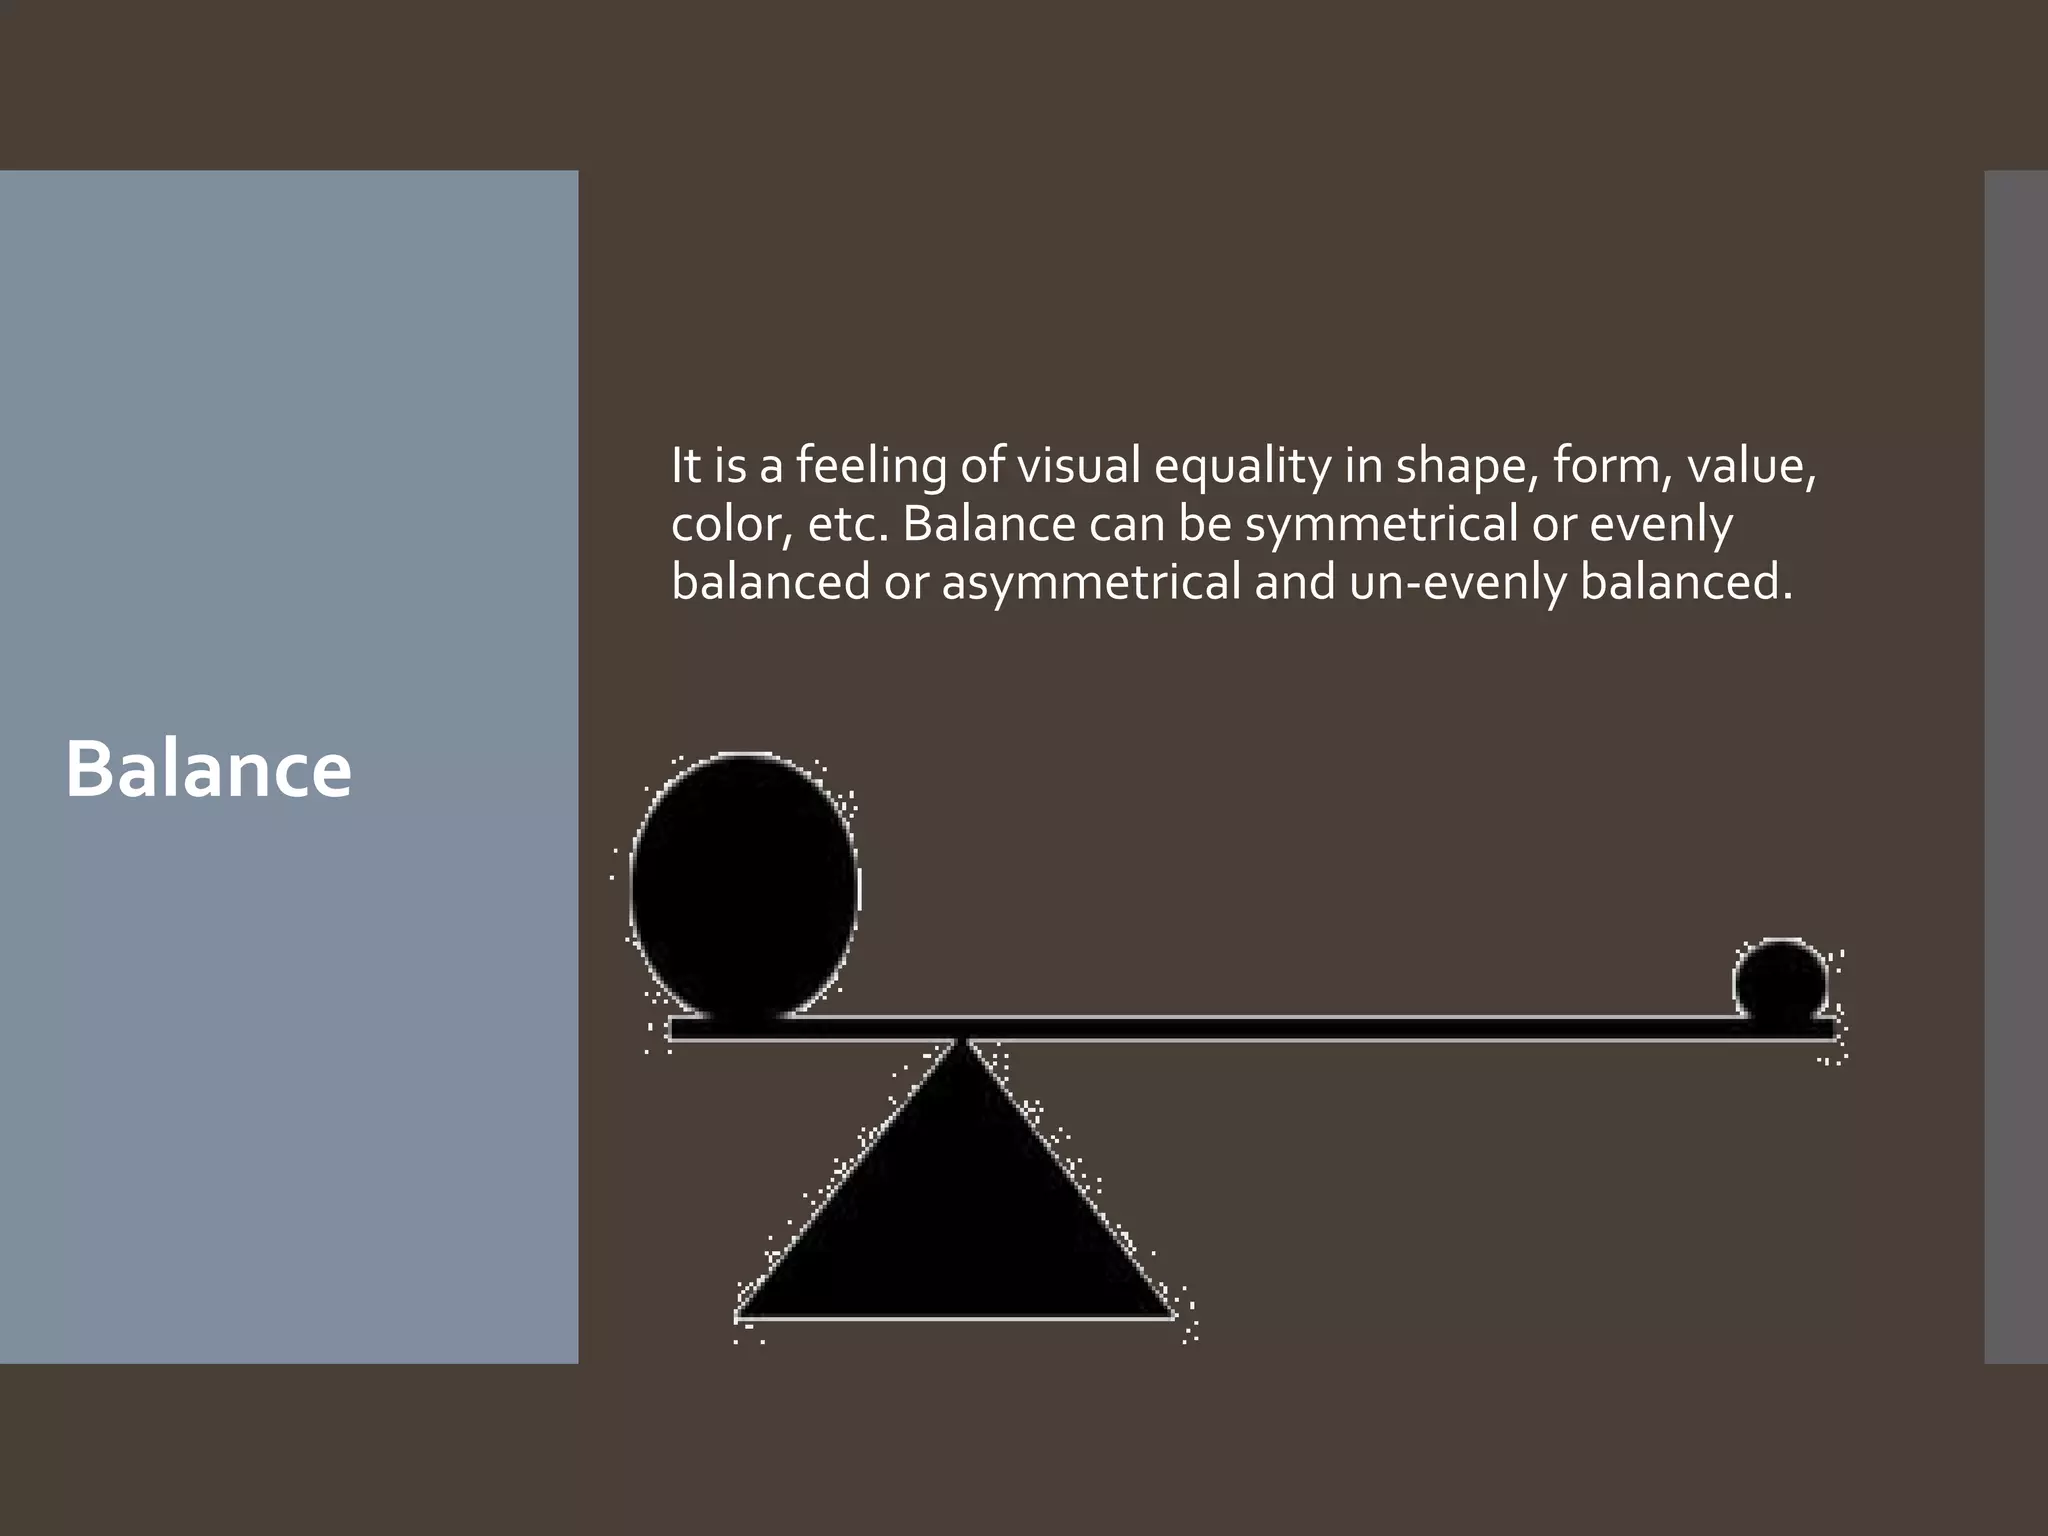
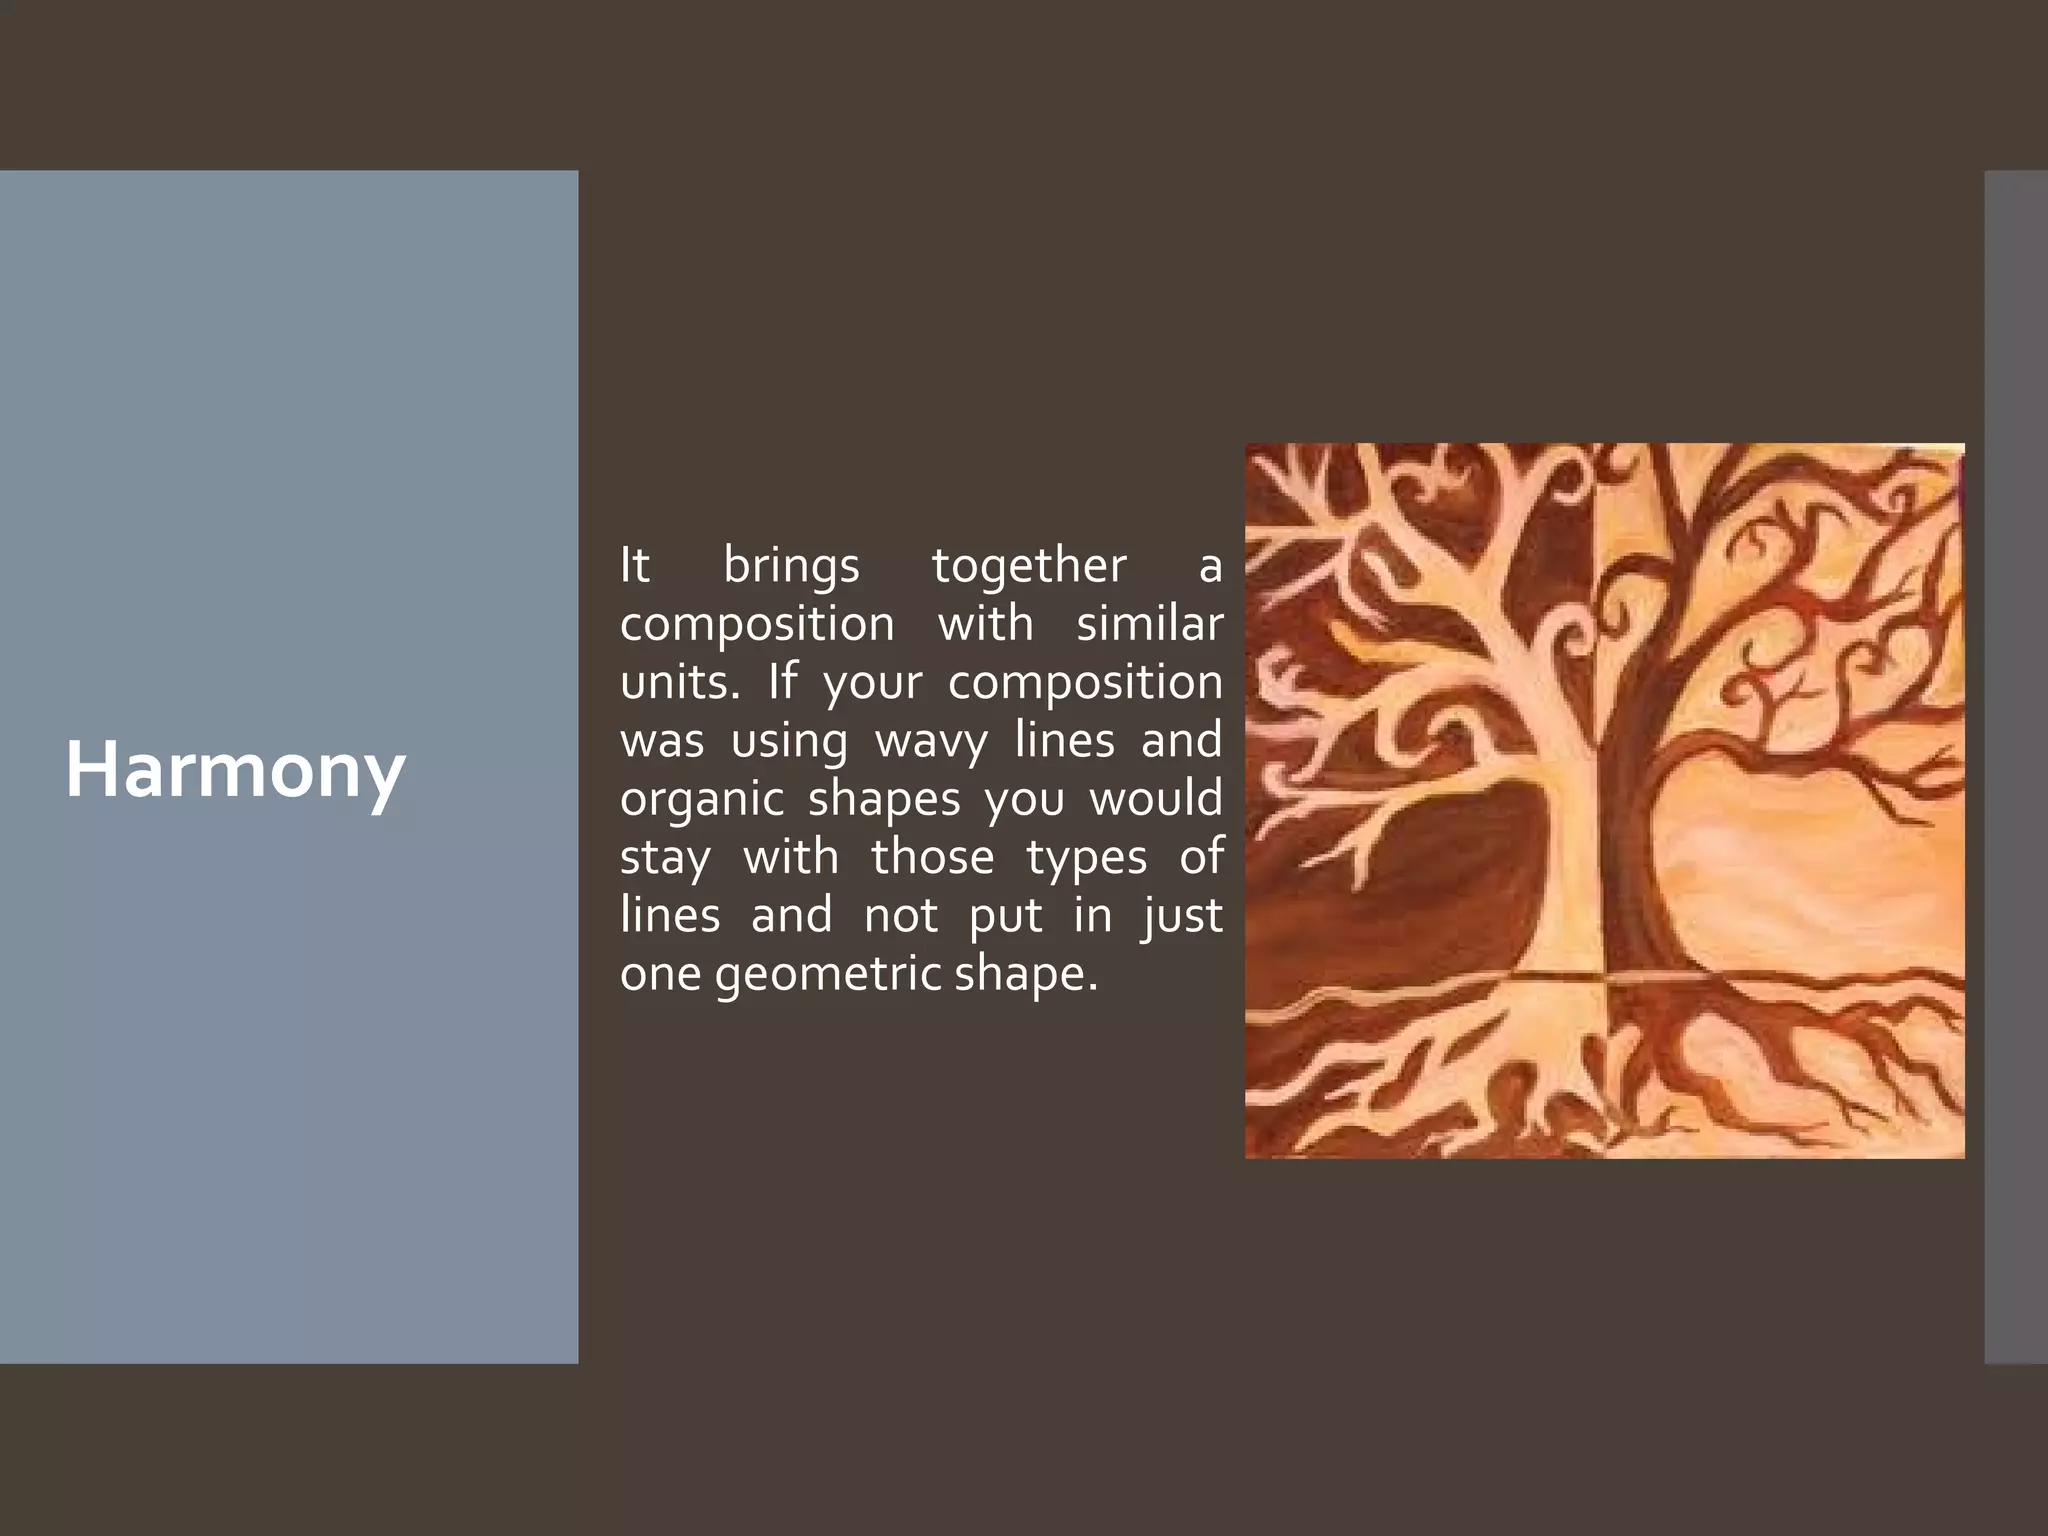
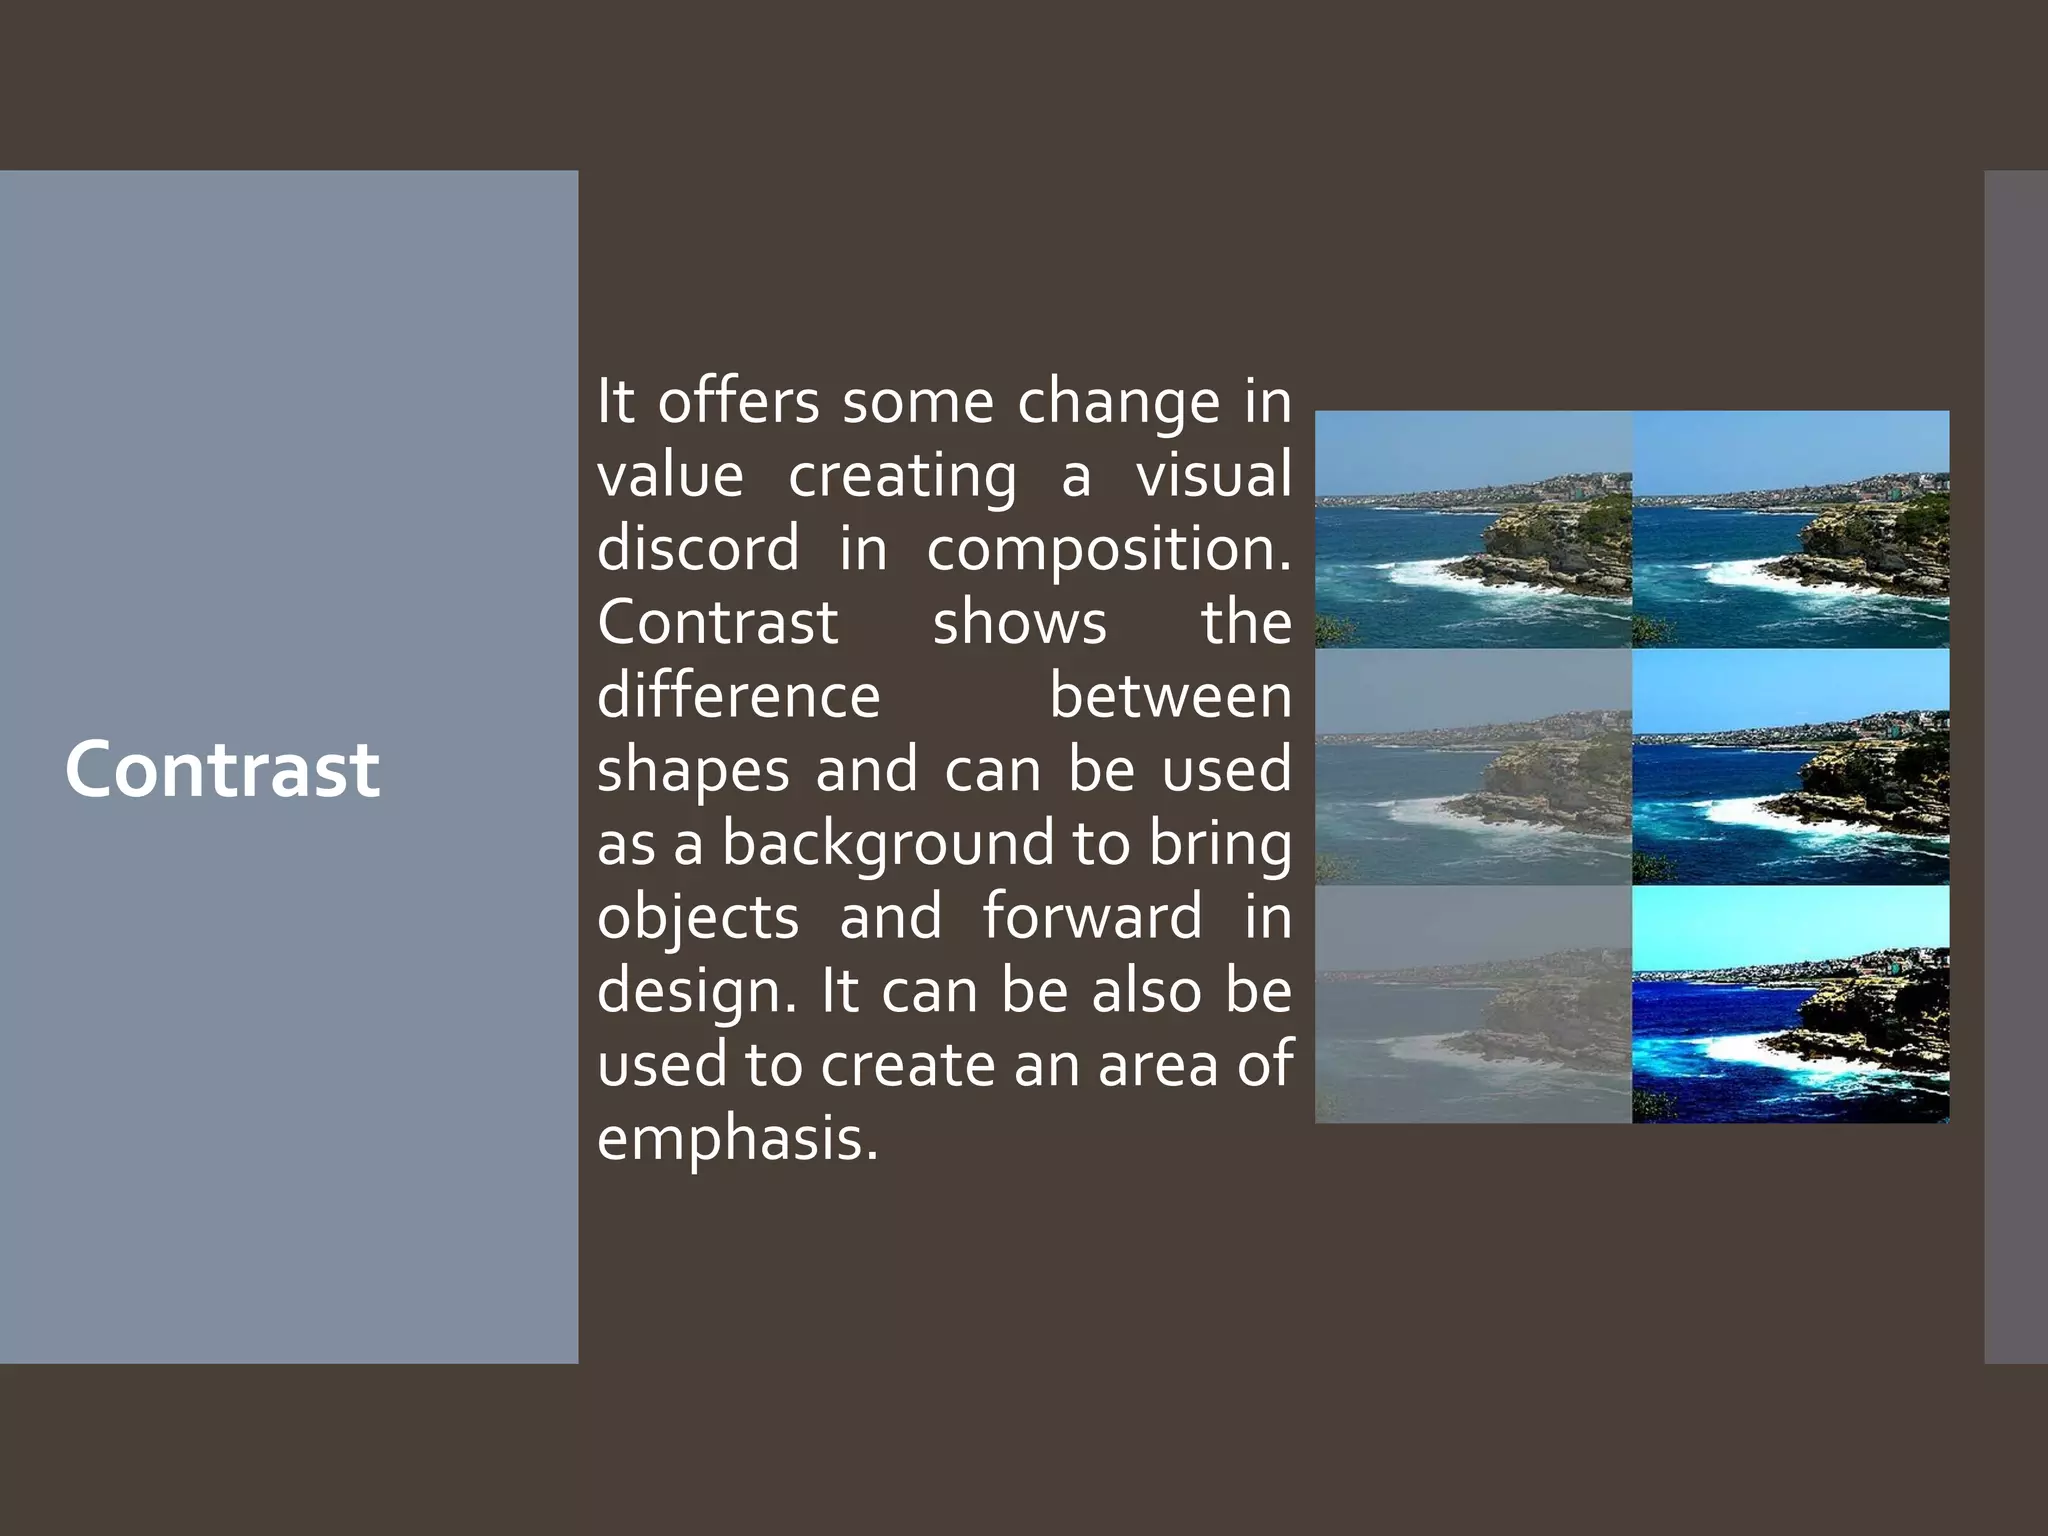
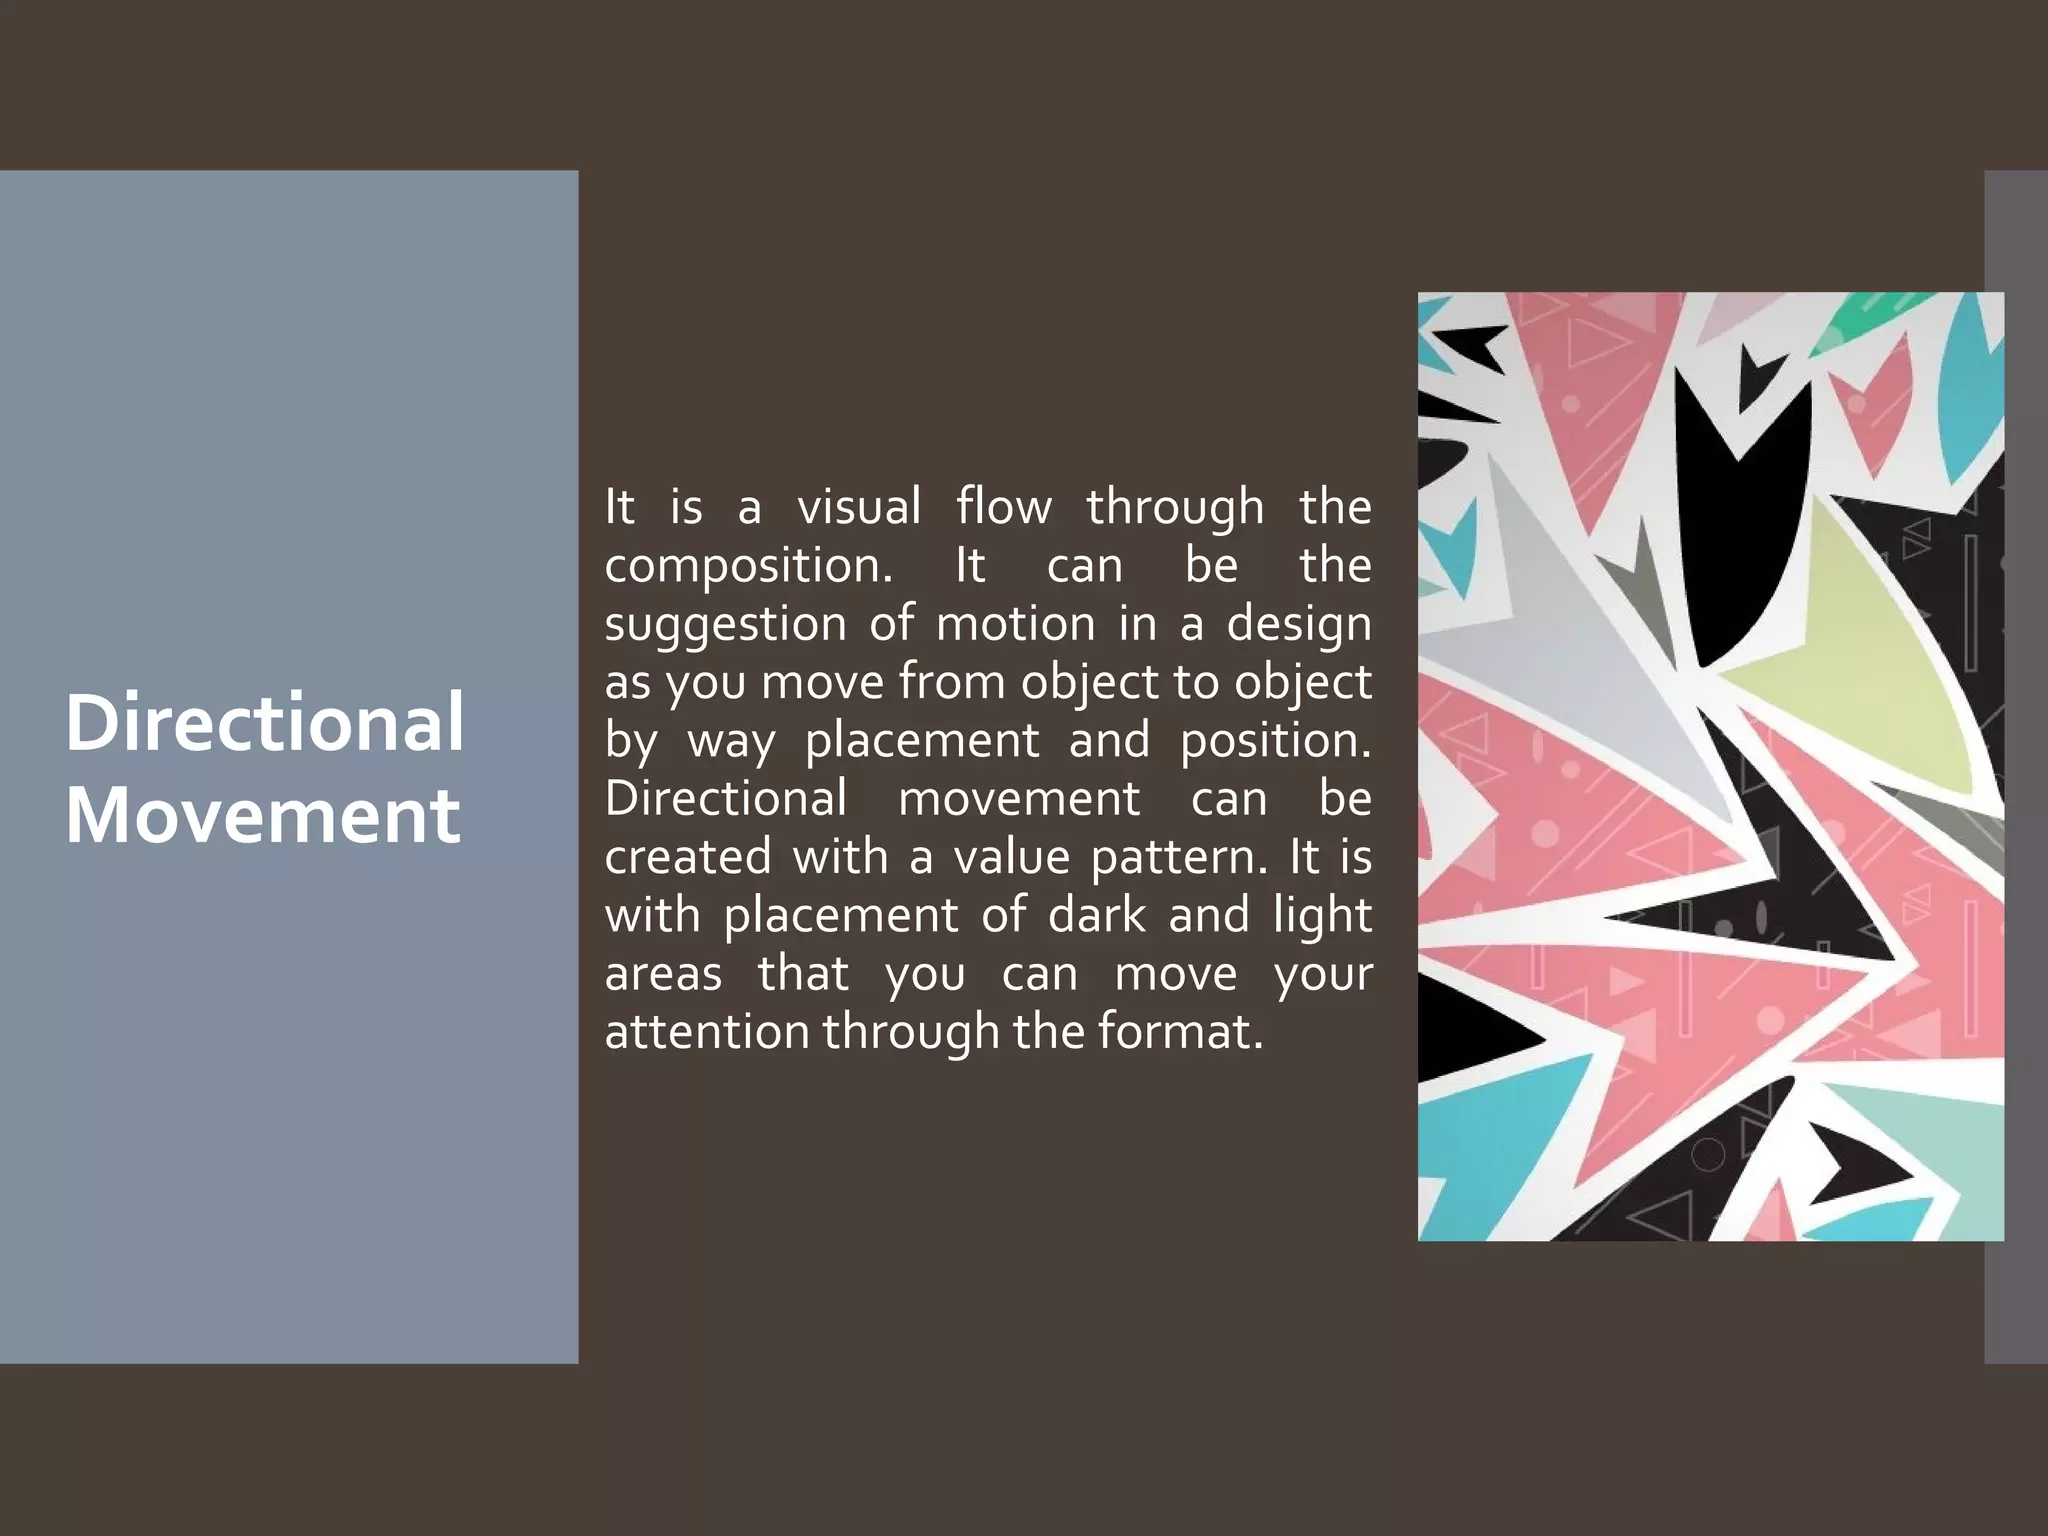
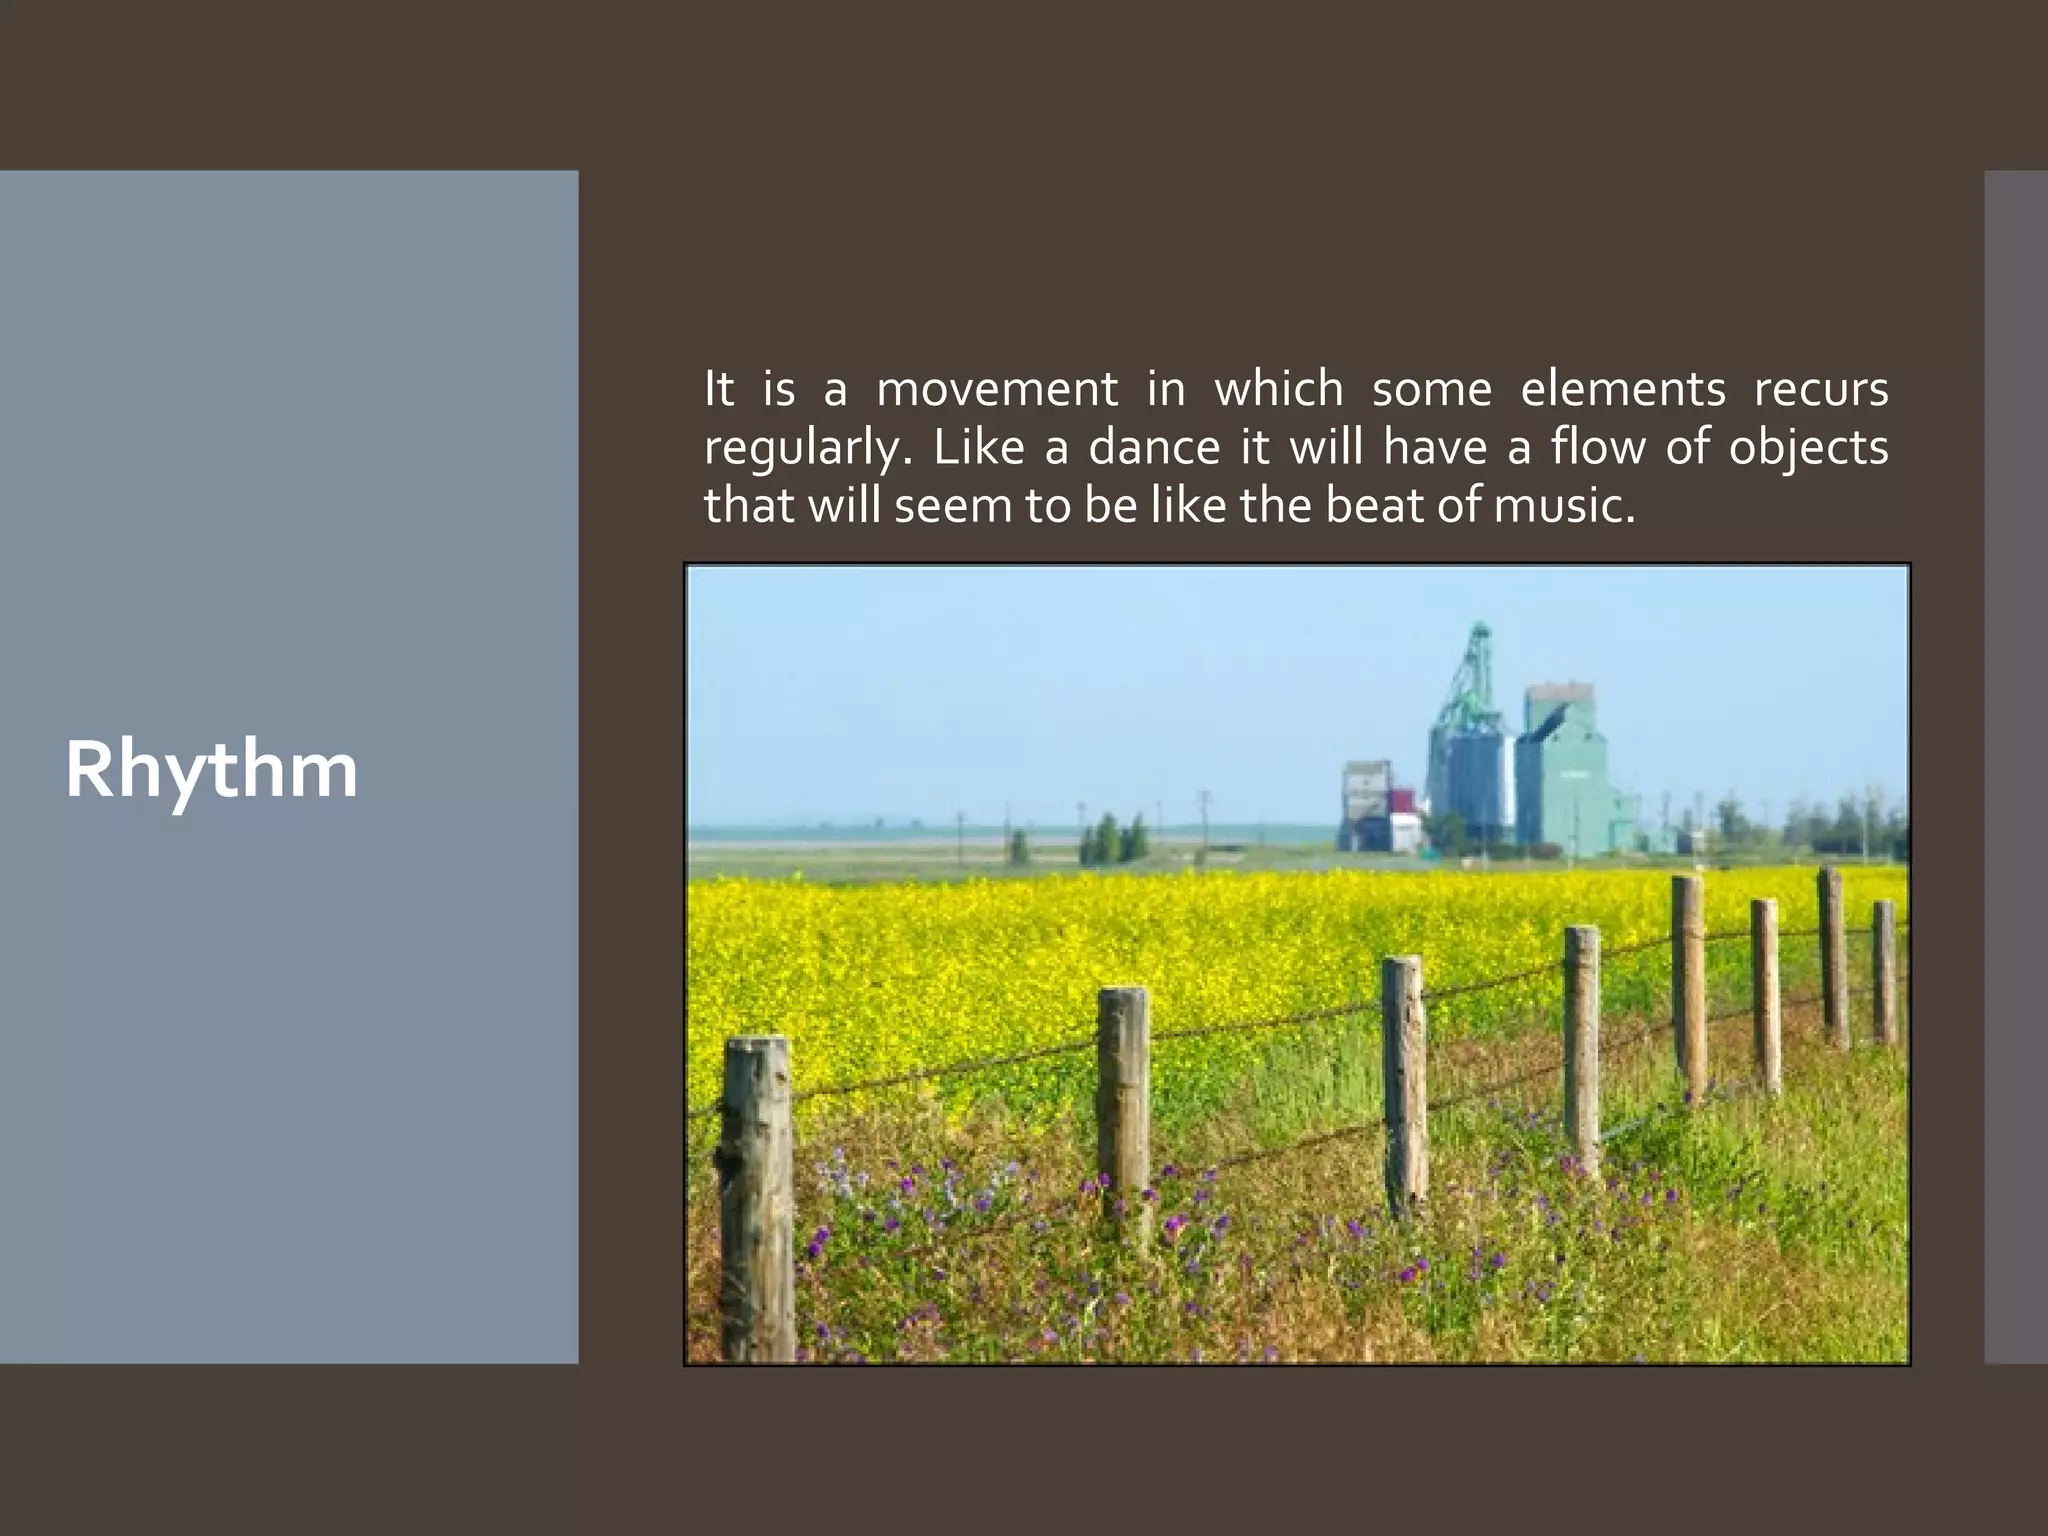
The use of visual media in education is also covered, including infographics, educational television, presentations, and videos. Principles of compositional design like center of interest, balance, harmony, contrast, direction
People Media ( Media and Information Literacy for Grade 11)Reah_dulana
A lesson about Media and Information Literacy that talks about people as the main source of communication. It is comprises with Print media, Radio media, TV media, Web media, and Instructional media. This PowerPoint could help the students to understand the lesson briefly.
Media and Information Literacy (MIL)- Visual Information and Media (Part 1)Arniel Ping
Learning Competencies:
1. define visual information and visual media (SSHS);
2. discuss the purpose and importance of visual media (SSHS);
3. describe the different dimensions of visual information and media (MIL-11/12VIM-IVc-7);
4. discuss the elements of visual design (SSHS);
5. comprehend how visual information and media is/are formally and informally produced, organized and disseminated (MIL11/12-VIM-IVc-8); and
6. evaluate the reliability and validity of visual information and media and its/ their sources using selection criteria (MIL11/12-VIM-IVc-9).
Topic Outline
I- VISUAL INFORMATION AND MEDIA
A. Definition
B. Purpose and Importance
C. Types and Formats
D. Visual Design Elements
Media and Information Literacy (MIL)- Visual Information and Media (Part 2)Arniel Ping
Learning Competencies:
1. discuss visual design principles (SSHS);
2. identify and evaluate visual design principles used in different visual media (SSHS); and
3. produce and evaluates a creative visual-based presentation using design principles and elements (MIL11/12-VIM-IVc-10).
Topic Outline
I- Visual Information and Media
A. Visual Design Principles
Manipulatives/Interactive Media InformationJoace Gayrama
DESCRIBE THE DIFFERENT DIMENSIONS OF MANIPULATIVES / INTERACTIVE MEDIA
Interactive Media – a method of communication in which the program's outputs depend on the user's inputs, and the user's inputs in turn affect the program's outputs. Interactive media engage the user and interact with him or her in a way that non-interactive media do not. Websites and video games are two common types of interactive media.
Interactivity – the communication process that takes place between humans and computer software. The most constant form of interactivity is typically found in games, which need a continuous form of interactivity with the gamer. Database applications and other financial, engineering and trading applications are also typically very interactive.
One area where interactivity is most useful is in online training. Interactivities in this area allow learners to interact with the course in terms of action and/or thinking.
Media and Information Literacy (MIL) - 11. People MediaArniel Ping
11. Media and Information Literacy (MIL) - People Media
Learning Competencies
Students will be able to…
cite studies showing proofs of positive and negative effects of media, information on individual and society (MIL11/12PM-IVa-1);
describe the different dimensions of people media (MIL11/12PM-IVa-1); and
categorize different examples of people and state reasons for such categorization (MIL11/12PM-IVa-2).
Content
A. People as Media and People in Media
1. Definition
2. Characteristics
3. Format and Types
4. Advantages and Limitations
5. Value
6. Others
Media and Information Literacy (MIL) - 10. Media and Information Literate Ind...Arniel Ping
Content
10. Media and Information Literate Individual
a. Improved Quality of Life
b. Greater Political Participation
c.Better Economic Opportunities
d. Improved Learning Environment
e. More Cohesive Social Units
Learning Competency
1. Students will be able to synthesize the overall implication of media and information to an individual (personal, professional, educational, and others) and the society as a whole (economic, social, political, educational, and others) MIL11/12MILI-IIIj-29
Media and Information Literacy (MIL) - 8. Opportunities ,Challenges, and Powe...Arniel Ping
Content
8. Opportunities, Challenges, and Power of Media and Information
a. Economic, Educational,
Social, and Political
b. Threats, Risks, Abuse, and
Misuse
Learning Competencies
The students will be able to…
1. realize opportunities and challenges in media and information (MIL11/12OCP-IIIh-24);
2. create infographics showing opportunities and challenges in media and information (SSHS); and
3. research and cite recent examples of the power of media and information to affect change (MIL11/12OCP-IIIh-25)
CHARACTERISTICS OF AURAL AND AUDIO MEDIAAreeba Wajid
This presentation is developed by the students of B.S Final year under the supervision of Madam Rizvana Faseel, Chairperson of Department of Education University of Karachi.
It was a class project and this presentation was developed by a group of students.
Storyboarding for Data Visualization Designspatialhistory
This is derived from a lecture given by Frederico Freitas at the Spatial History Project / Center for Spatial and Textual Analysis at Stanford University. It describes how the process of storyboarding helps clarify design intent and facilitates design decision-making.
Data Visualisation Design Workshop #UXbneCam Taylor
In this workshop we’ll explore both the art and science of communicating information graphically in the digital world.
With lots of great examples and a hands-on team exercise, the session is intended to make us think about how we can convey information more clearly and efficiently in our apps, presentations, reports, emails and other forms of communication.
Data visualization is an interdisciplinary field that deals with the graphic representation of data. It is a particularly efficient way of communicating when the data is numerous as for example a time series.
MEDIA AND INFORMATION LITERACY (MIL)
LESSON 11 : VISUAL GRAPHICS DESIGN
Learning Objective:
Evaluate existing Web sites and online resources based on the principles of layout, graphic, and visual message design.
Use image manipulation techniques on existing images to change or enhance their current state to communicate a message for a specific purpose.
Create an original or derivative ICT content to effectively communicate a visual message in an online environment related to specific professional tracks.
Manipulate text, graphics, and images to create ICT content intended for an online environment.
CSUN 2023 Automated Descriptions 3 March 2023 TG.pptxTed Gies
Highcharts is a world leading provider of accessible charting tools for the web, used by 80 of the top 100 Fortune companies. Recently Highcharts and global publishing company Elsevier’s Digital Accessibility Team collaborated to provide better accessibility for line charts with large datasets. Line charts are often used to visualize datasets with thousands of data points. This presents a challenge for non-visual access, as providing access to individual data points is not sufficient. A reader of a line chart with a large amount of data will aim to extract information about trends, patterns, and outliers from the chart. Can we make this information more accessible by communicating it through text and sound? What is the most intuitive way to experience this data through sound? And to which extent can we automate the text description? Human authored text descriptions of charts are historically difficult to beat, but can in many cases be impractical – such as where data is dynamically loaded in real-time. Automated text descriptions can also be designed to be more objective and less prone to biases. Will users be able to trust these descriptions? Will they still prefer those created by a human? With each of the new accessibility research questions we will provide user feedback from non-sighted users on our approaches. We will share findings about best practices, and show screen reader demos to help illustrate design considerations.
How to Create Map Views in the Odoo 17 ERPCeline George
The map views are useful for providing a geographical representation of data. They allow users to visualize and analyze the data in a more intuitive manner.
This is a presentation by Dada Robert in a Your Skill Boost masterclass organised by the Excellence Foundation for South Sudan (EFSS) on Saturday, the 25th and Sunday, the 26th of May 2024.
He discussed the concept of quality improvement, emphasizing its applicability to various aspects of life, including personal, project, and program improvements. He defined quality as doing the right thing at the right time in the right way to achieve the best possible results and discussed the concept of the "gap" between what we know and what we do, and how this gap represents the areas we need to improve. He explained the scientific approach to quality improvement, which involves systematic performance analysis, testing and learning, and implementing change ideas. He also highlighted the importance of client focus and a team approach to quality improvement.
Model Attribute Check Company Auto PropertyCeline George
In Odoo, the multi-company feature allows you to manage multiple companies within a single Odoo database instance. Each company can have its own configurations while still sharing common resources such as products, customers, and suppliers.
The Indian economy is classified into different sectors to simplify the analysis and understanding of economic activities. For Class 10, it's essential to grasp the sectors of the Indian economy, understand their characteristics, and recognize their importance. This guide will provide detailed notes on the Sectors of the Indian Economy Class 10, using specific long-tail keywords to enhance comprehension.
For more information, visit-www.vavaclasses.com
The French Revolution, which began in 1789, was a period of radical social and political upheaval in France. It marked the decline of absolute monarchies, the rise of secular and democratic republics, and the eventual rise of Napoleon Bonaparte. This revolutionary period is crucial in understanding the transition from feudalism to modernity in Europe.
For more information, visit-www.vavaclasses.com
Instructions for Submissions thorugh G- Classroom.pptxJheel Barad
This presentation provides a briefing on how to upload submissions and documents in Google Classroom. It was prepared as part of an orientation for new Sainik School in-service teacher trainees. As a training officer, my goal is to ensure that you are comfortable and proficient with this essential tool for managing assignments and fostering student engagement.
3. What is
Visual
Media?
Sources of data or information in the form of visual
representations.
Abstractions, analogues, rough illustrations, or
digital reproductions of the objects the data
pertains to.
4. What is
Visual
Media?
Requires interpretation of the data gatherer
Level of reliability compared to other sources may
vary considerably
5. What is
Visual
Media?
May be hosted on the internet, printed in
publications, displayed through broadcast media,
or otherwise disseminated.
Generally available or at least citable as stable and
traceable future references.
8. A mark on a surface that describes a shape of
outline
Line
Can create texture and can be thick or thin
Types of line include actual, implied, vertical,
horizontal, diagonal and contour lines.
12. Surface quality, either tactile of visual
Texture
Degree of roughness or smoothness in objects
Can be real or implied by different uses of media
16. 3-dimensional; has volume and thickness
Form
Illusion of 3D effect can be implied using light and
shading techniques
Can be viewed from many angles
54. Information graphics or infographics are graphic
visual representations of information, data or
knowledge. These graphics present complex
information quickly and clearly.
Infographic
An infographic (information graphic) is a
representation of information in a graphic format
designed to make the data easily understandable
at a glance. People use infographics to quickly
communicate a message, to simplify the
presentation of large amounts of data, to see data
patterns and relationships, and to monitor changes
in variables over time.
55.
56. Educational
Television
the use of television programs in the field
of distance education. It may be in the form of
individual television programs or
dedicated specialty channels
Enriches lessons through documentary-type
programs; or
Teaches content directly.
66. Principles of
Design
The principles of
design are the
recipe for a good
work of art. The
principles
combine
the
elements to an
aesthetic
placement
of
things that will
produce a good
design.
•
•
•
•
•
•
Center of Interest
Balance
Harmony
Contrast
Directional Movement
Rhythm
67. Center of
Interest
It is an area that first
attracts attention in a
composition. This area is
more important when
compared to the other
objects or elements in a
composition. This can be
by contrast of values,
more
colors,
and
placement in the format.
68. It is a feeling of visual equality in shape, form, value,
color, etc. Balance can be symmetrical or evenly
balanced or asymmetrical and un-evenly balanced.
Balance
69. Harmony
It brings together a
composition with similar
units. If your composition
was using wavy lines and
organic shapes you would
stay with those types of
lines and not put in just
one geometric shape.
70. Contrast
It offers some change in
value creating a visual
discord in composition.
Contrast shows the
difference
between
shapes and can be used
as a background to bring
objects and forward in
design. It can be also be
used to create an area of
emphasis.
71. Directional
Movement
It is a visual flow through the
composition. It can be the
suggestion of motion in a design
as you move from object to object
by way placement and position.
Directional movement can be
created with a value pattern. It is
with placement of dark and light
areas that you can move your
attention through the format.
72. It is a movement in which some elements recurs
regularly. Like a dance it will have a flow of objects
that will seem to be like the beat of music.
Rhythm