Download to read offline
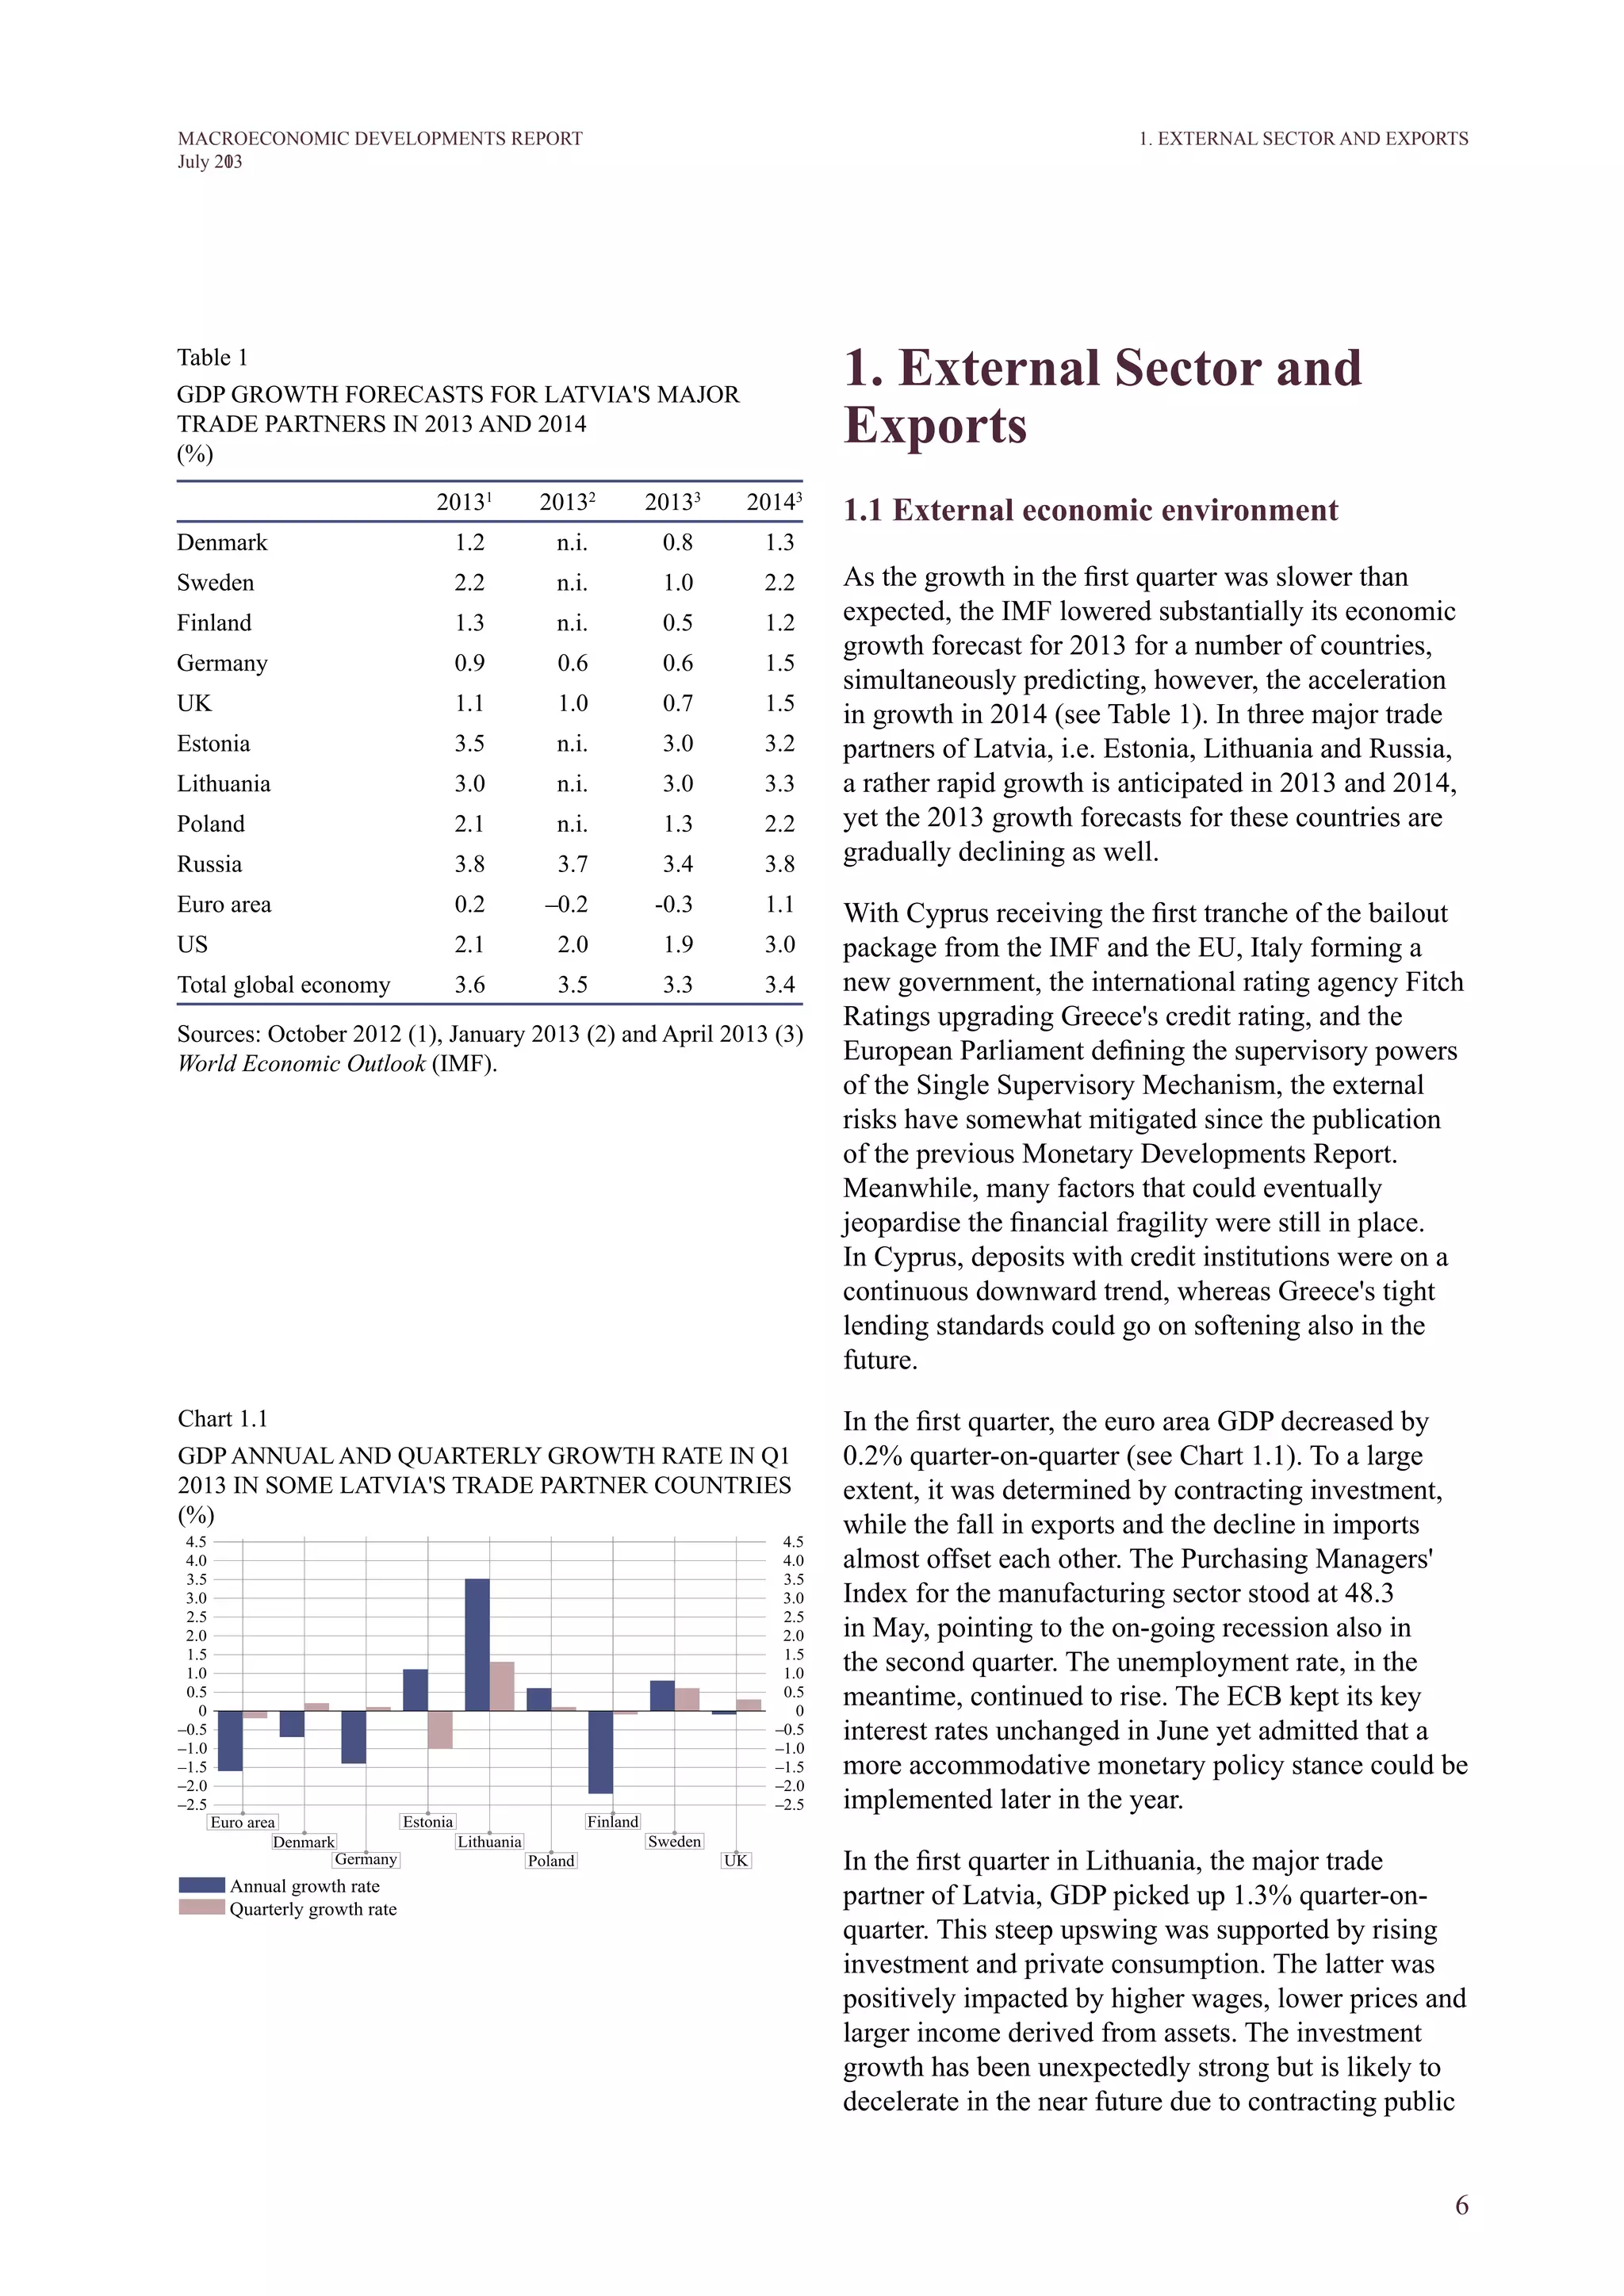
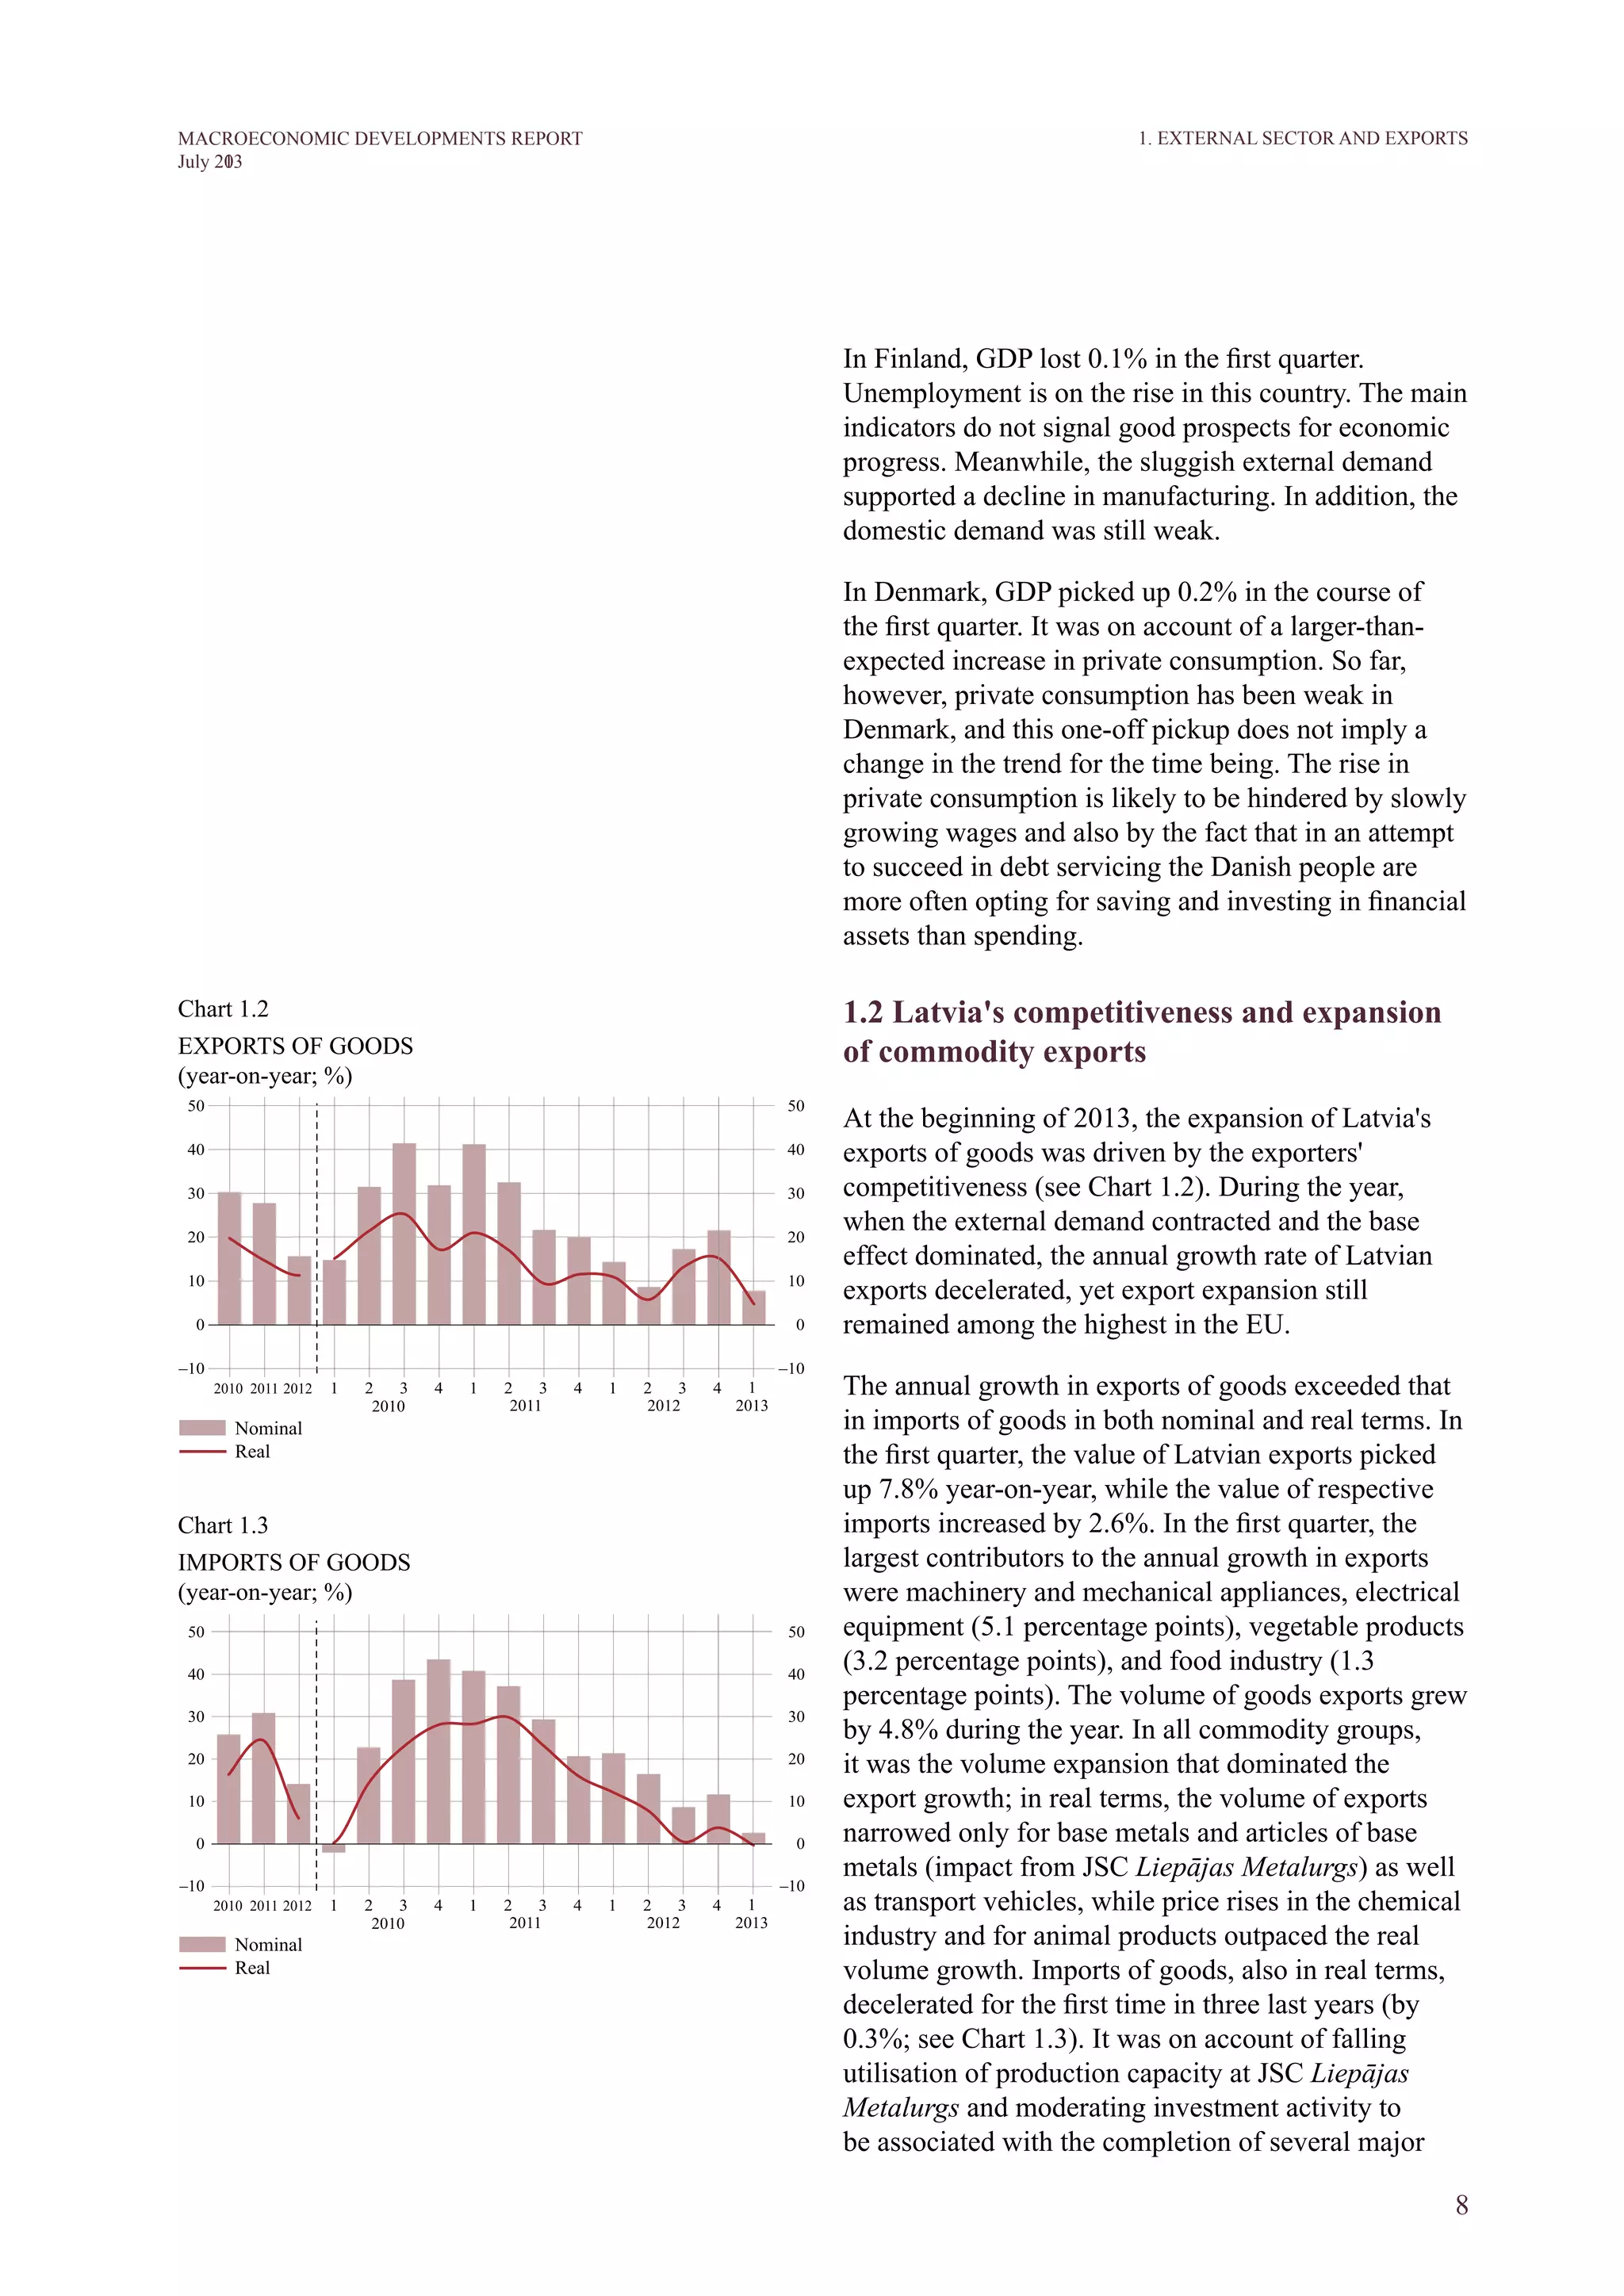
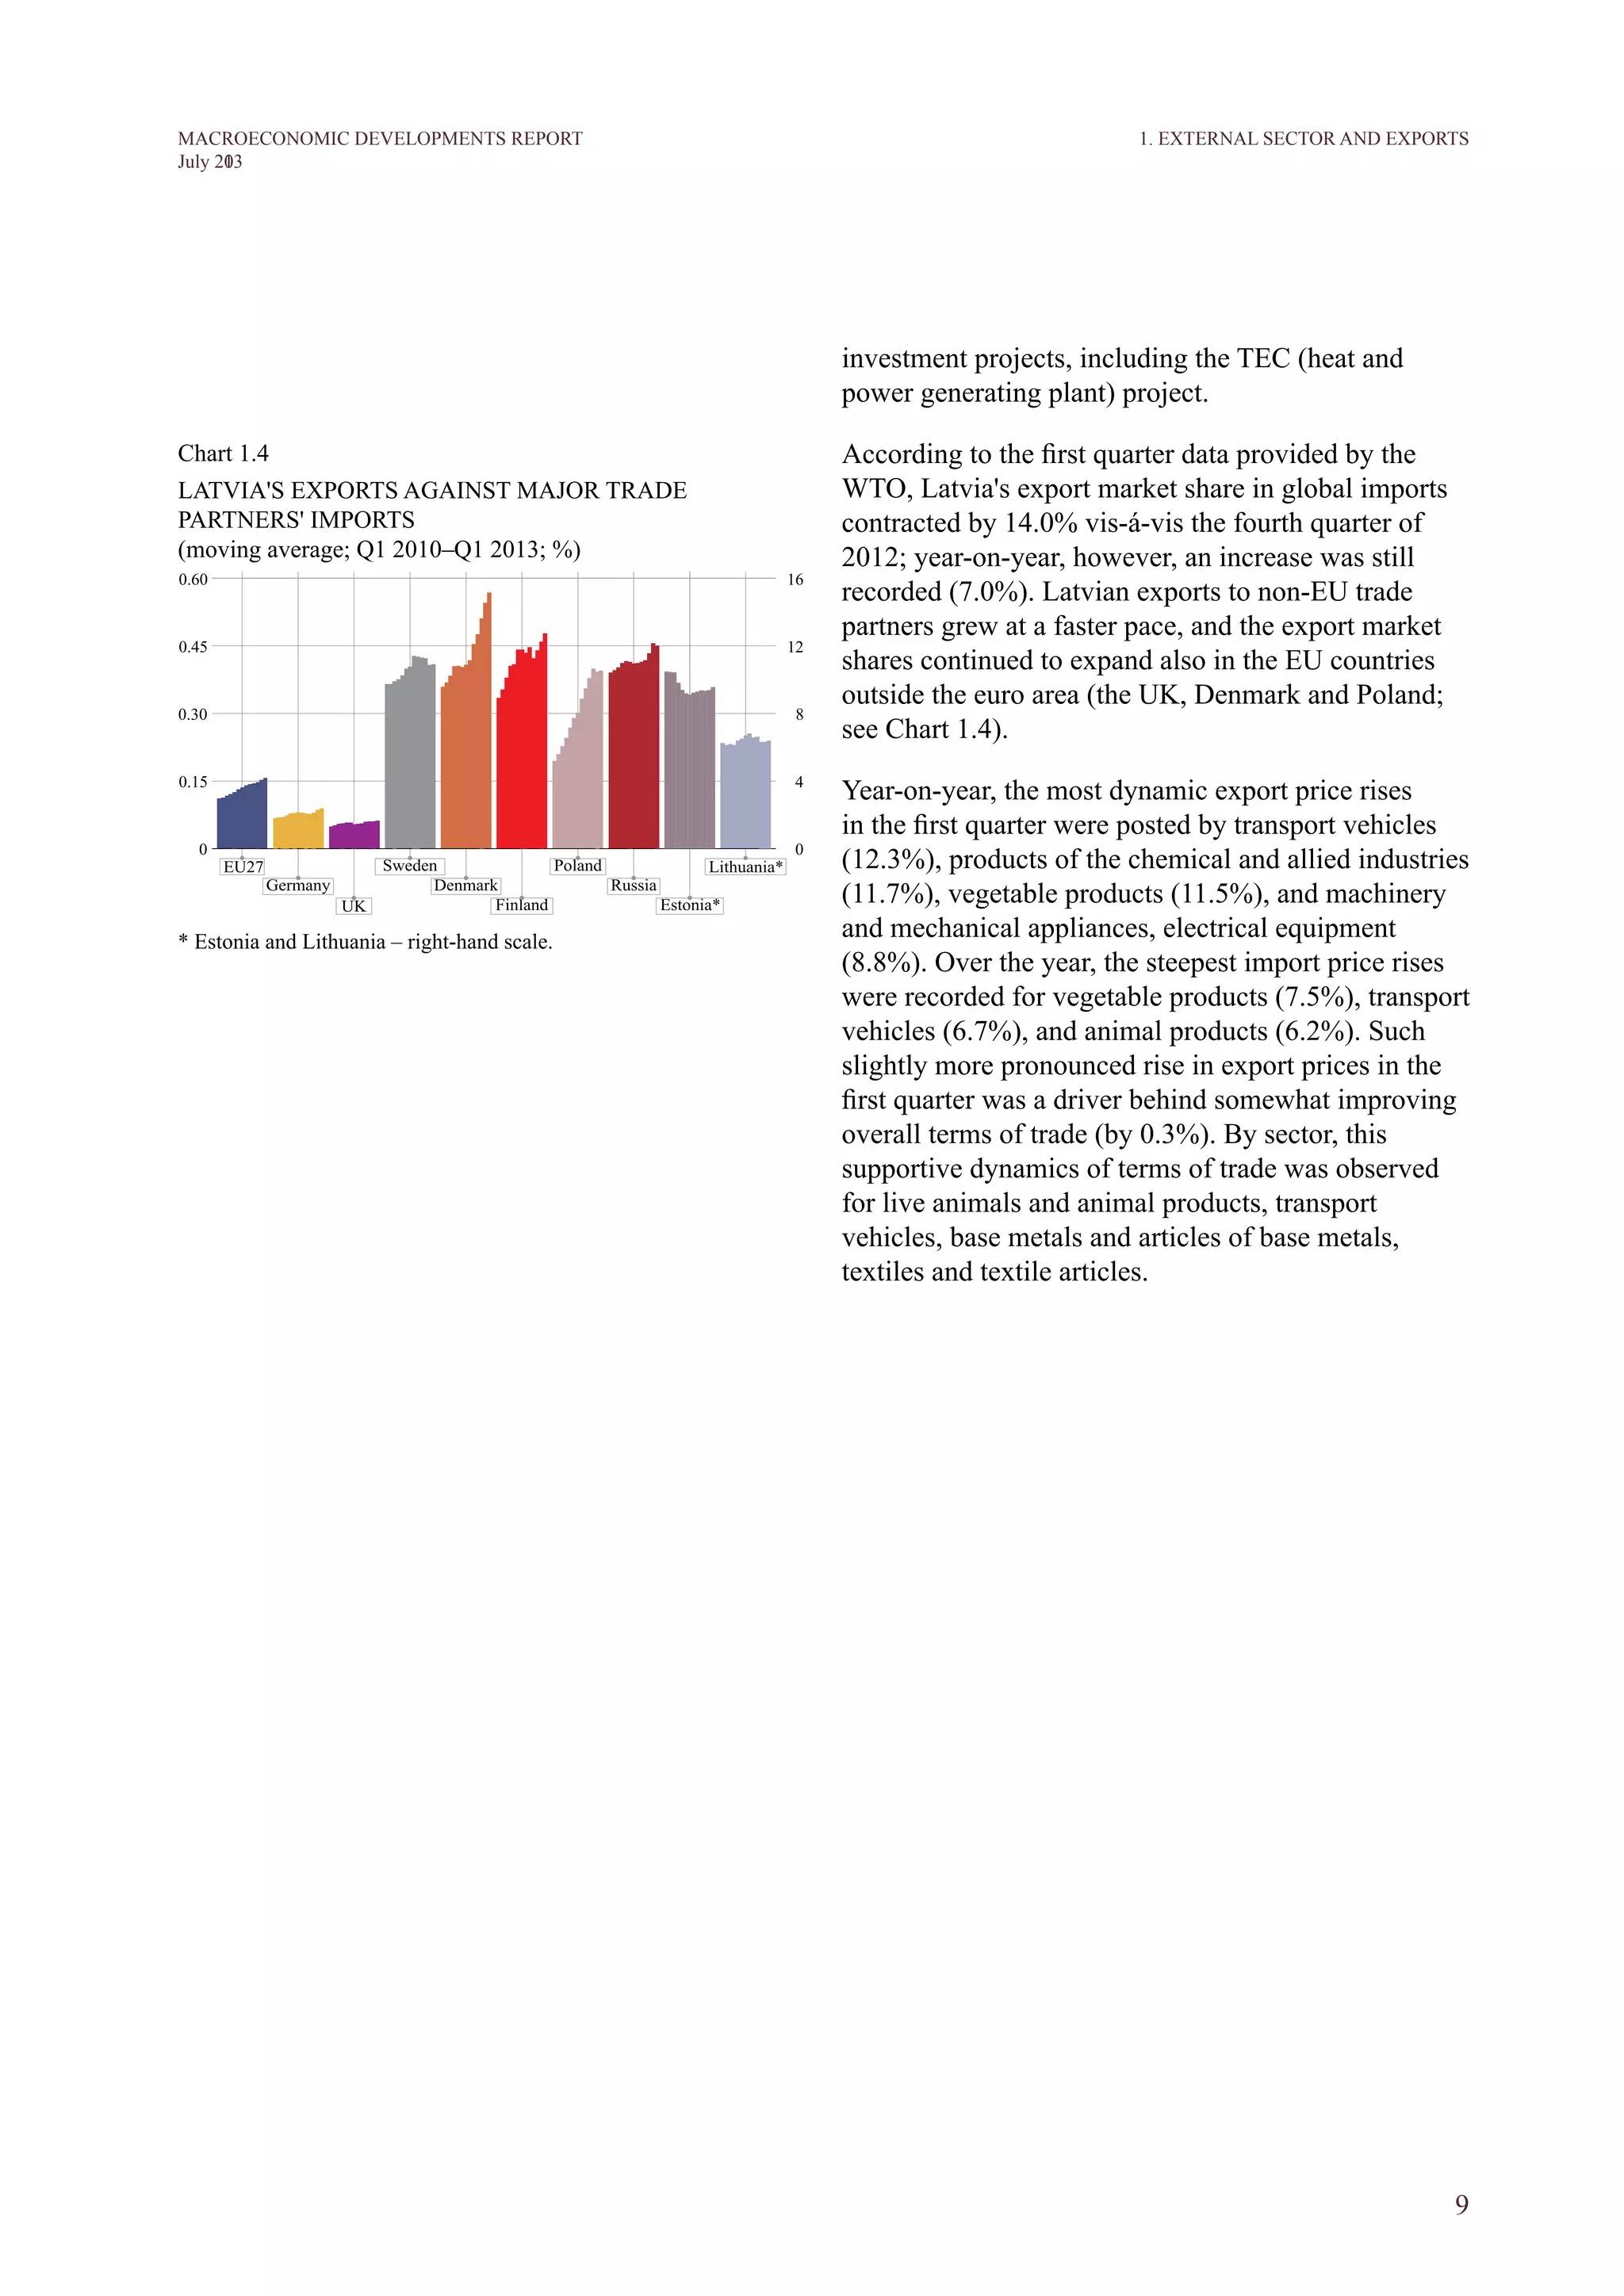
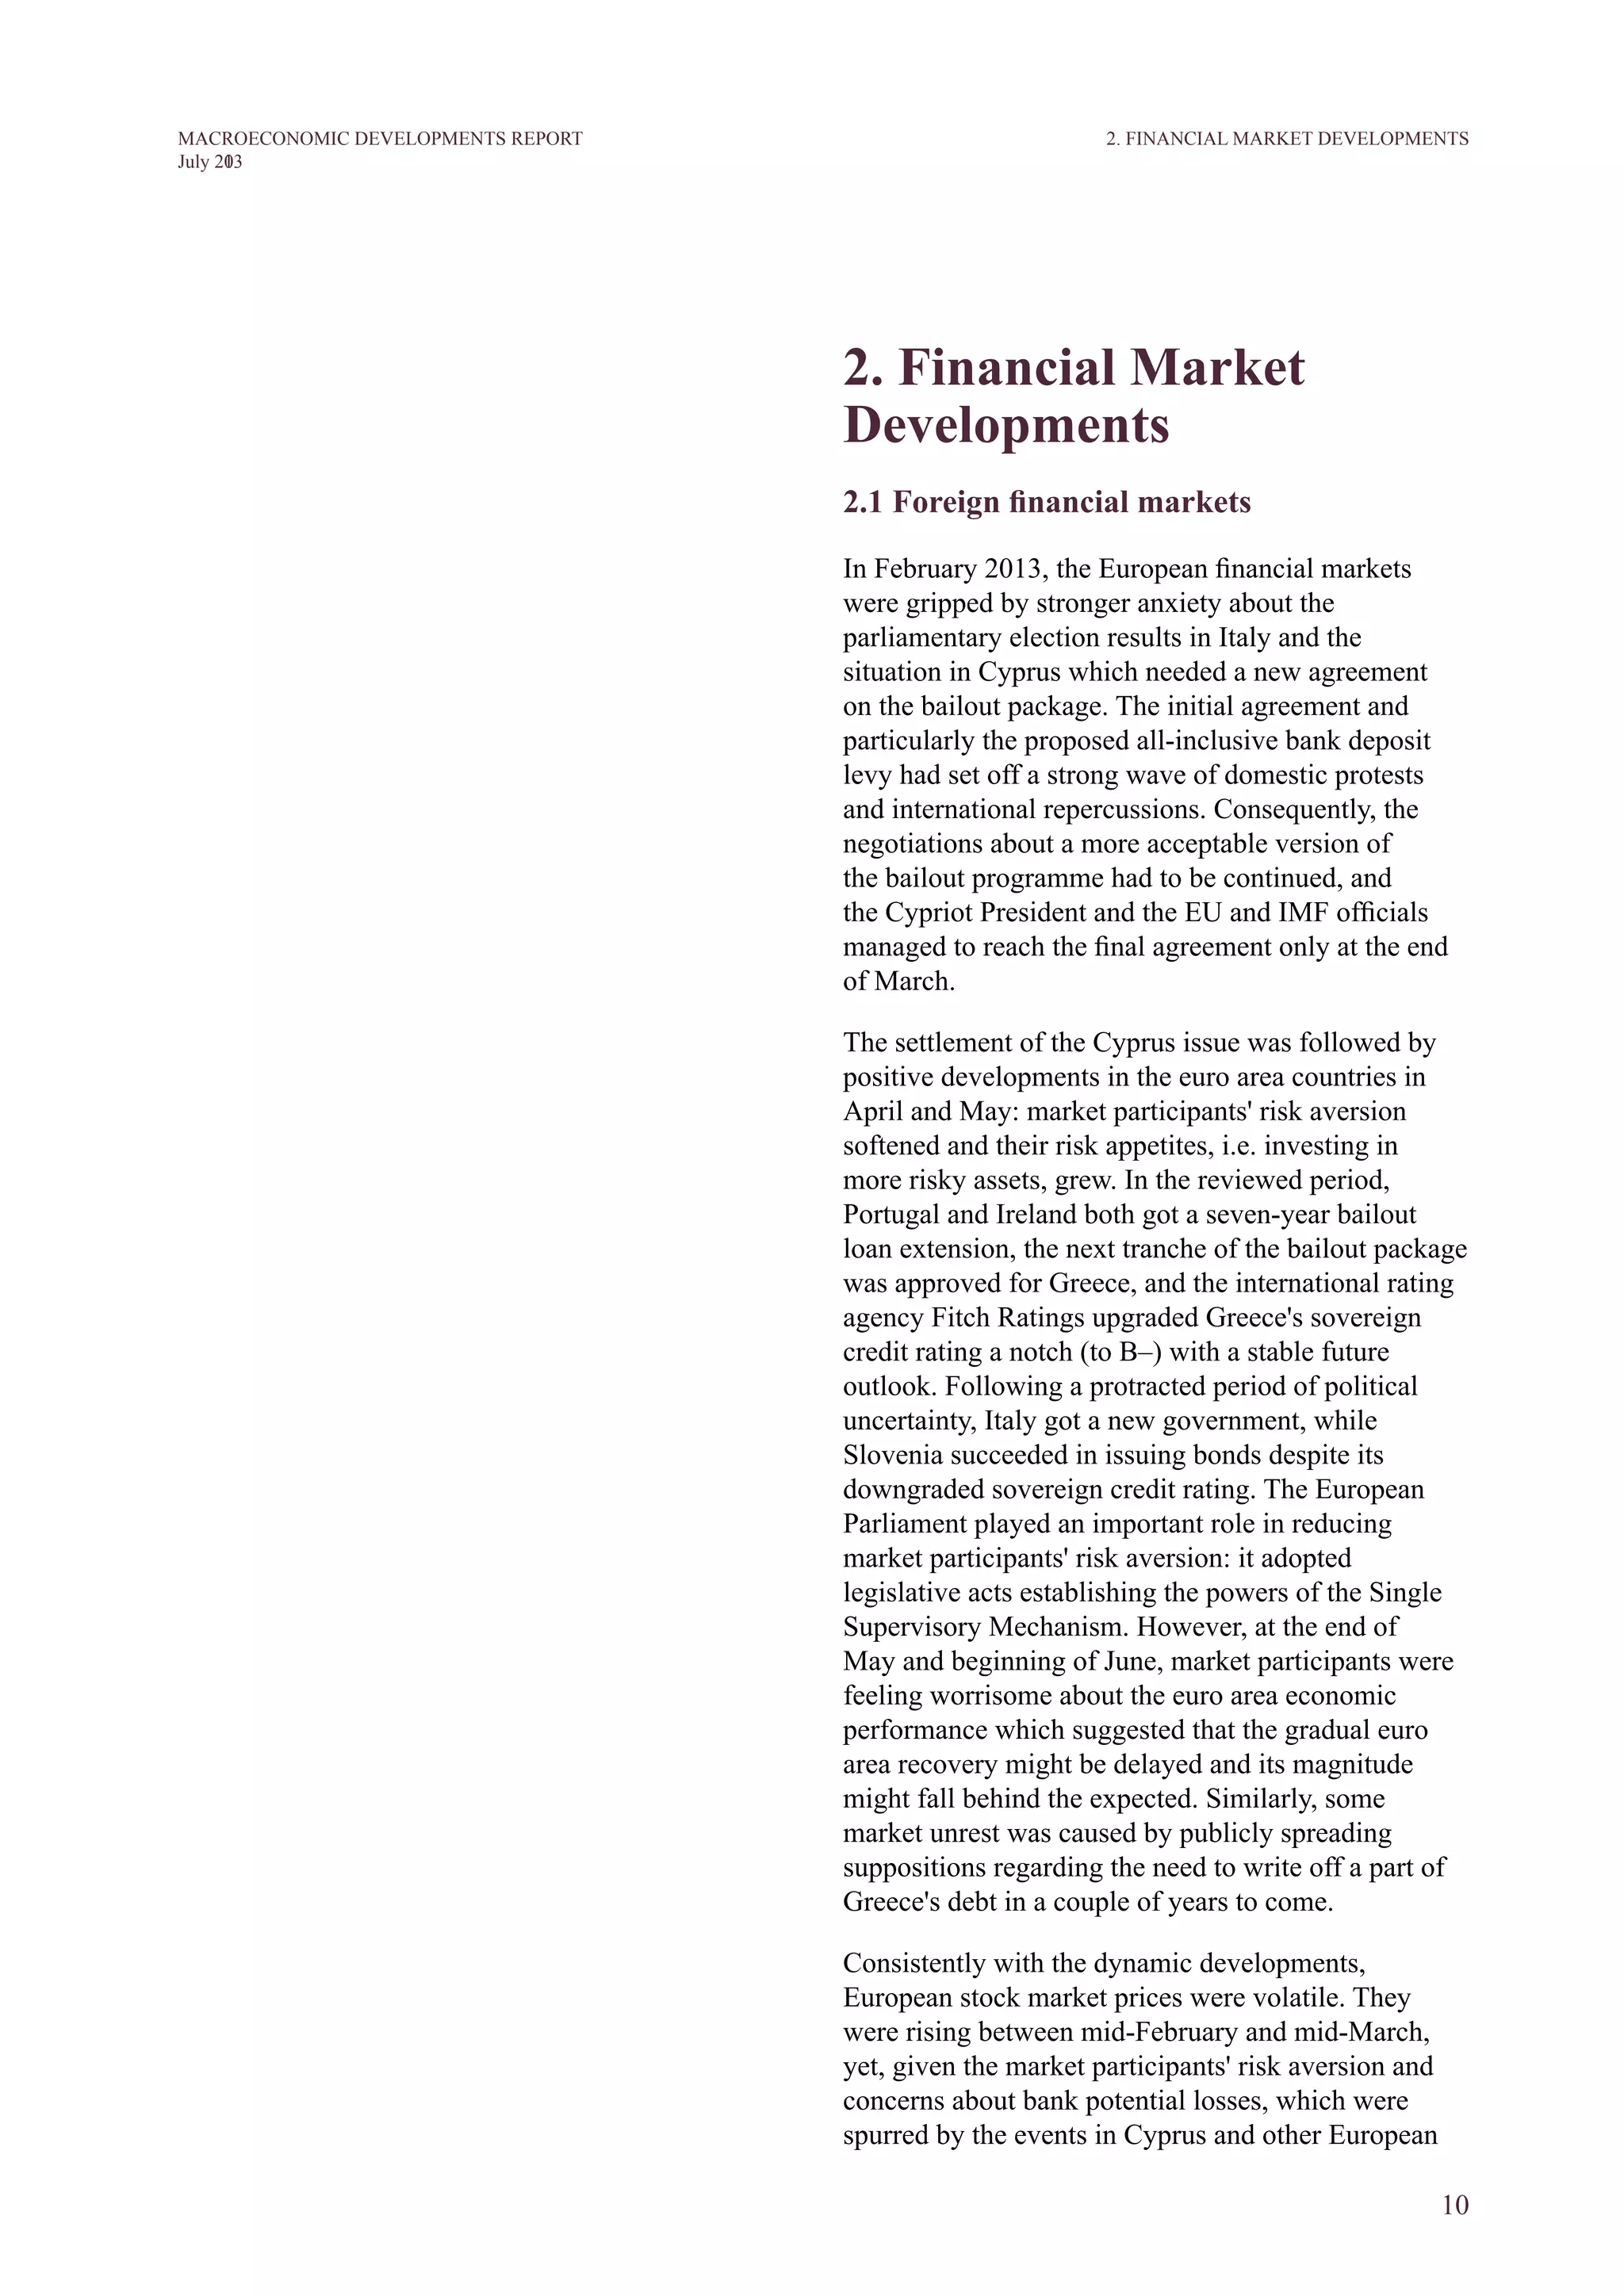


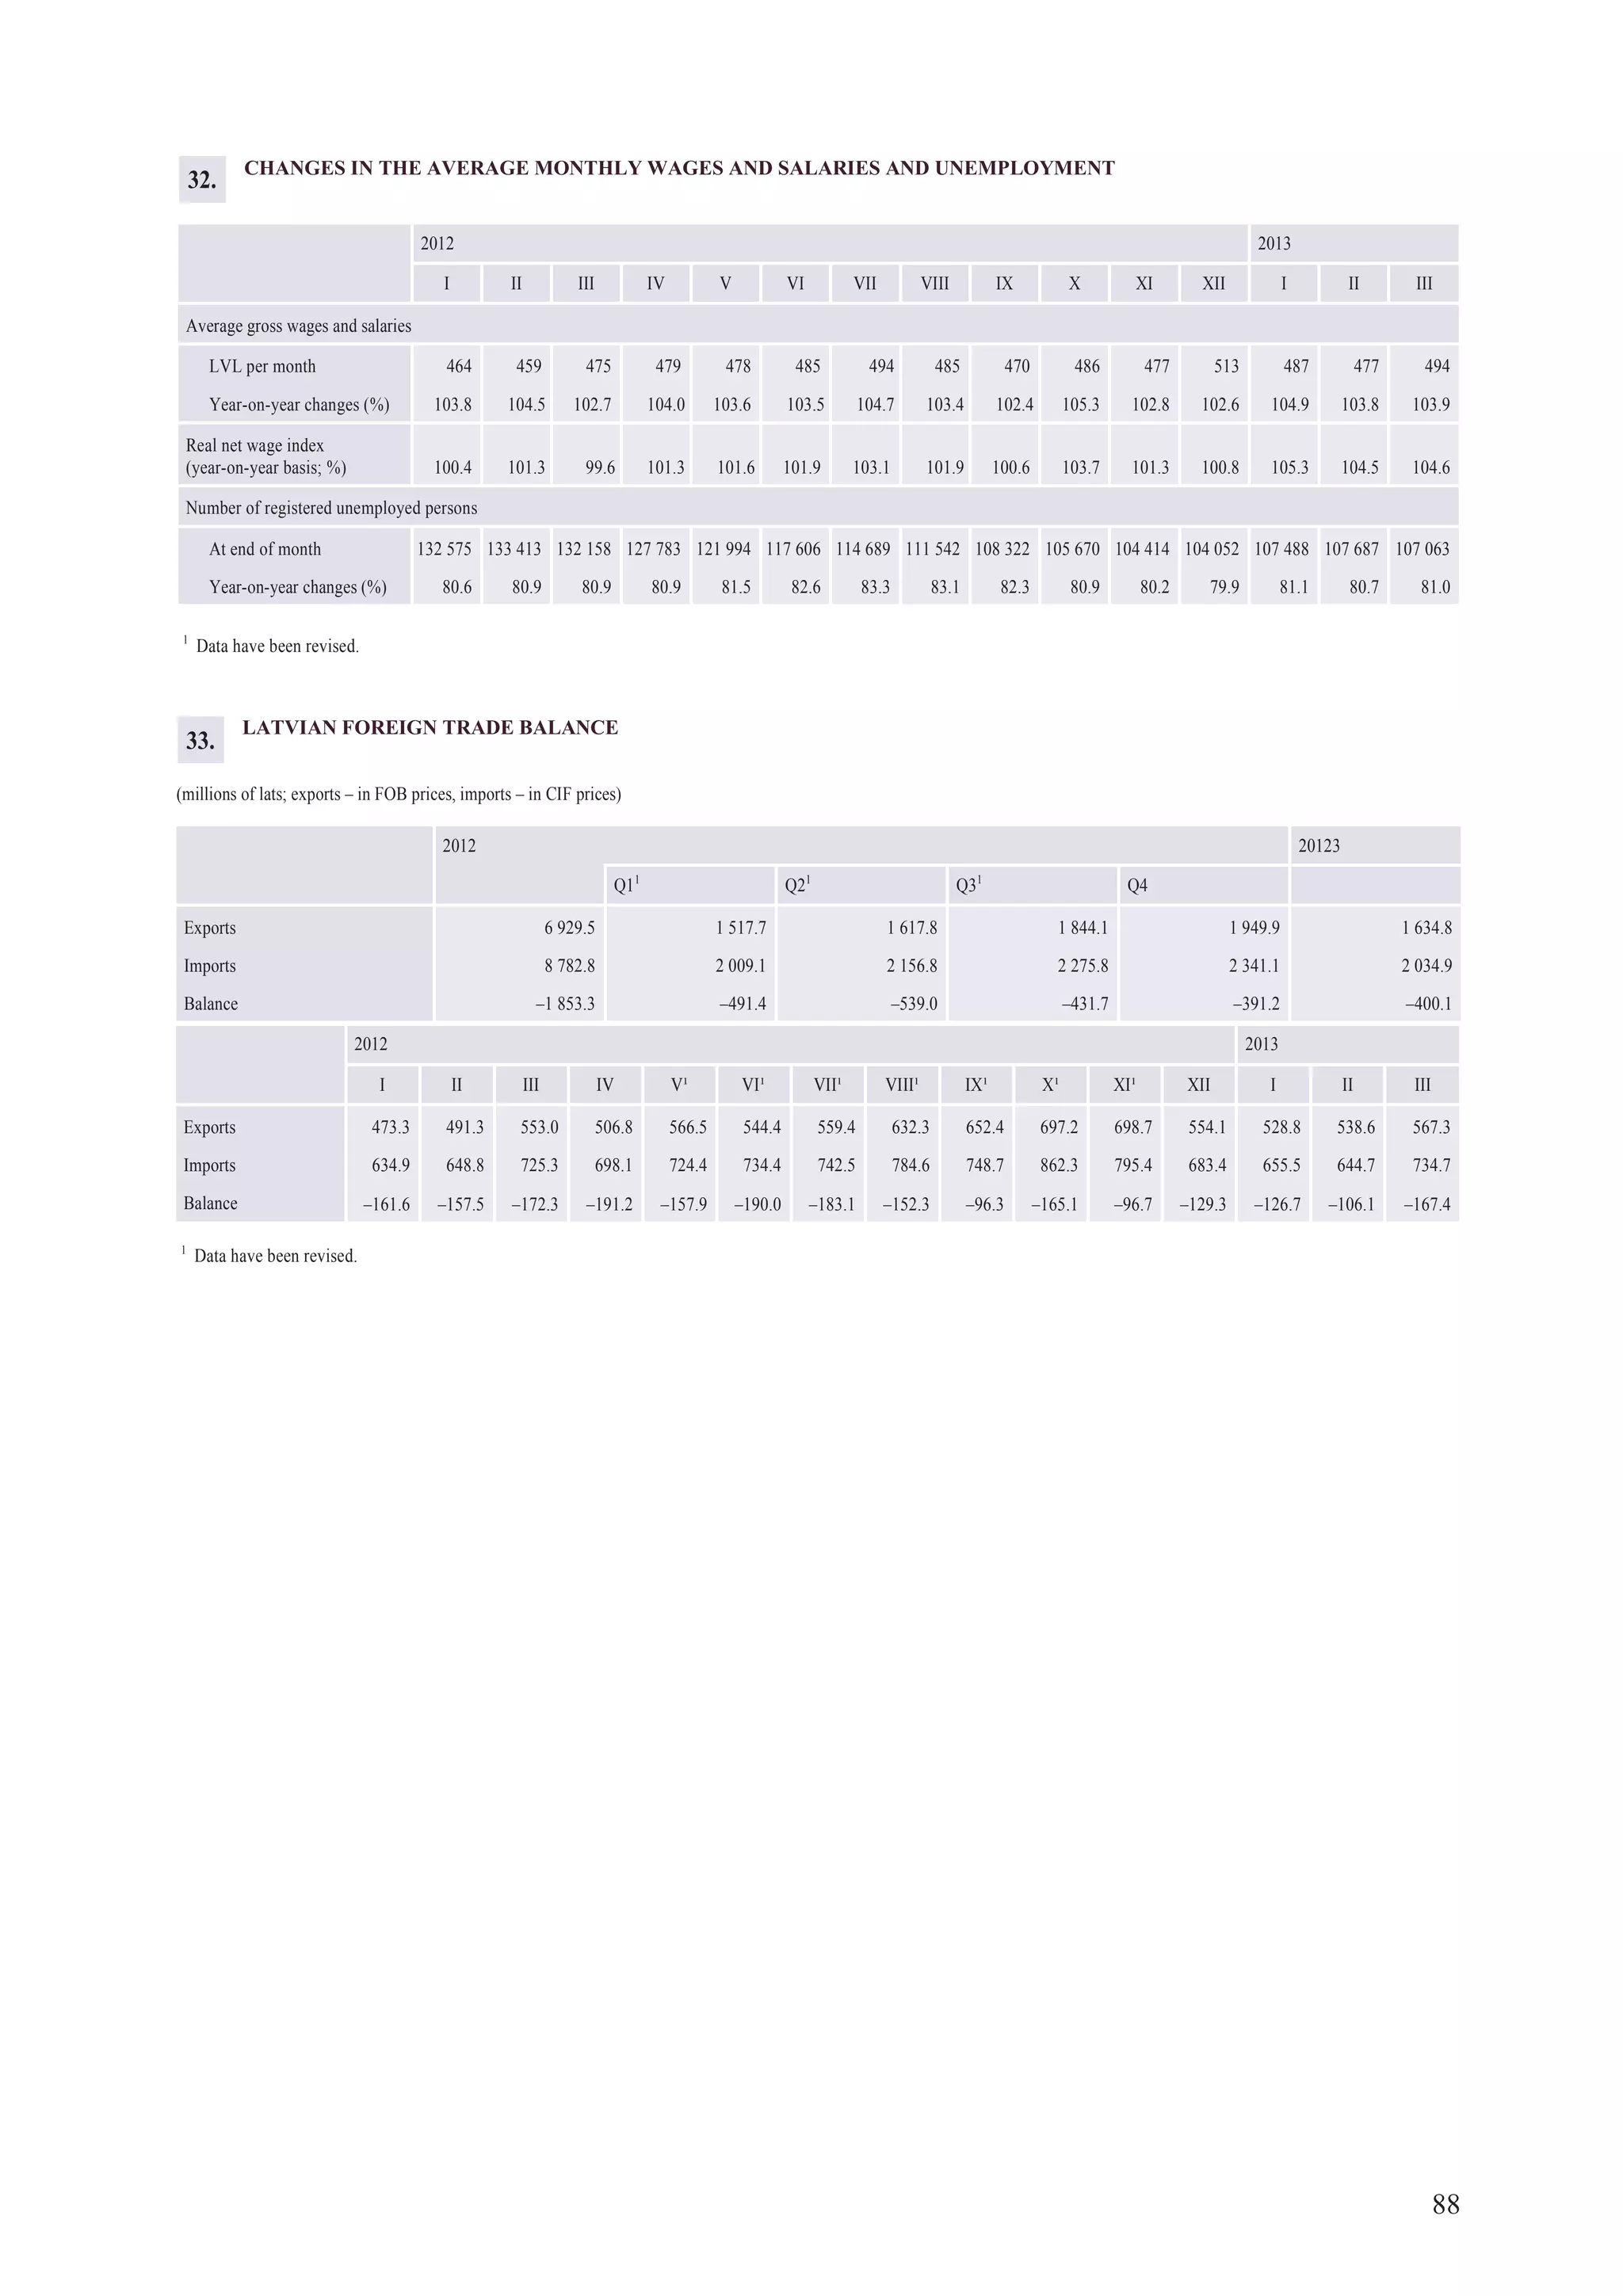
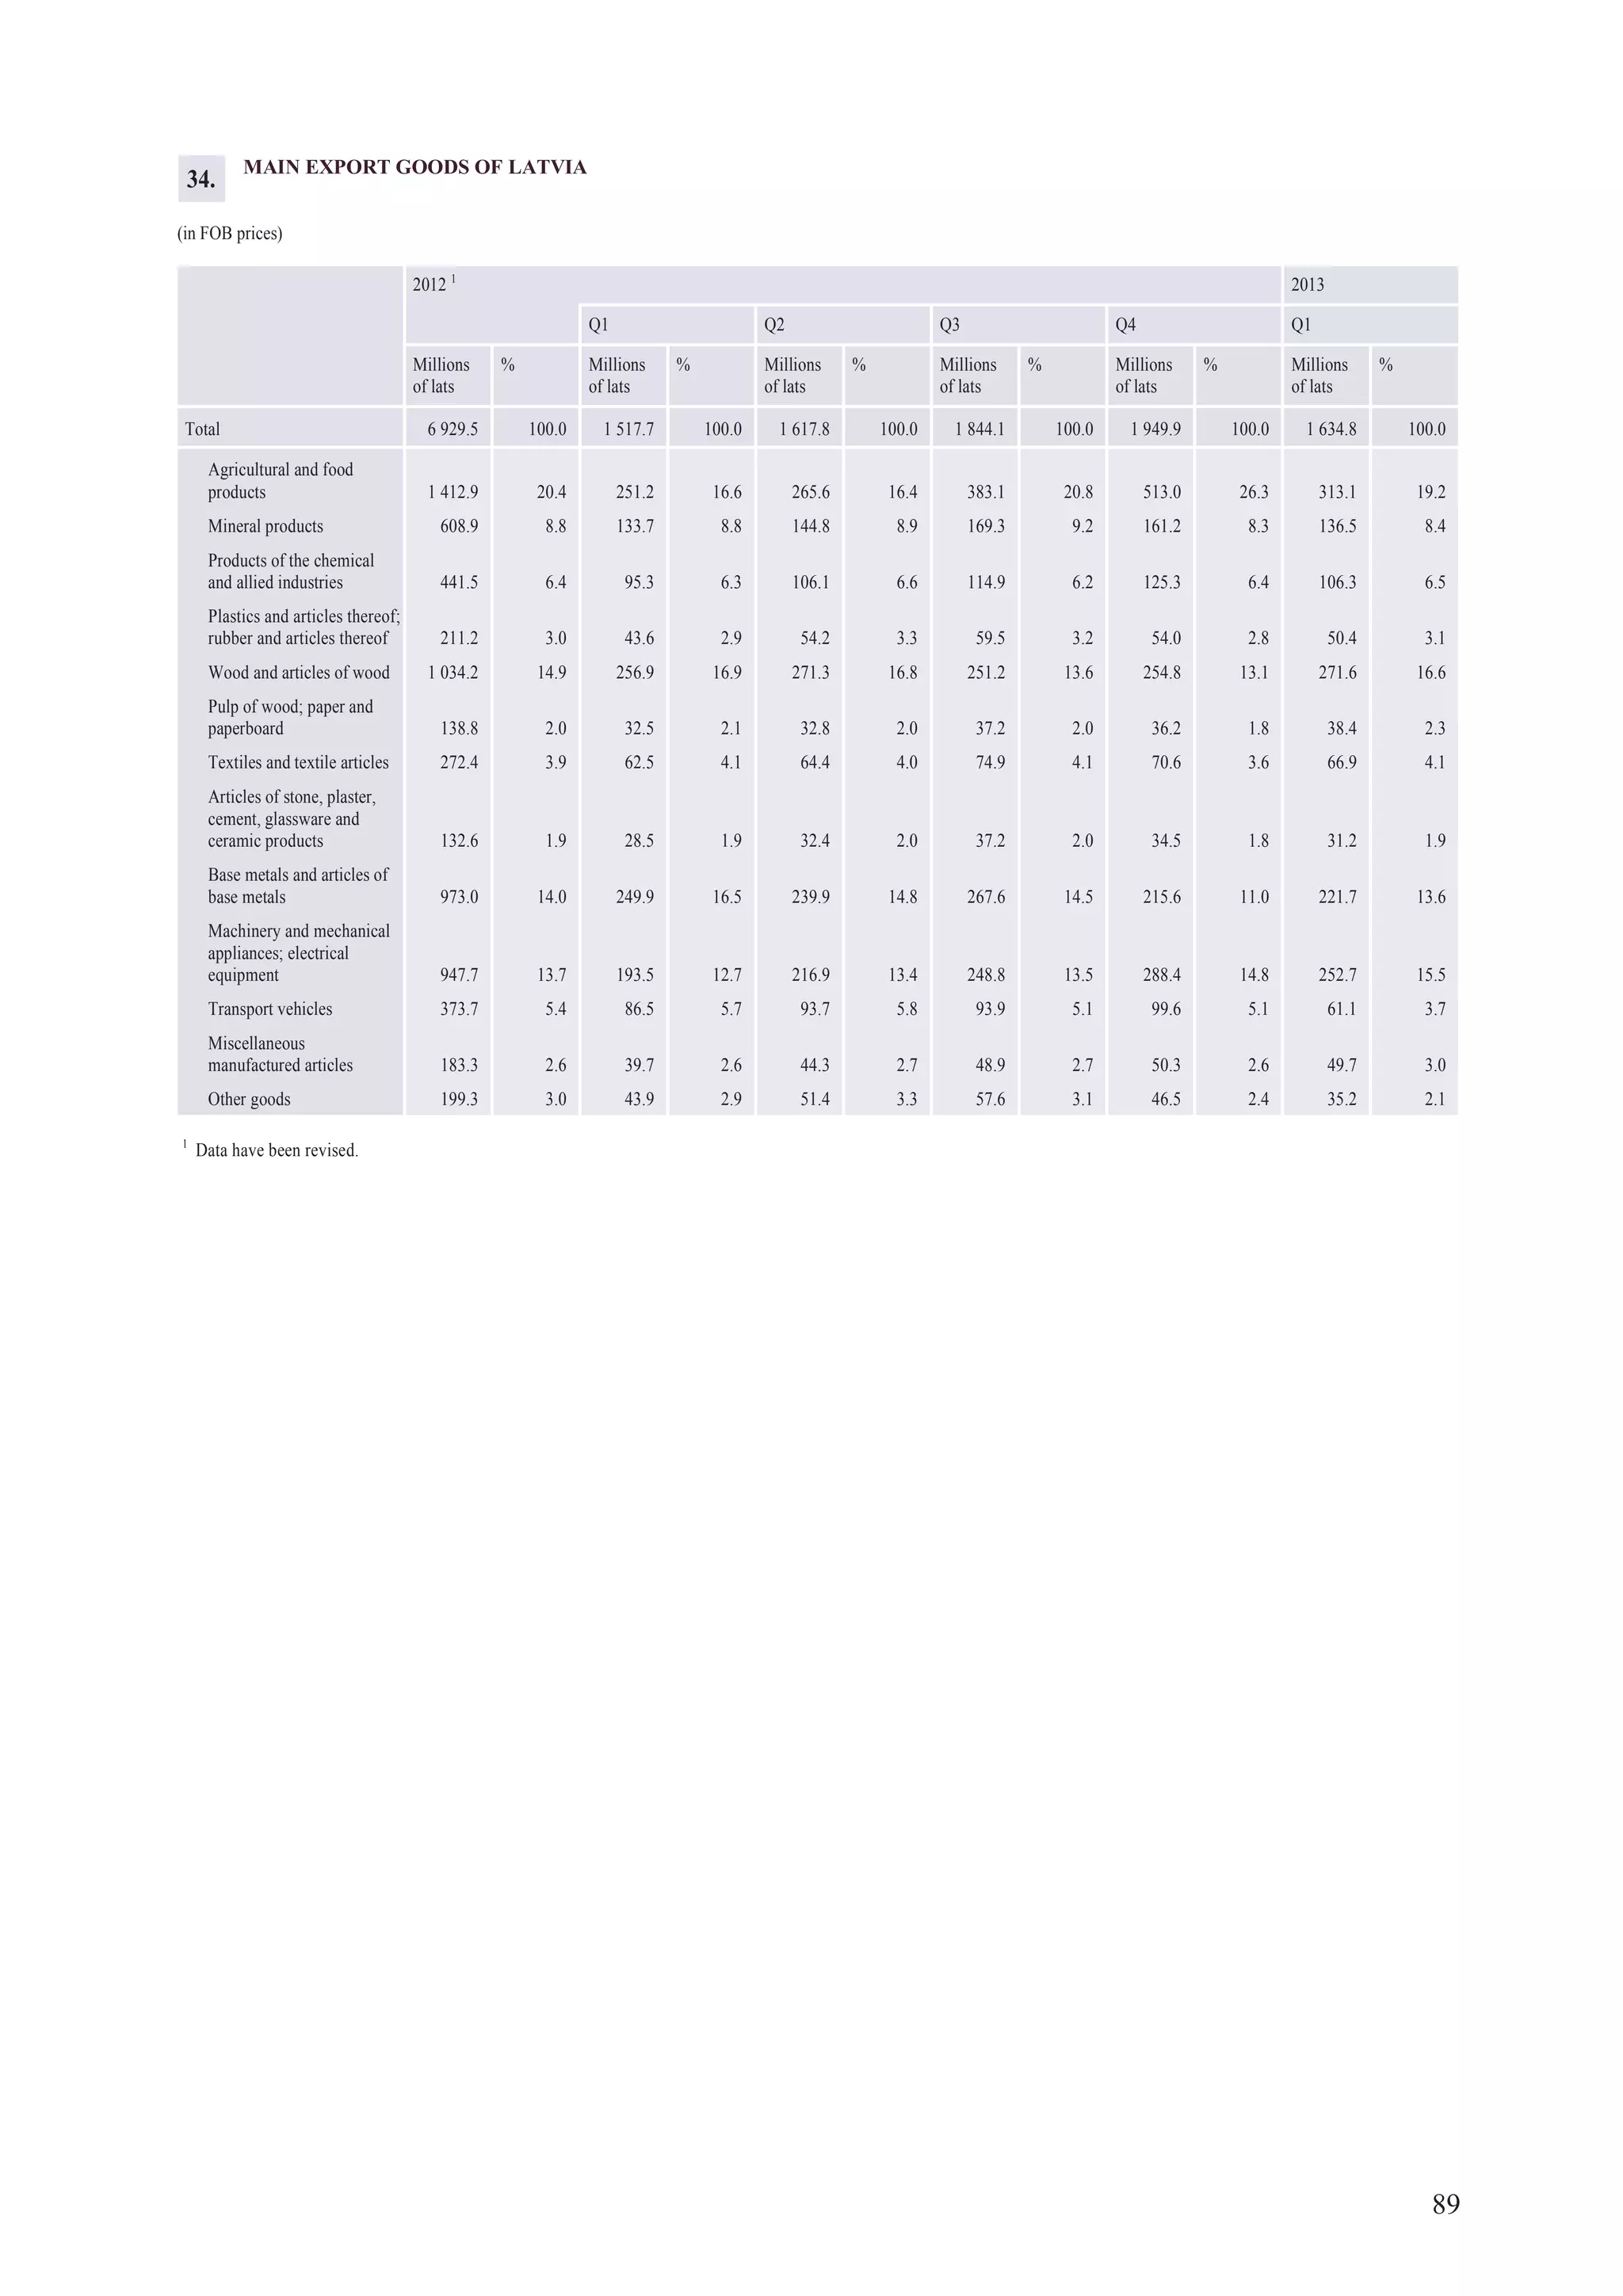
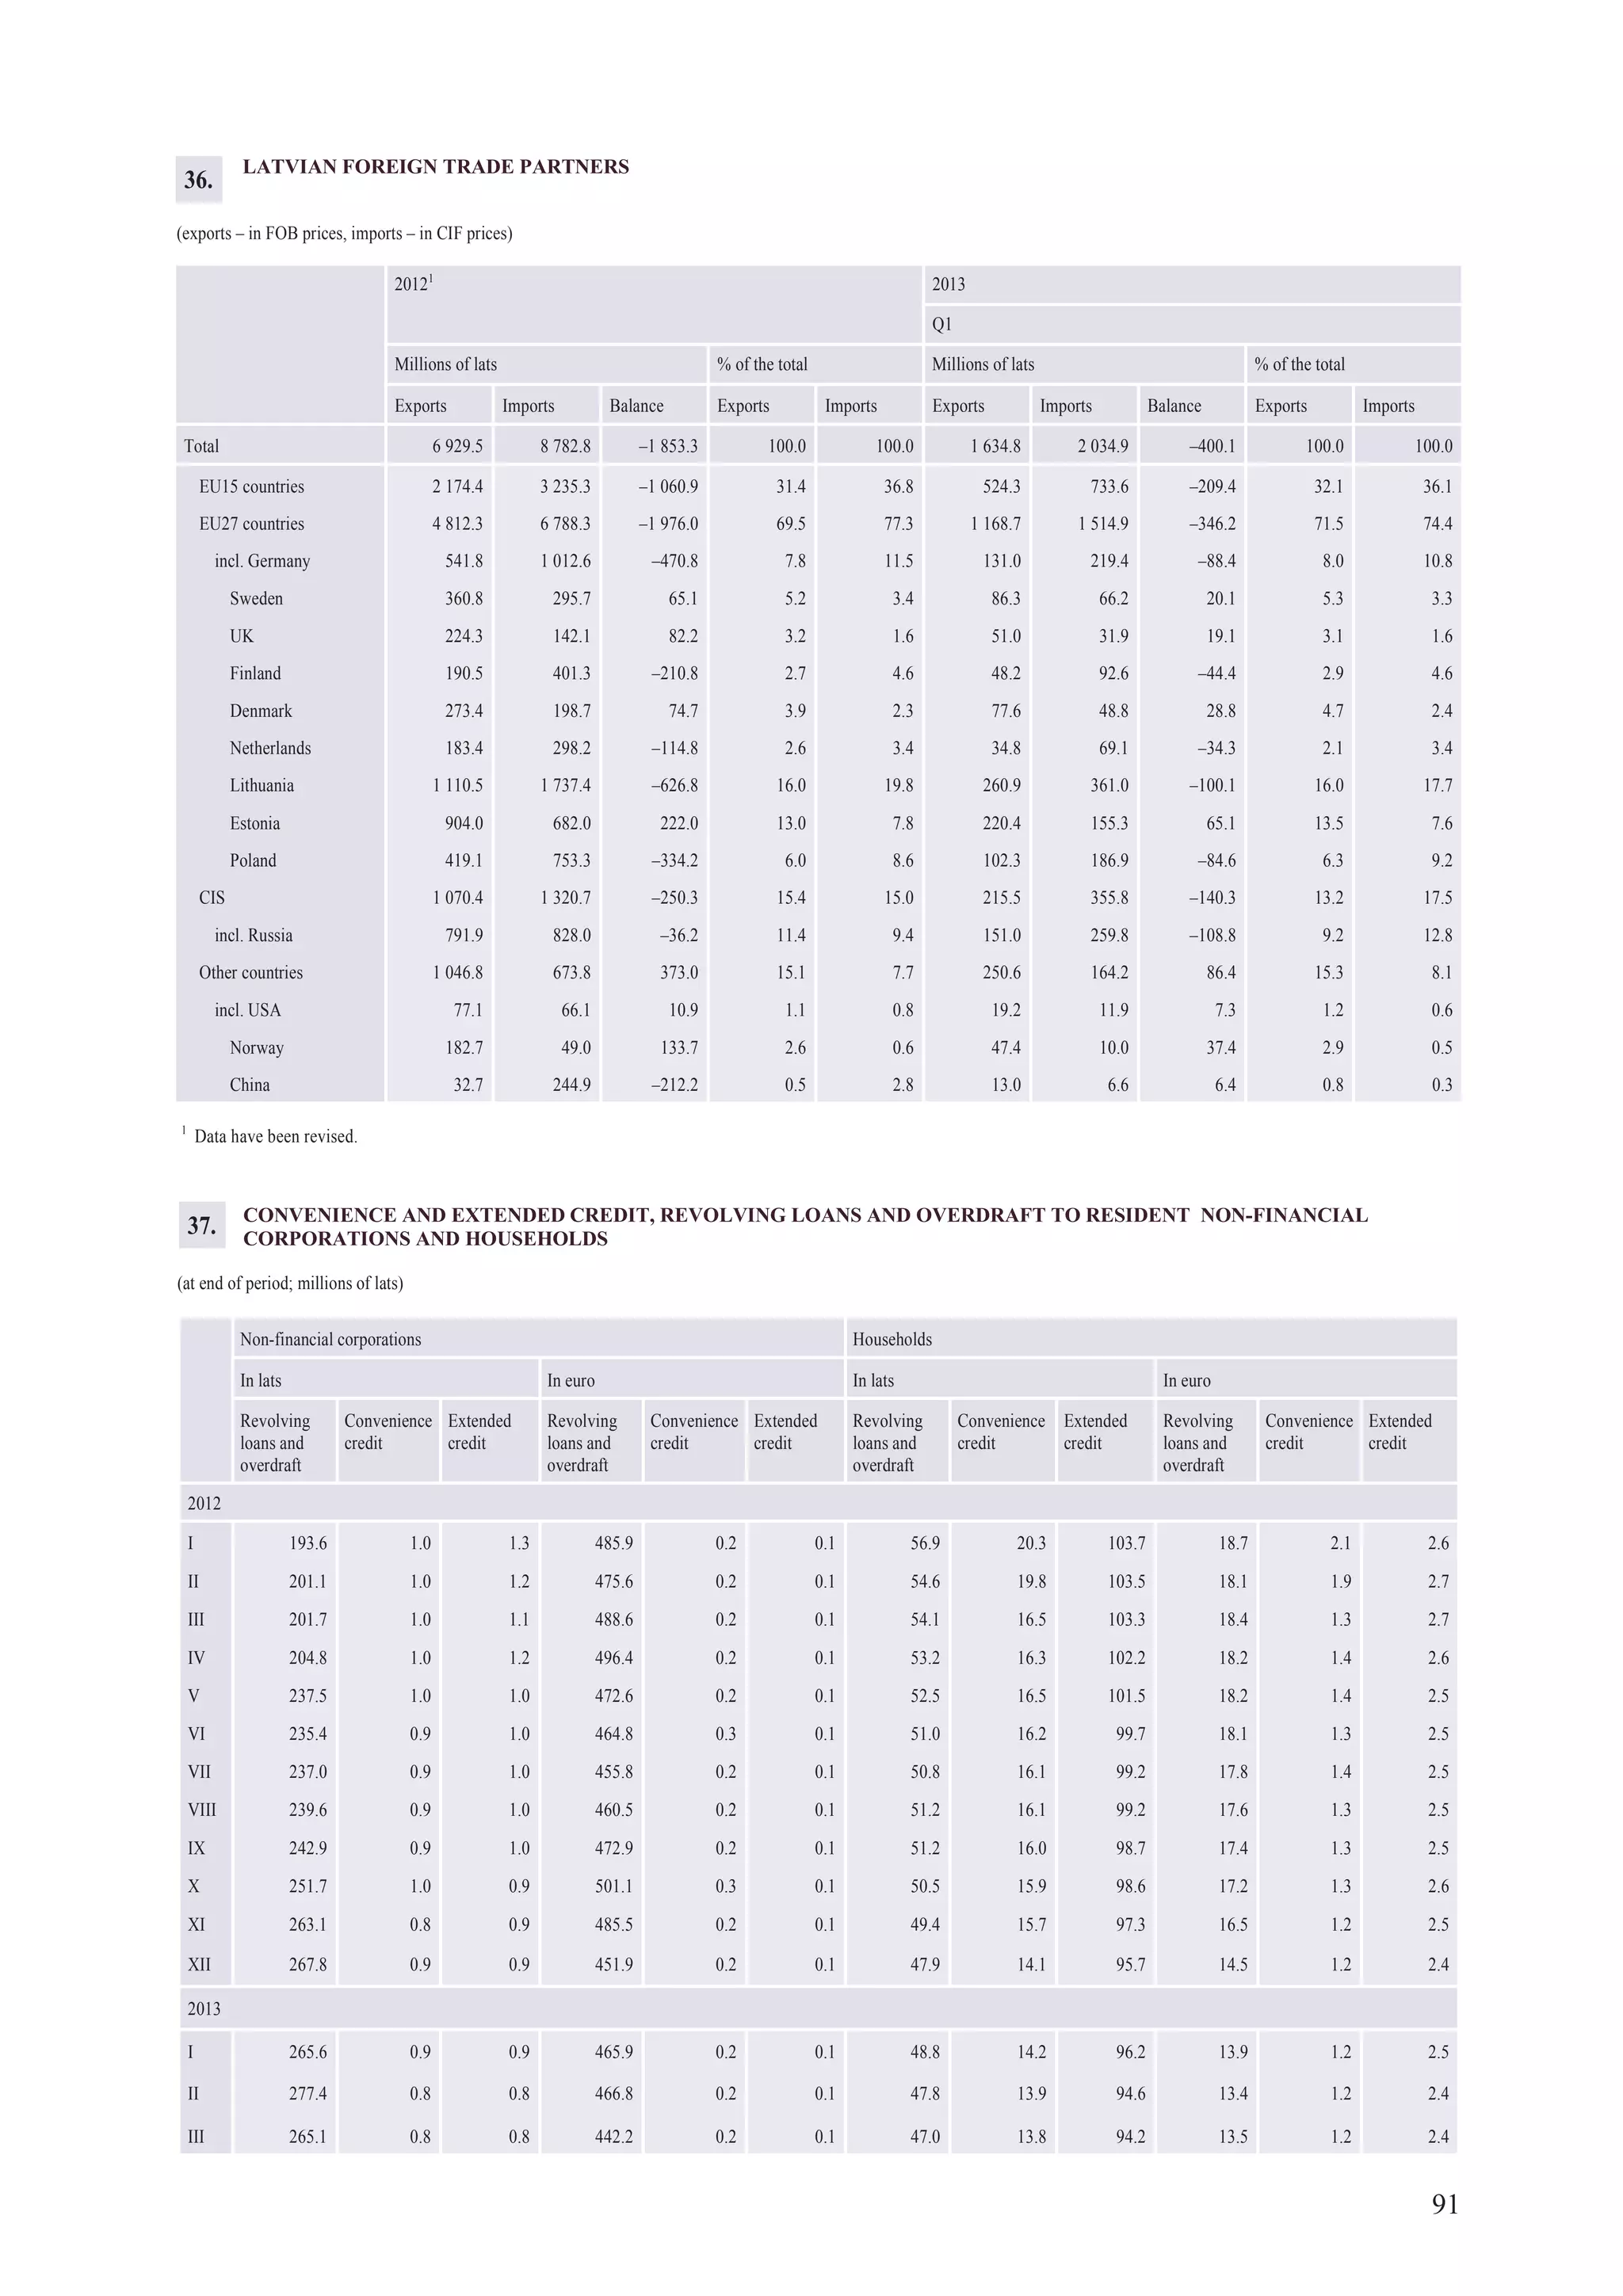

In the first quarter of 2013, Latvia's exports of goods continued to grow faster than imports in both nominal and real terms, driven by Latvian exporters' competitiveness. However, as external demand contracted and the base effect took over, the annual growth rate of Latvian exports decelerated. Most of Latvia's major trade partners saw downward revisions to economic growth forecasts for 2013. While growth is still expected in countries like Estonia, Lithuania, and Russia, the pace is expected to slow. Contraction in the euro area and weak growth in the UK and other European countries poses risks to Latvia's export growth in the coming quarters.


