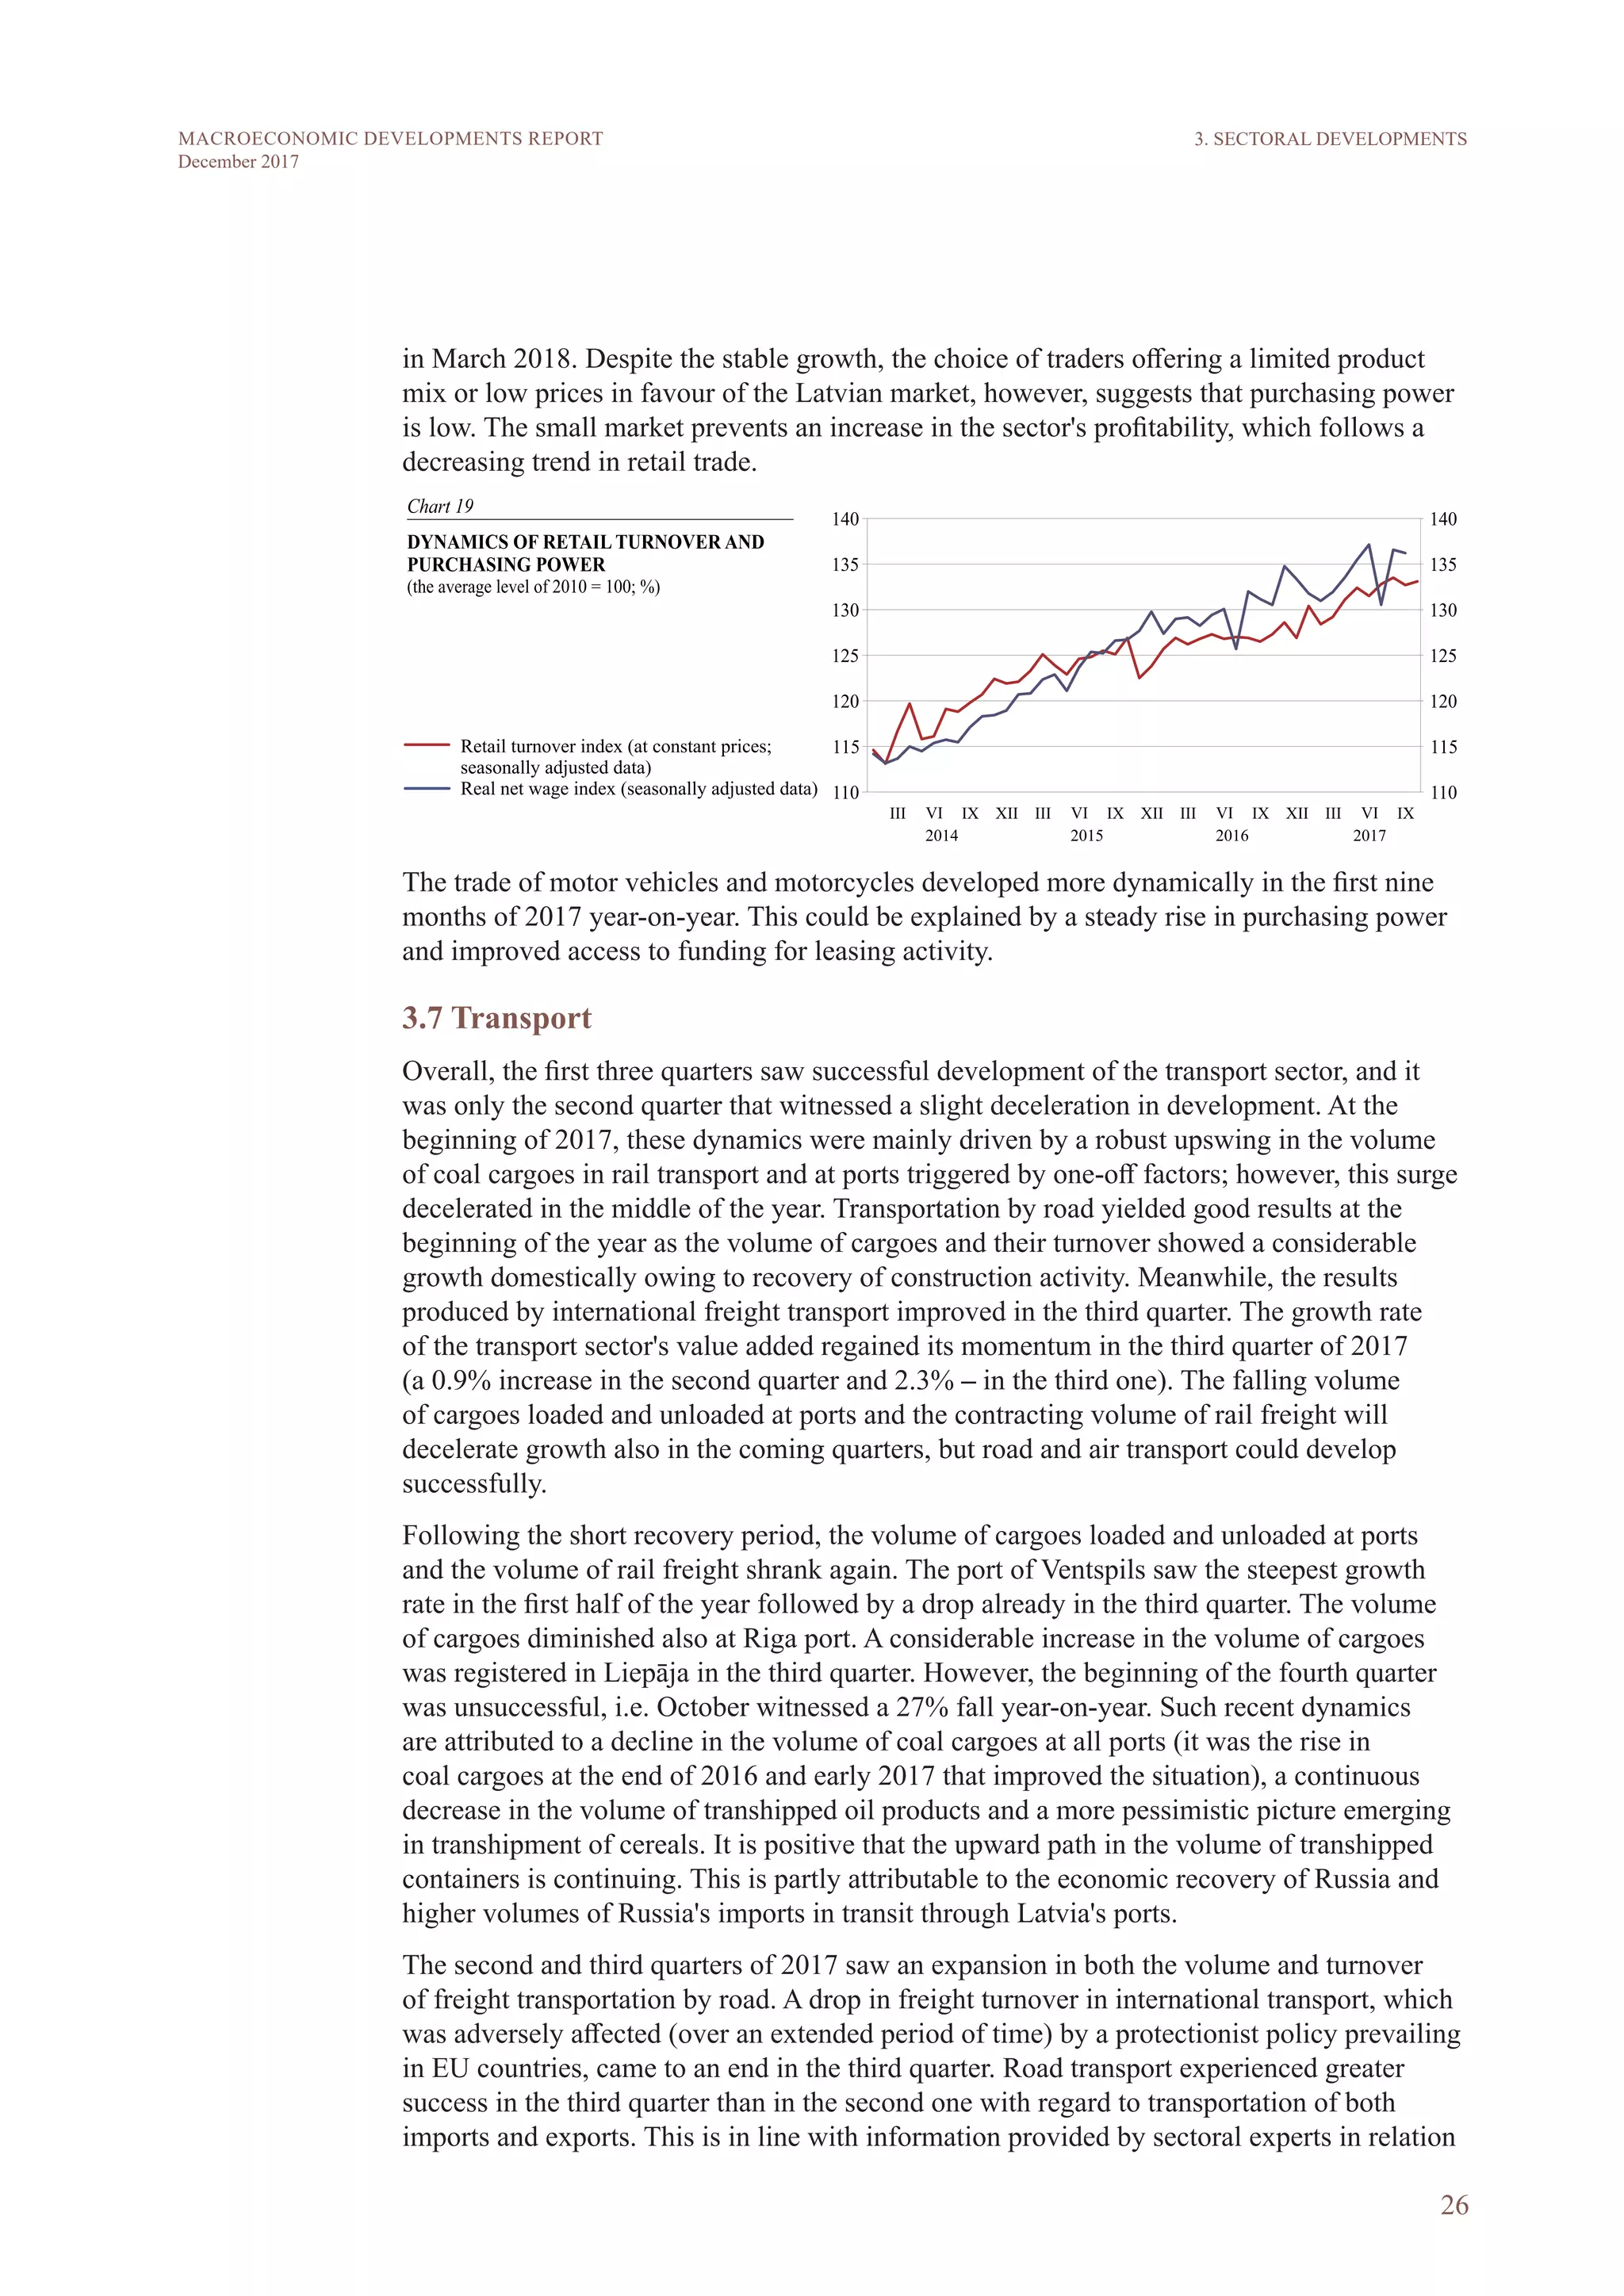
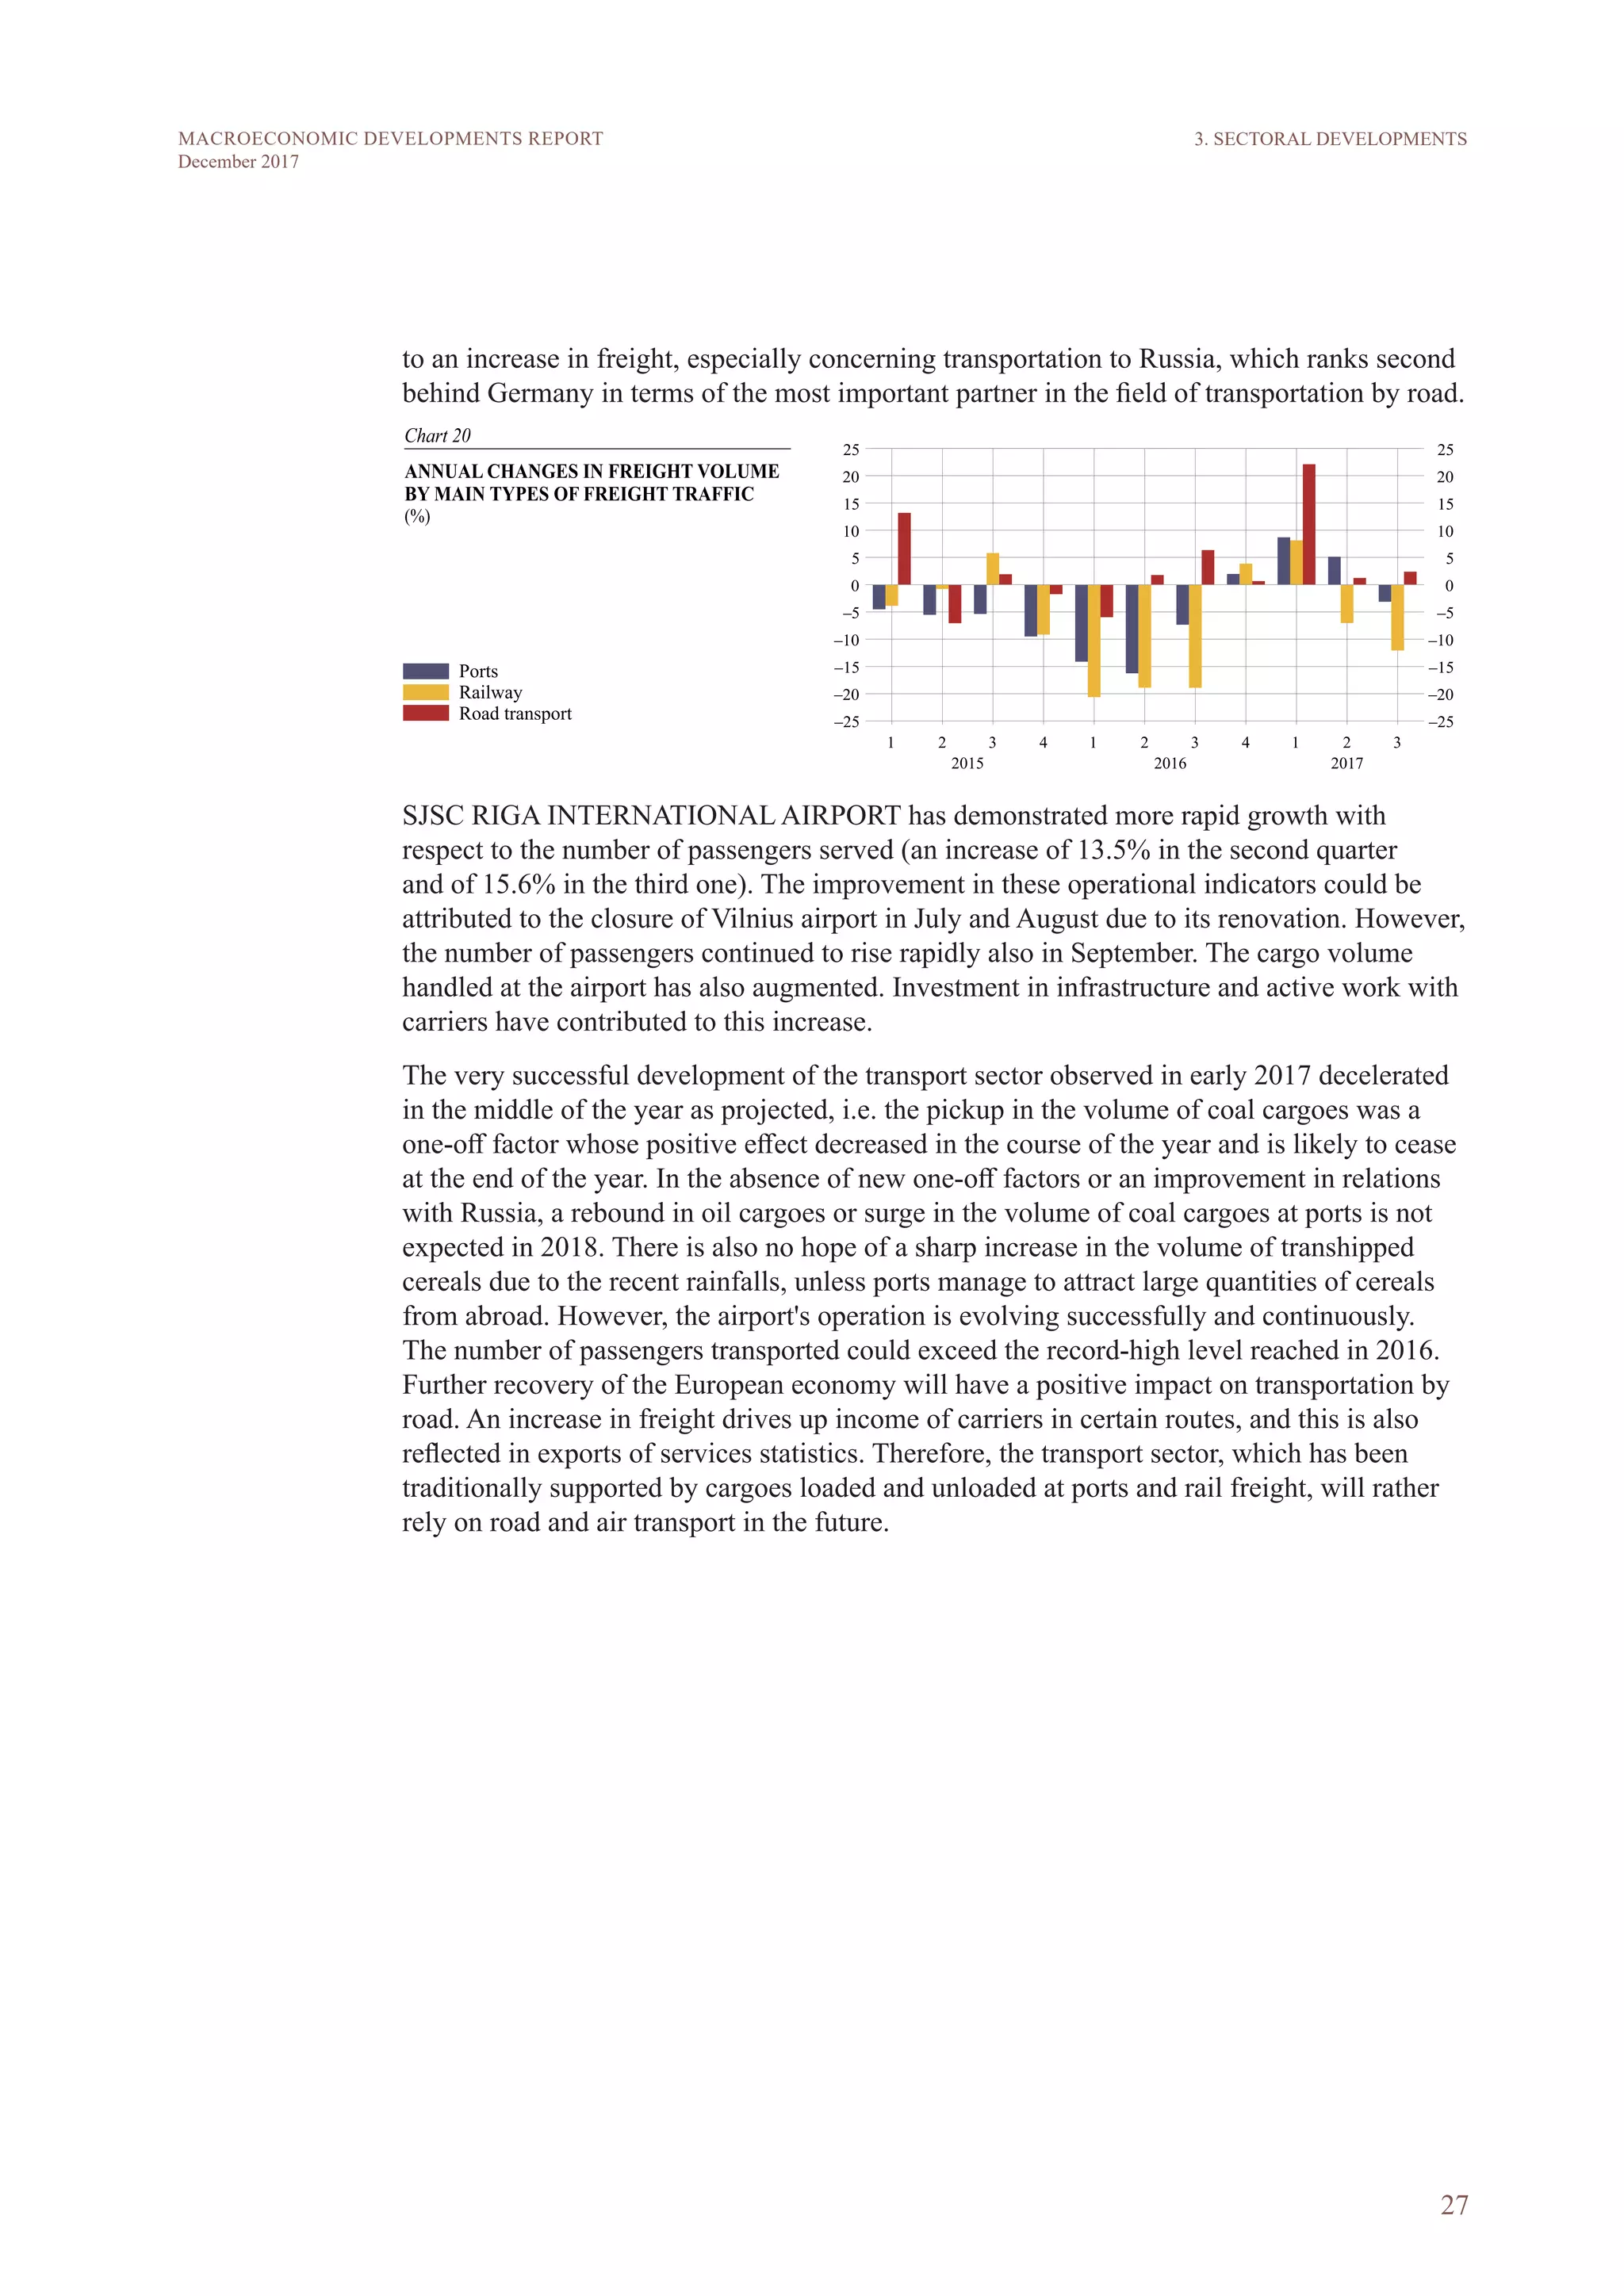
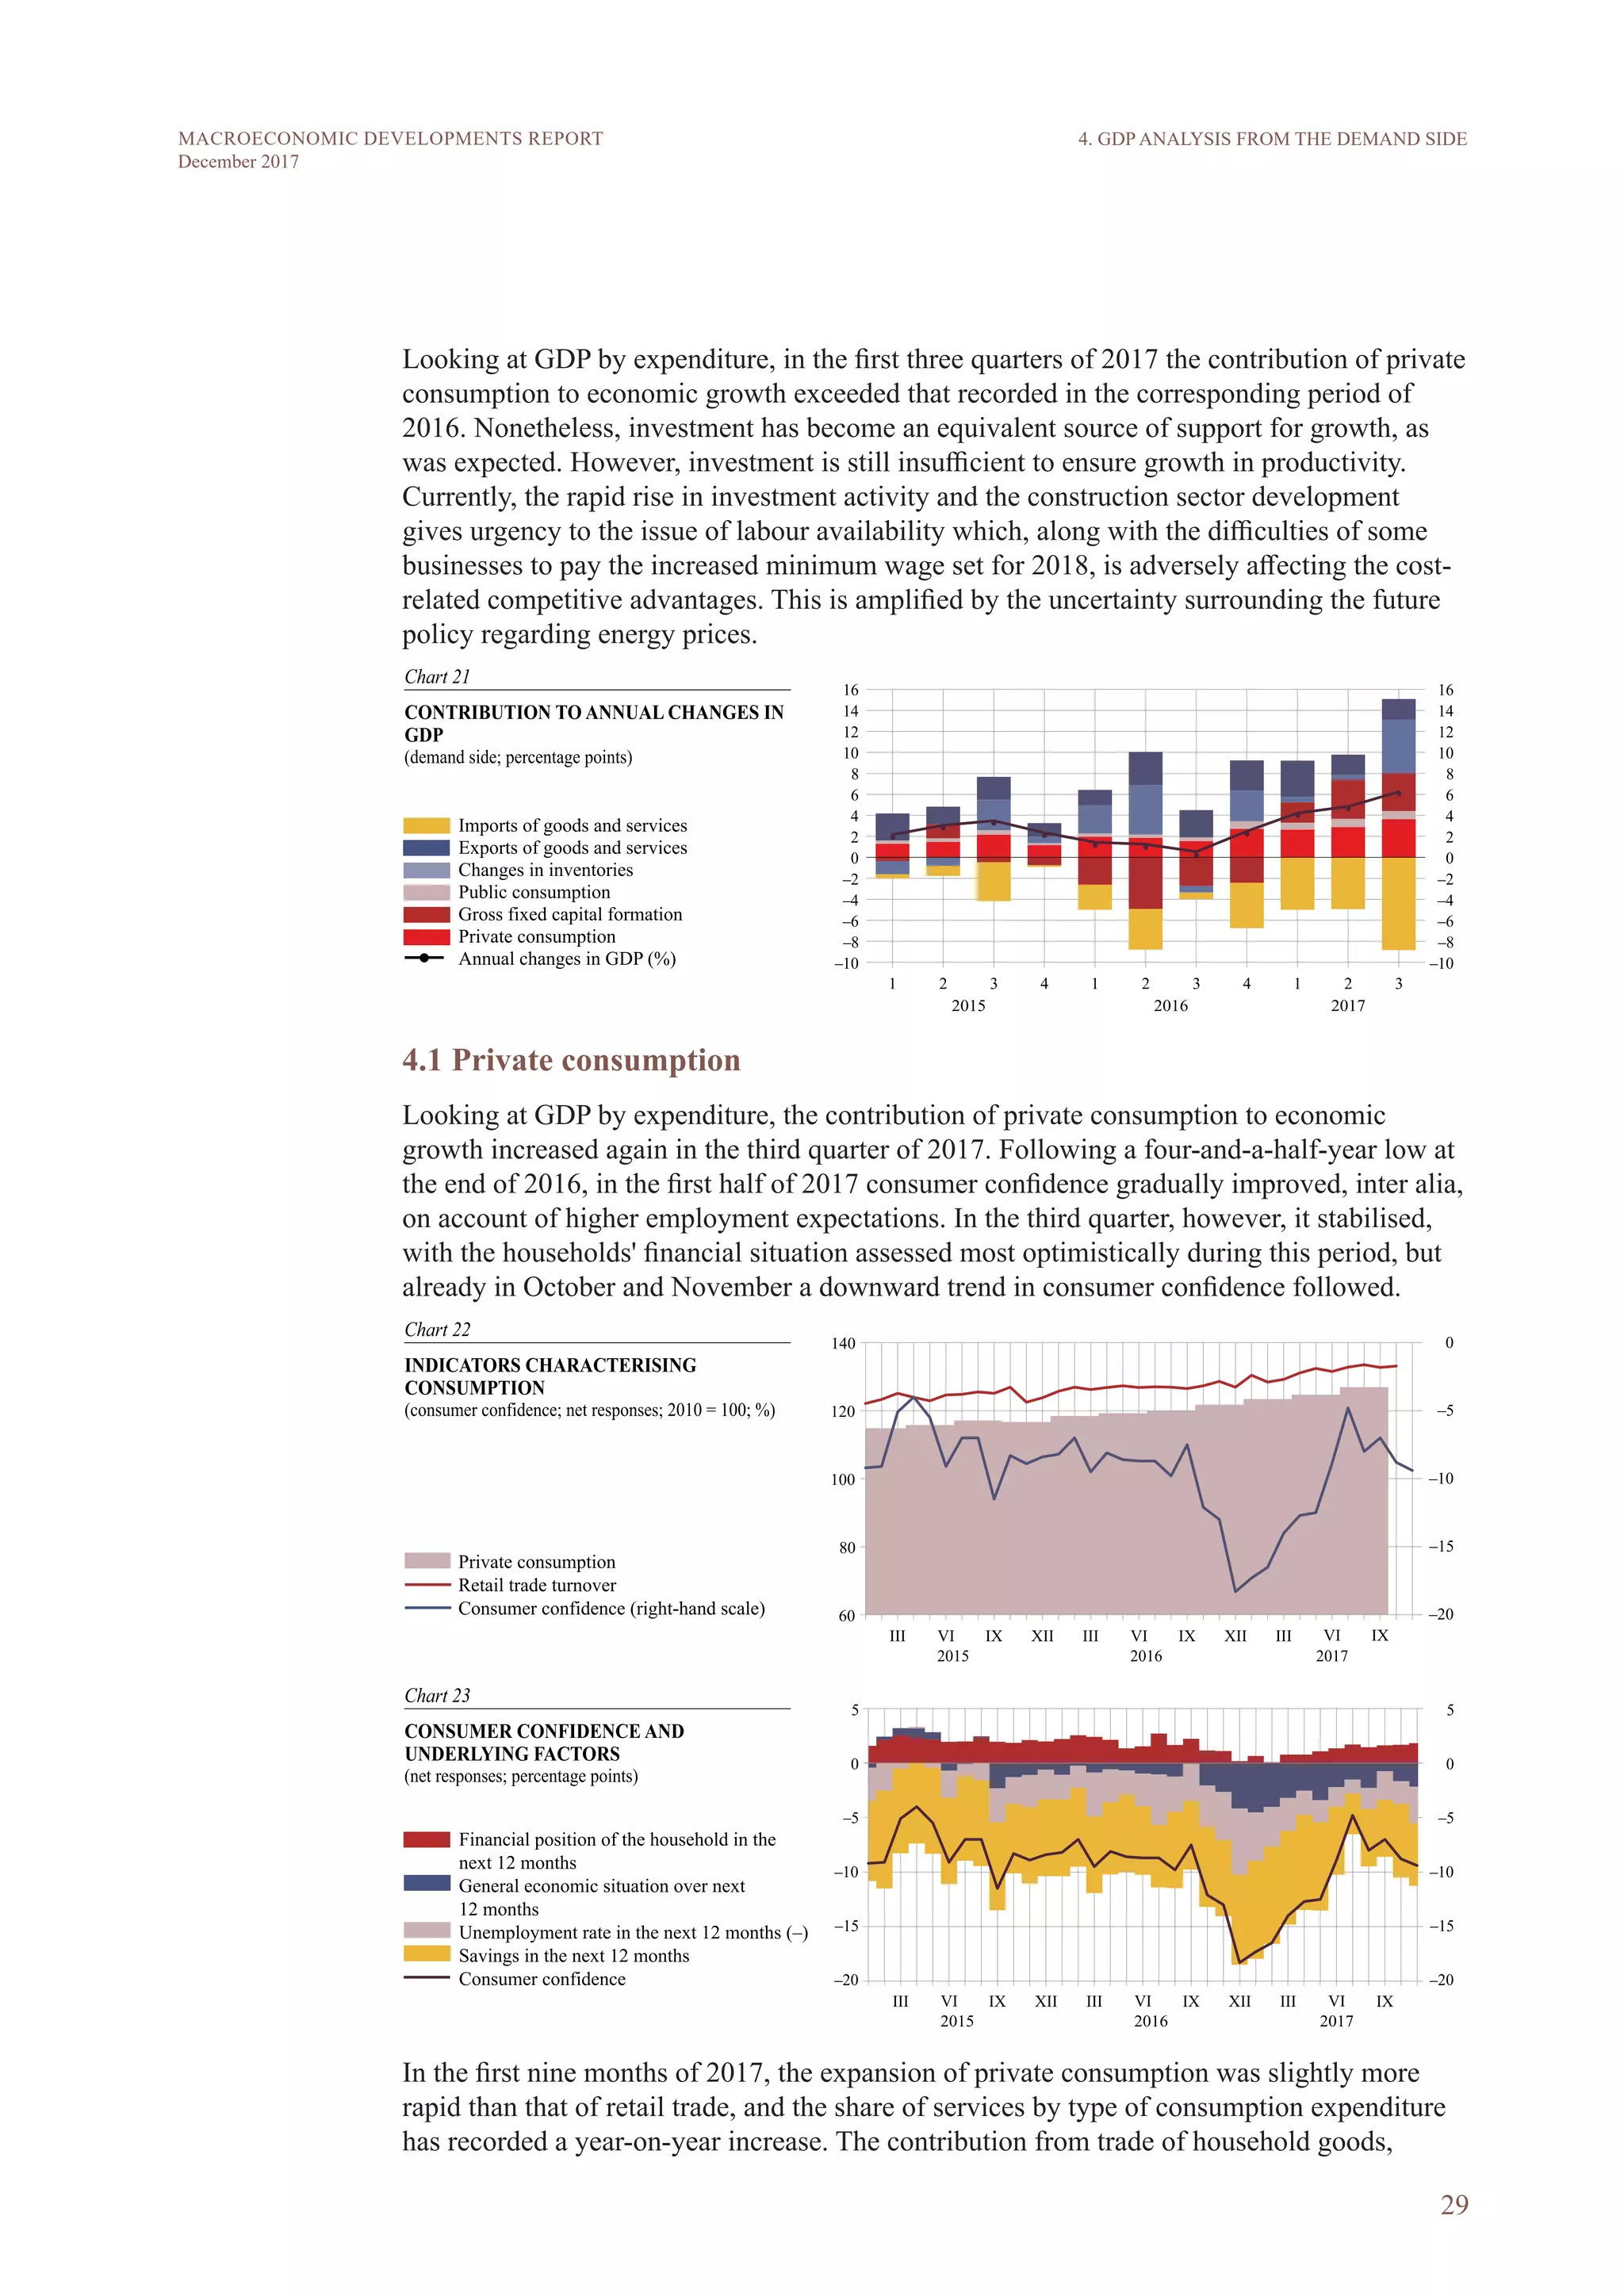
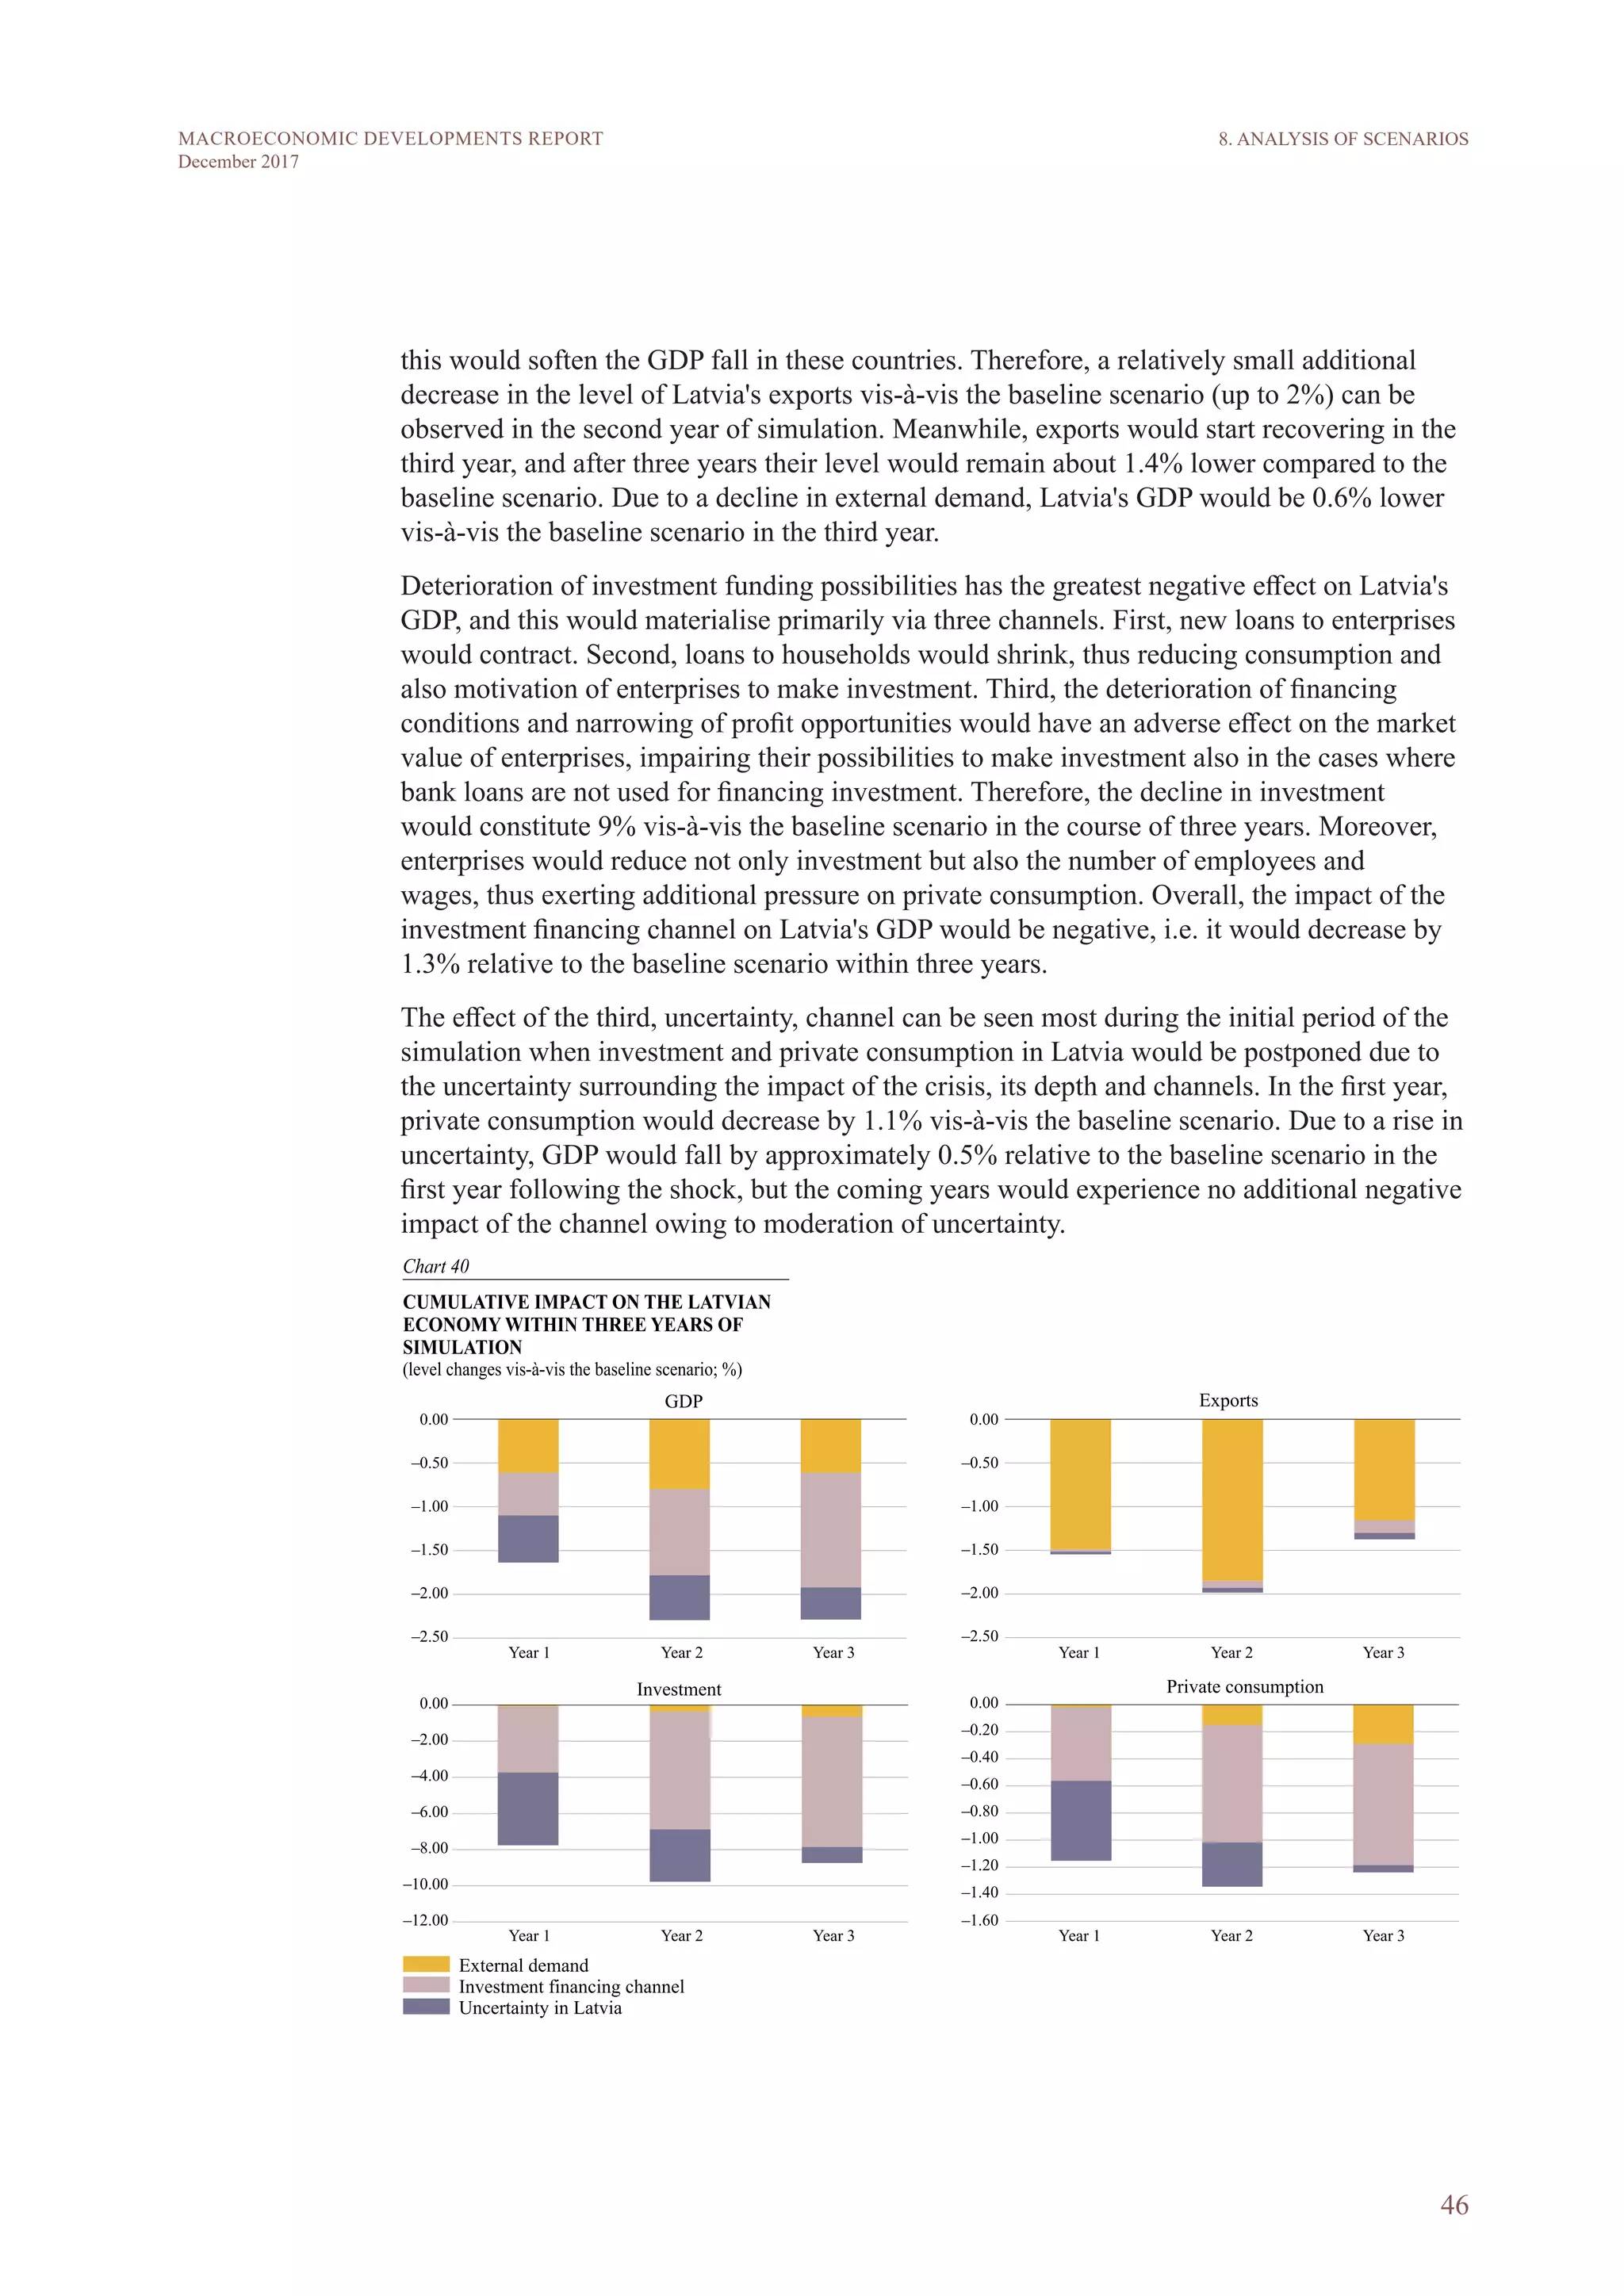
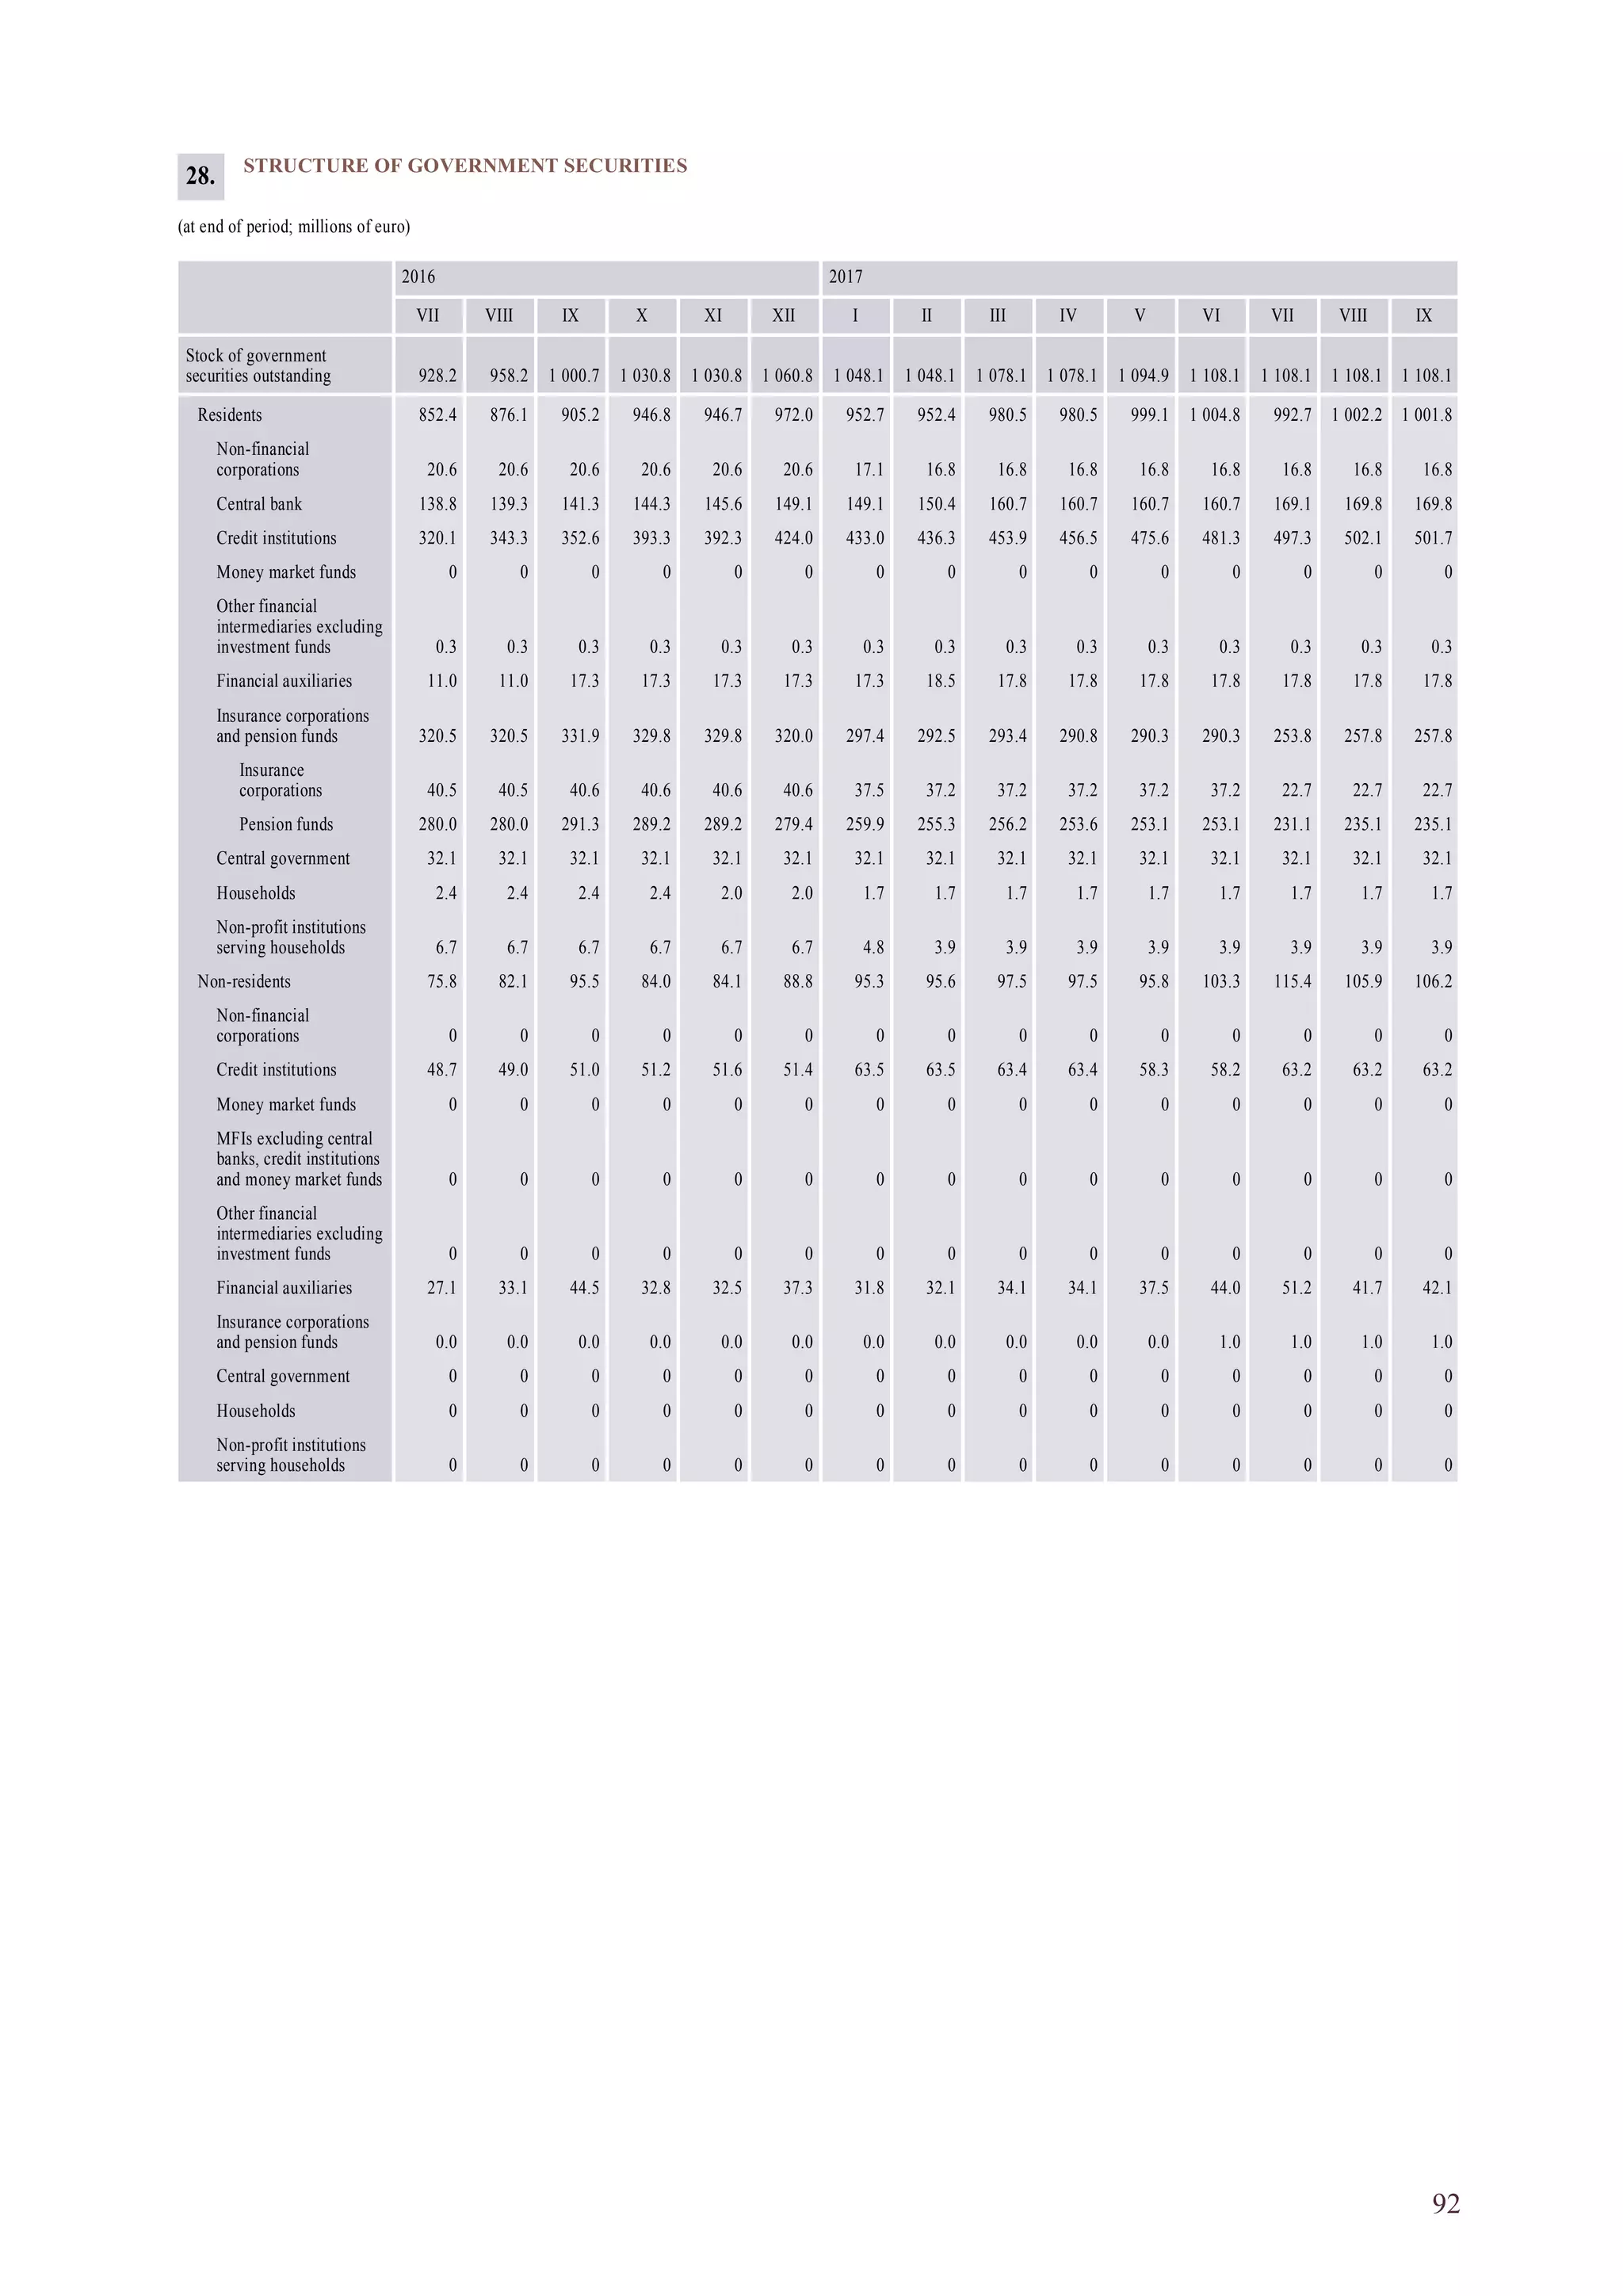
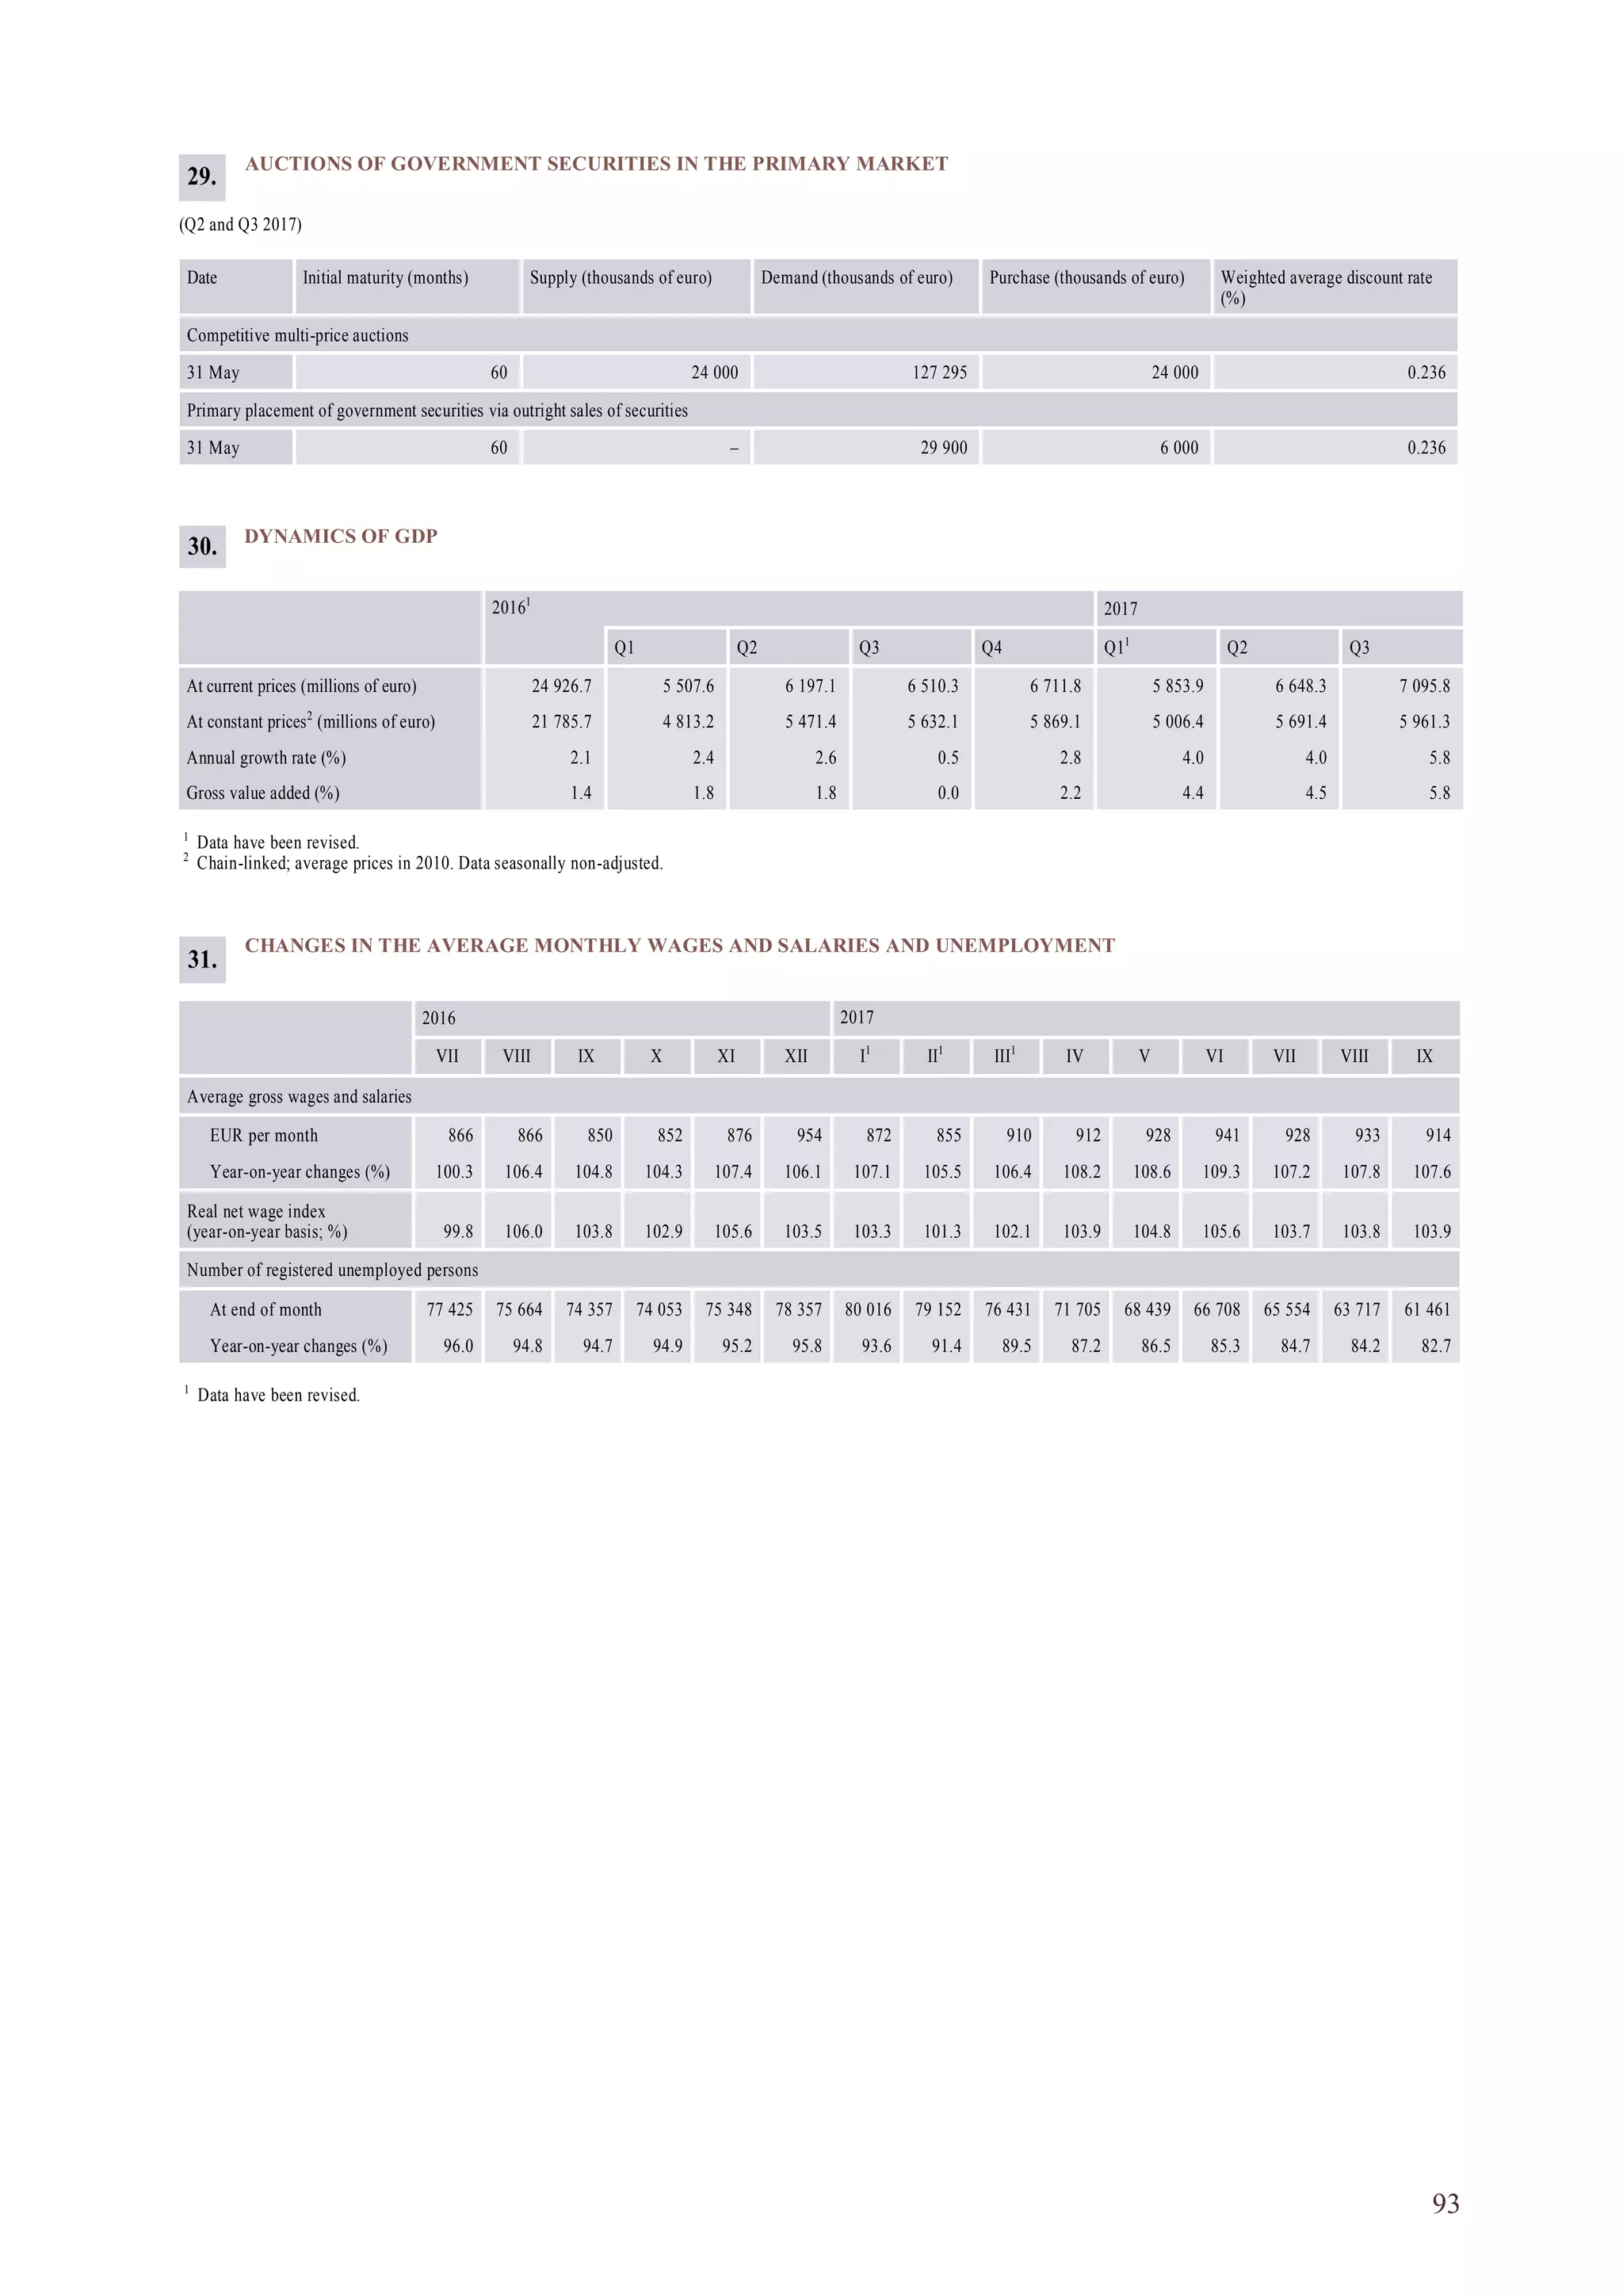
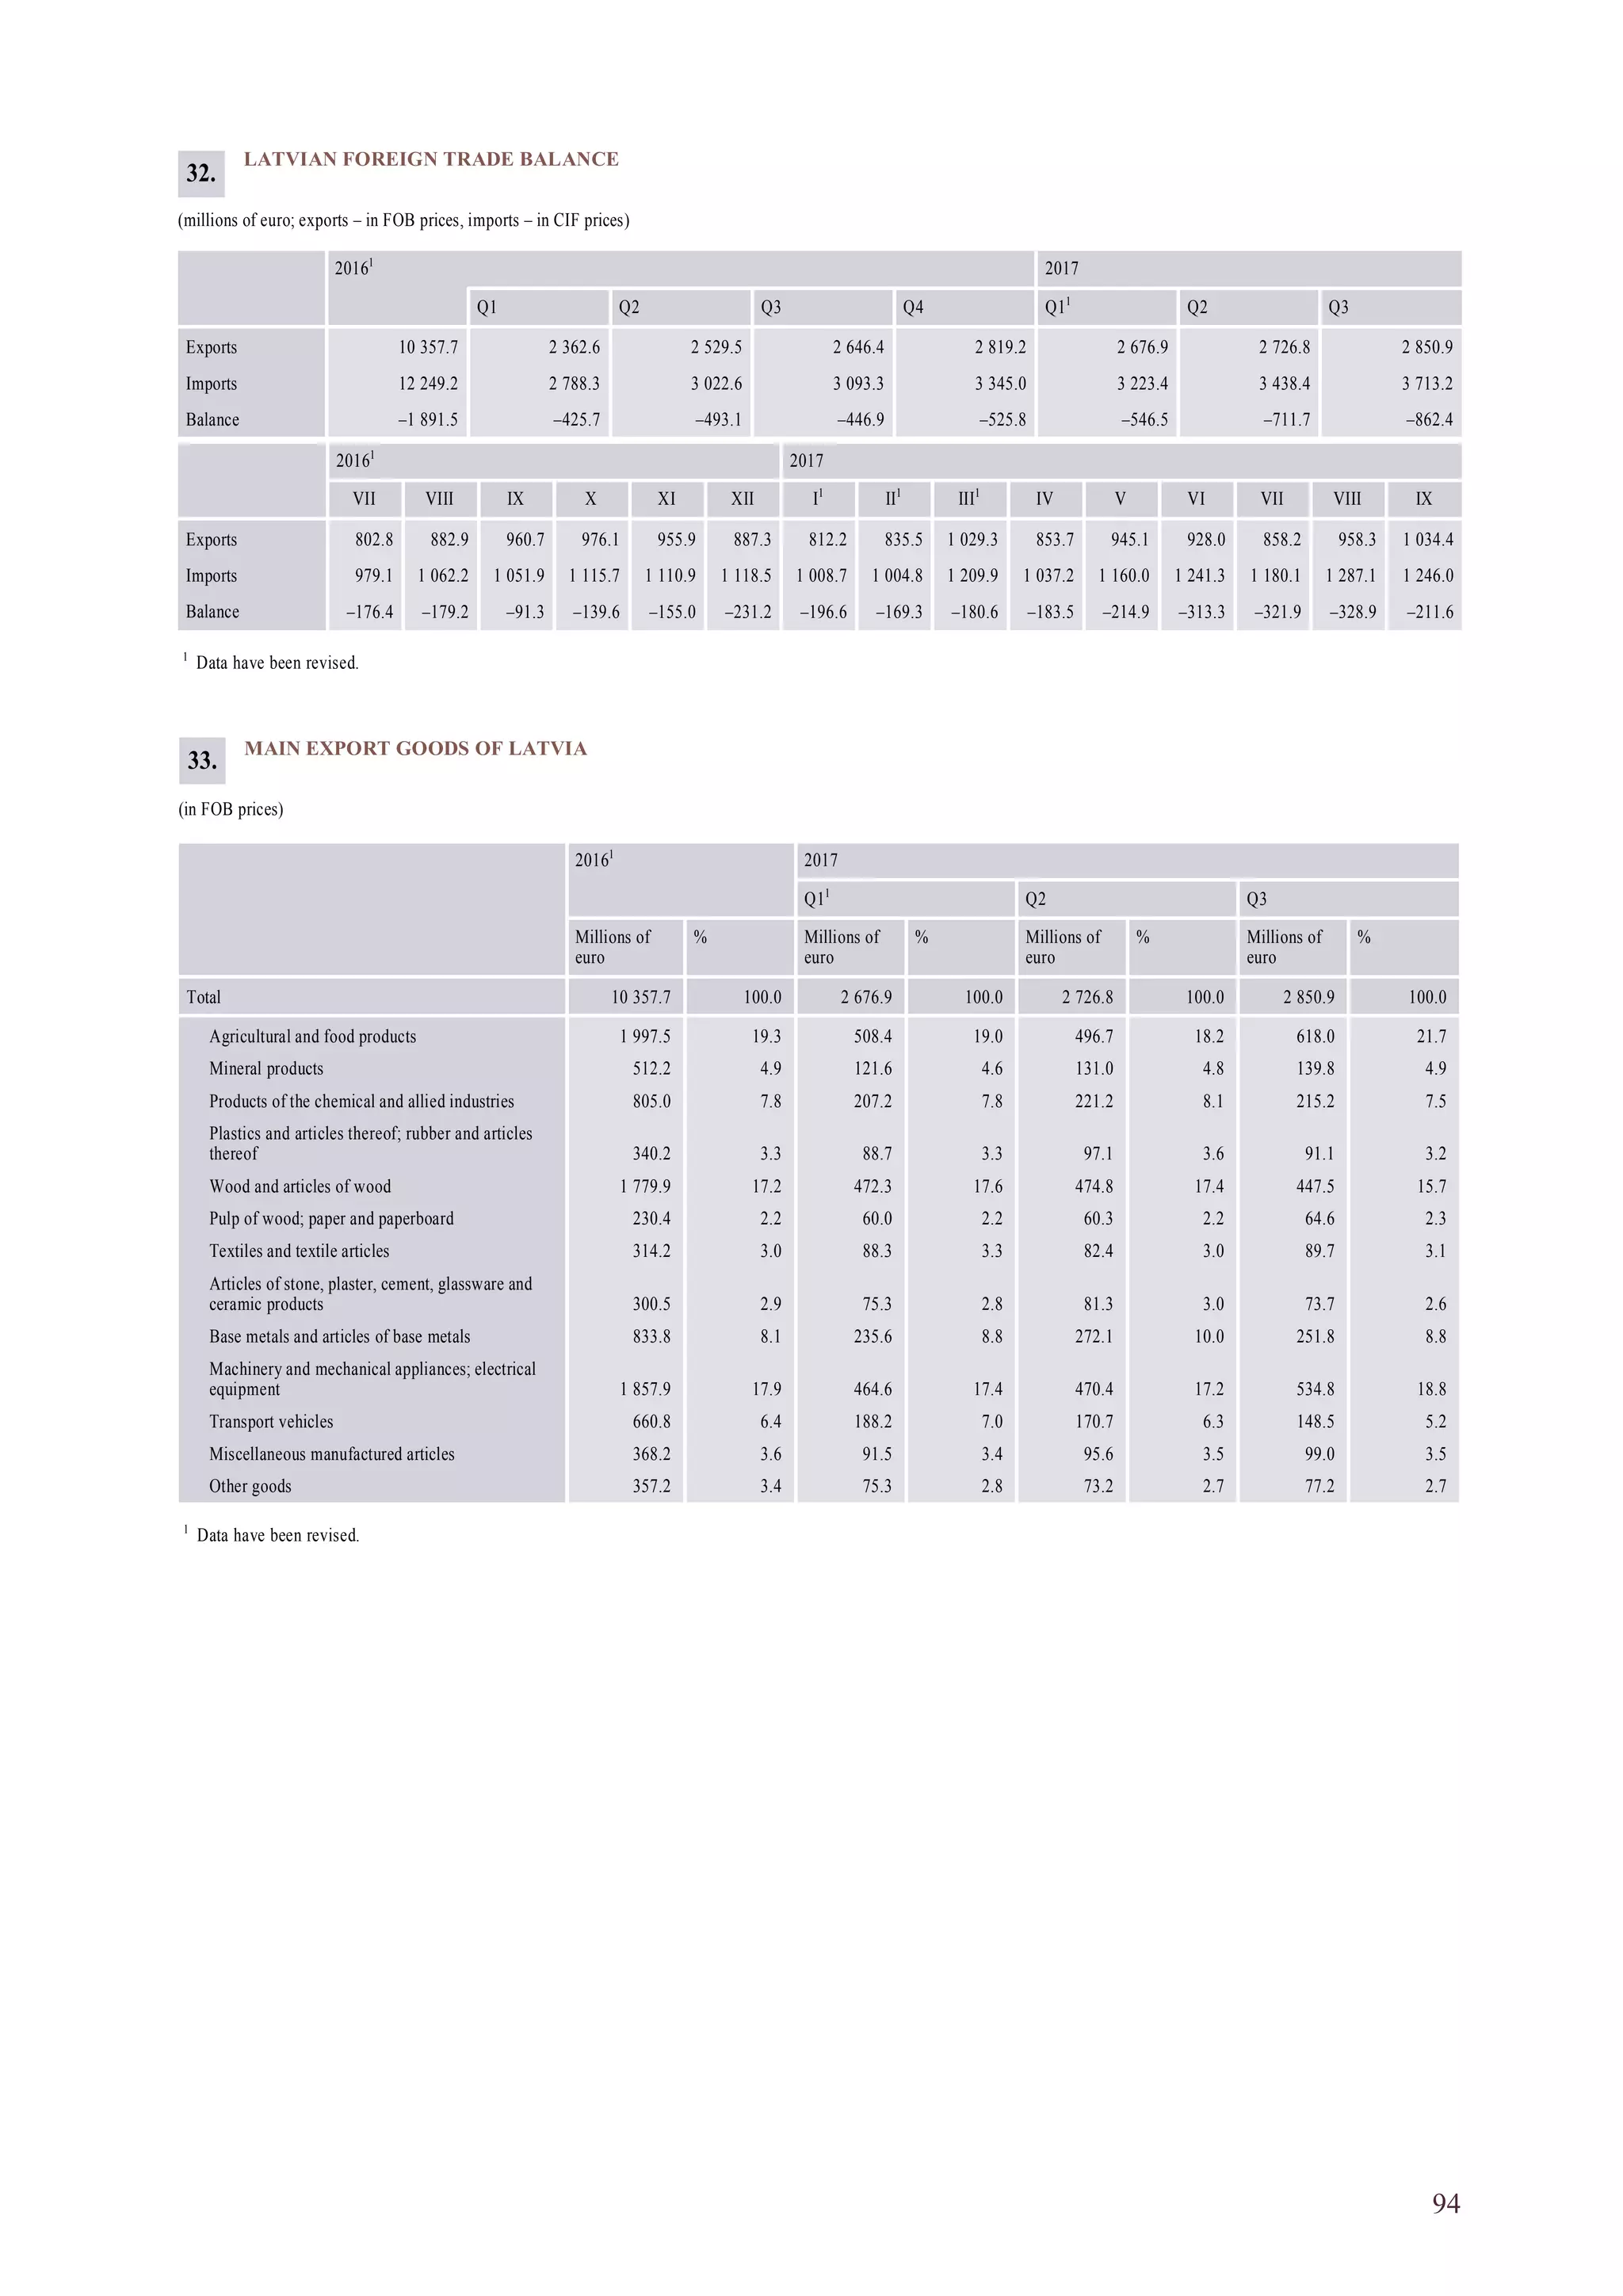
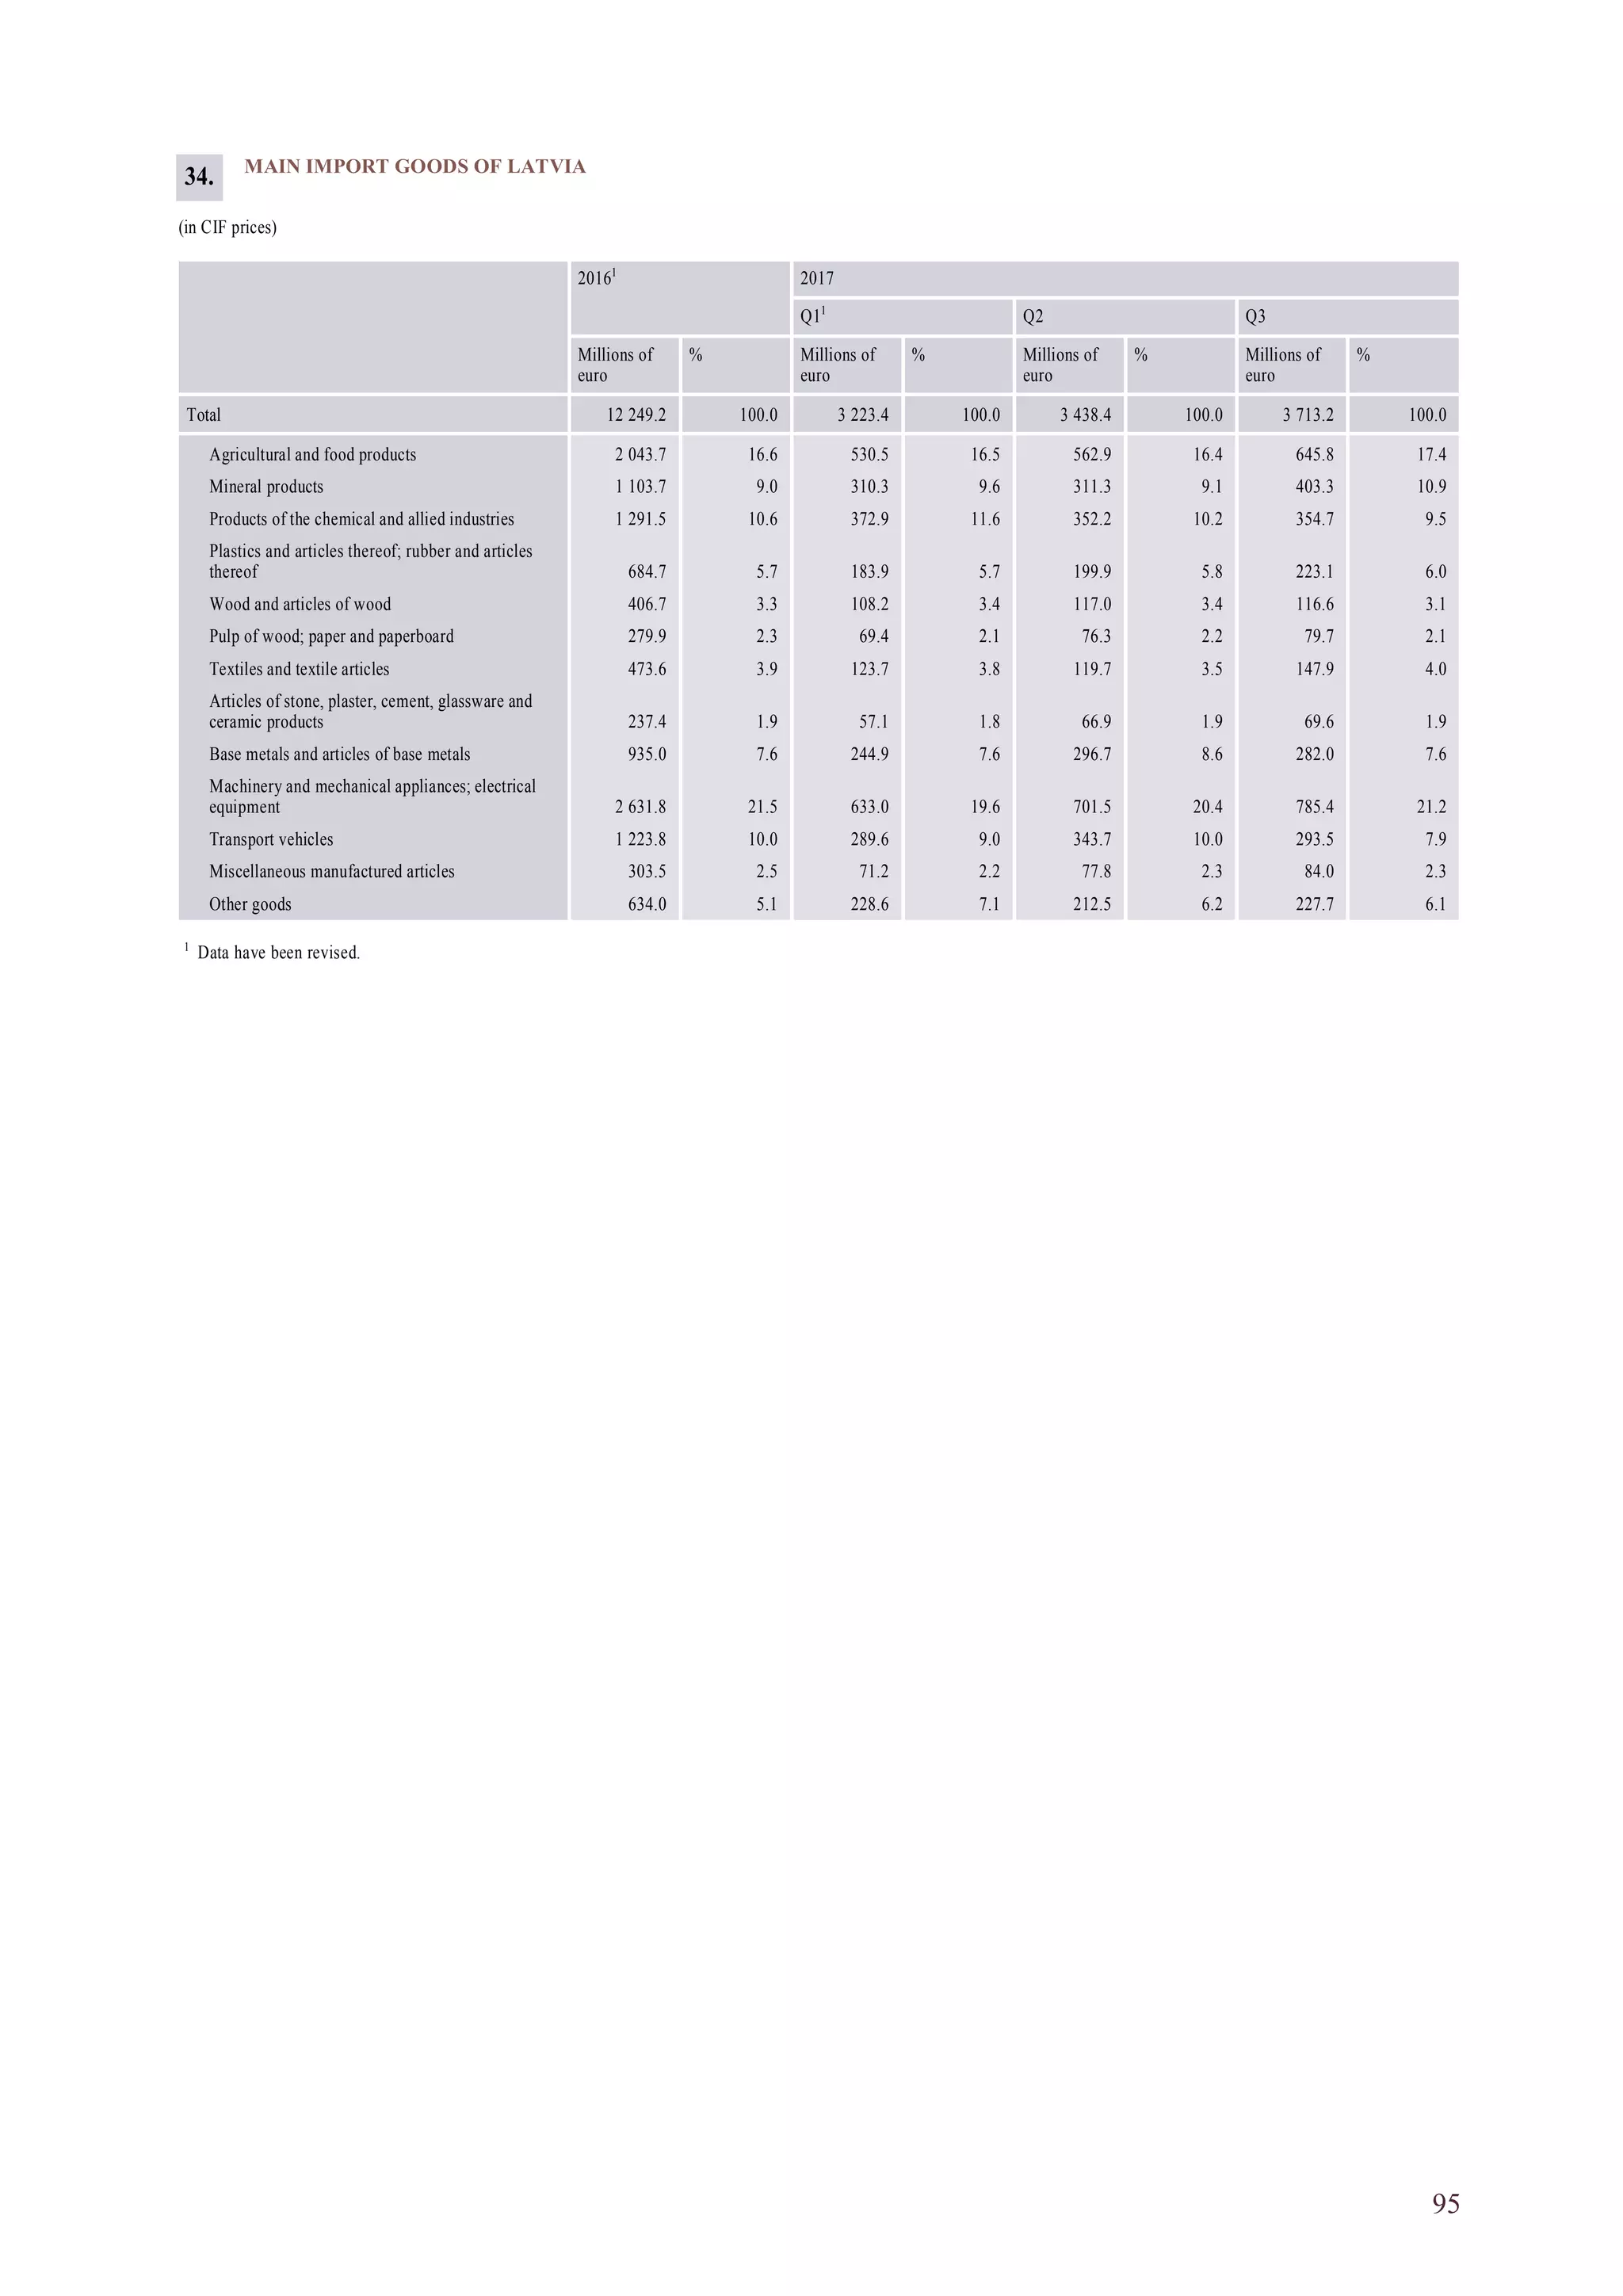
Download to read offline


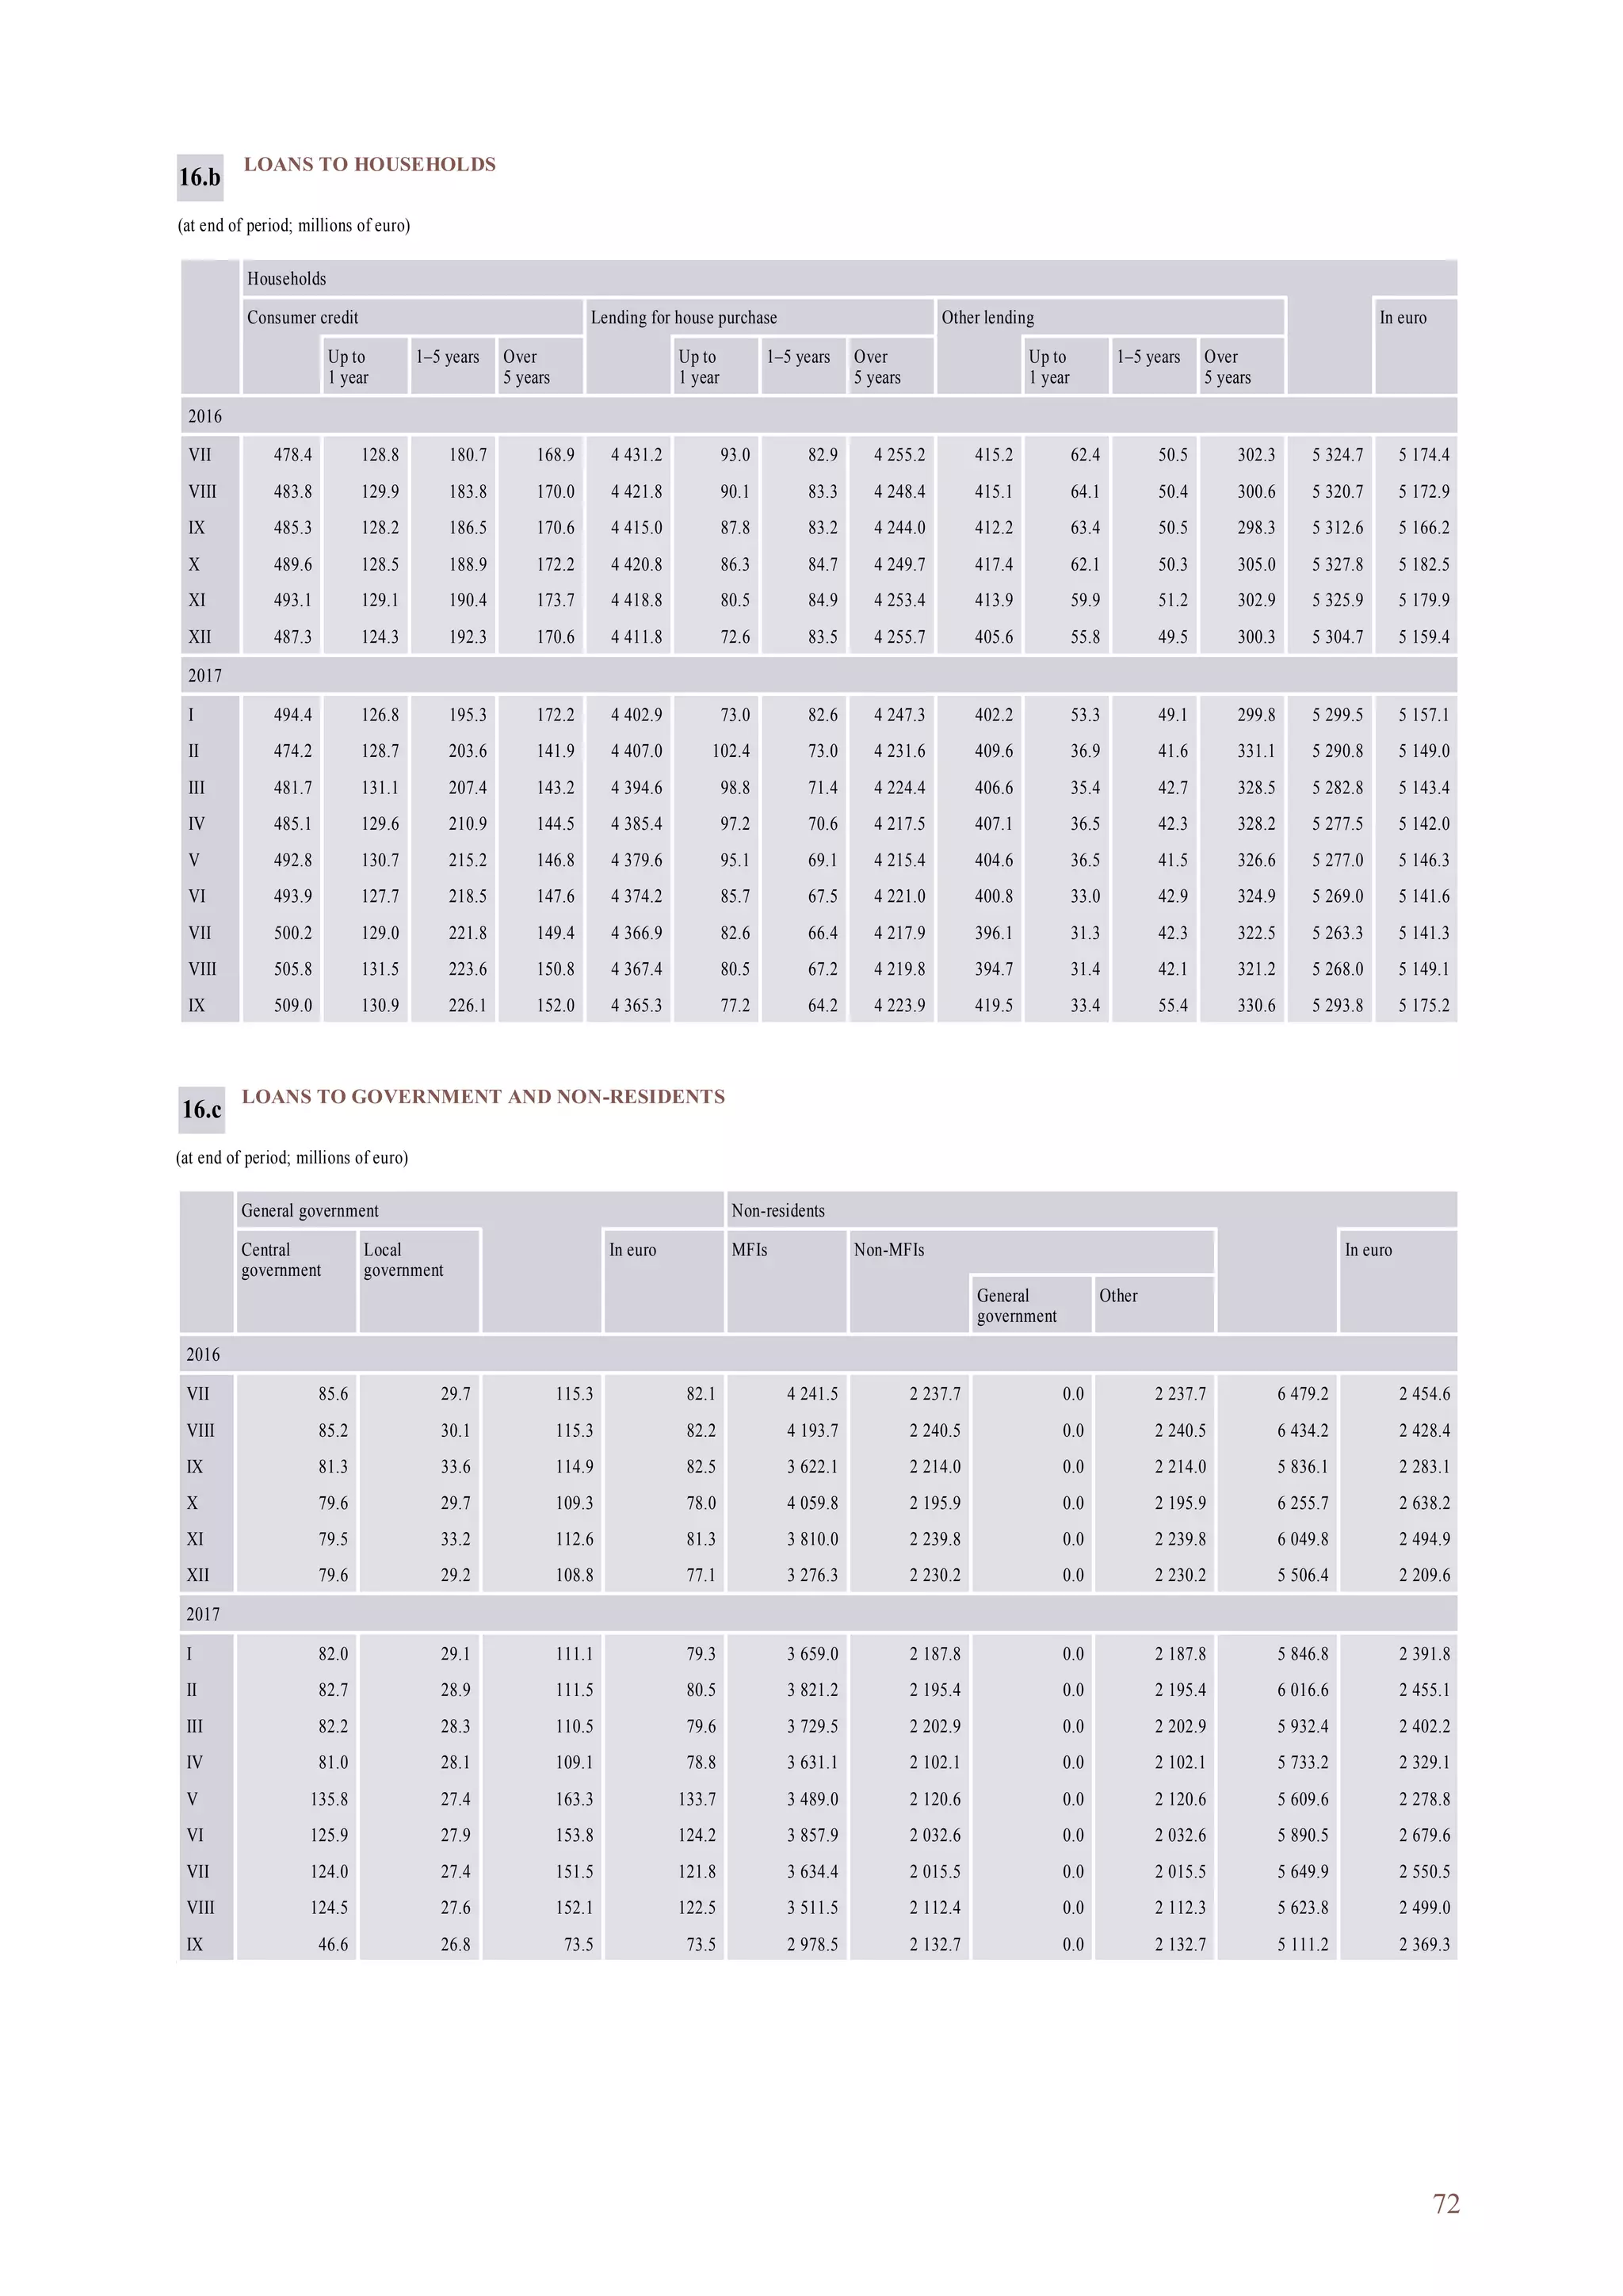
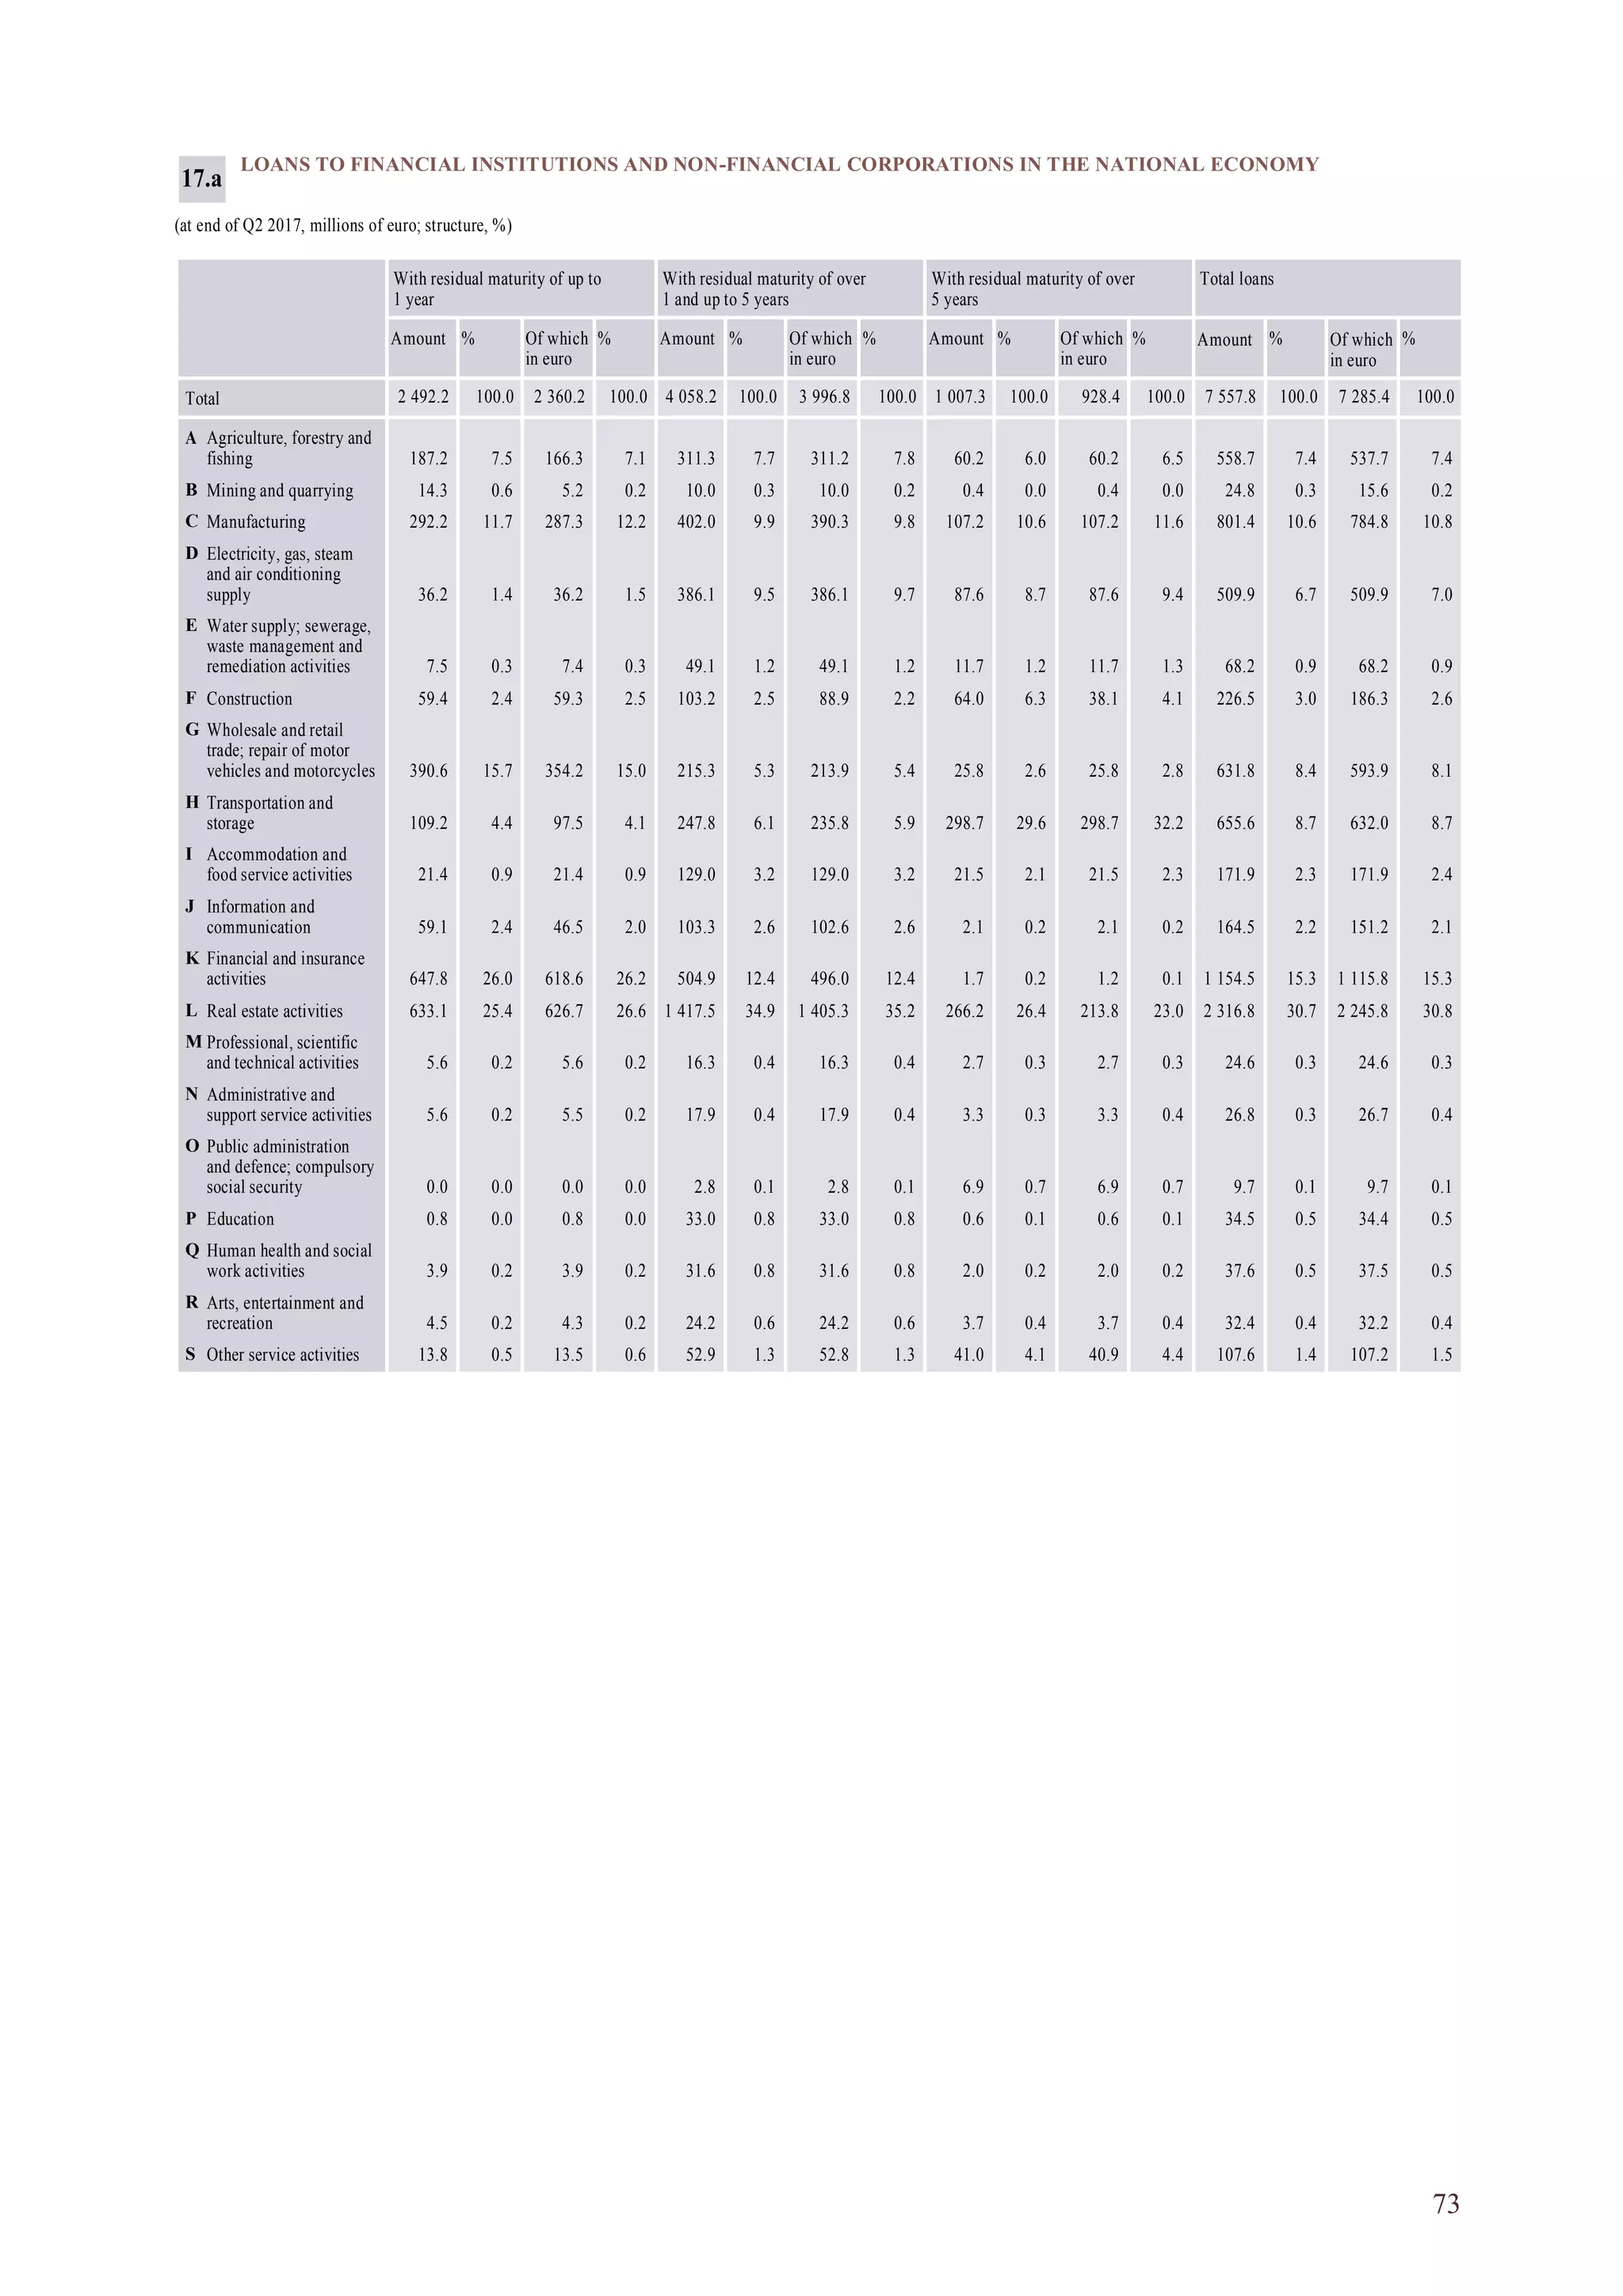
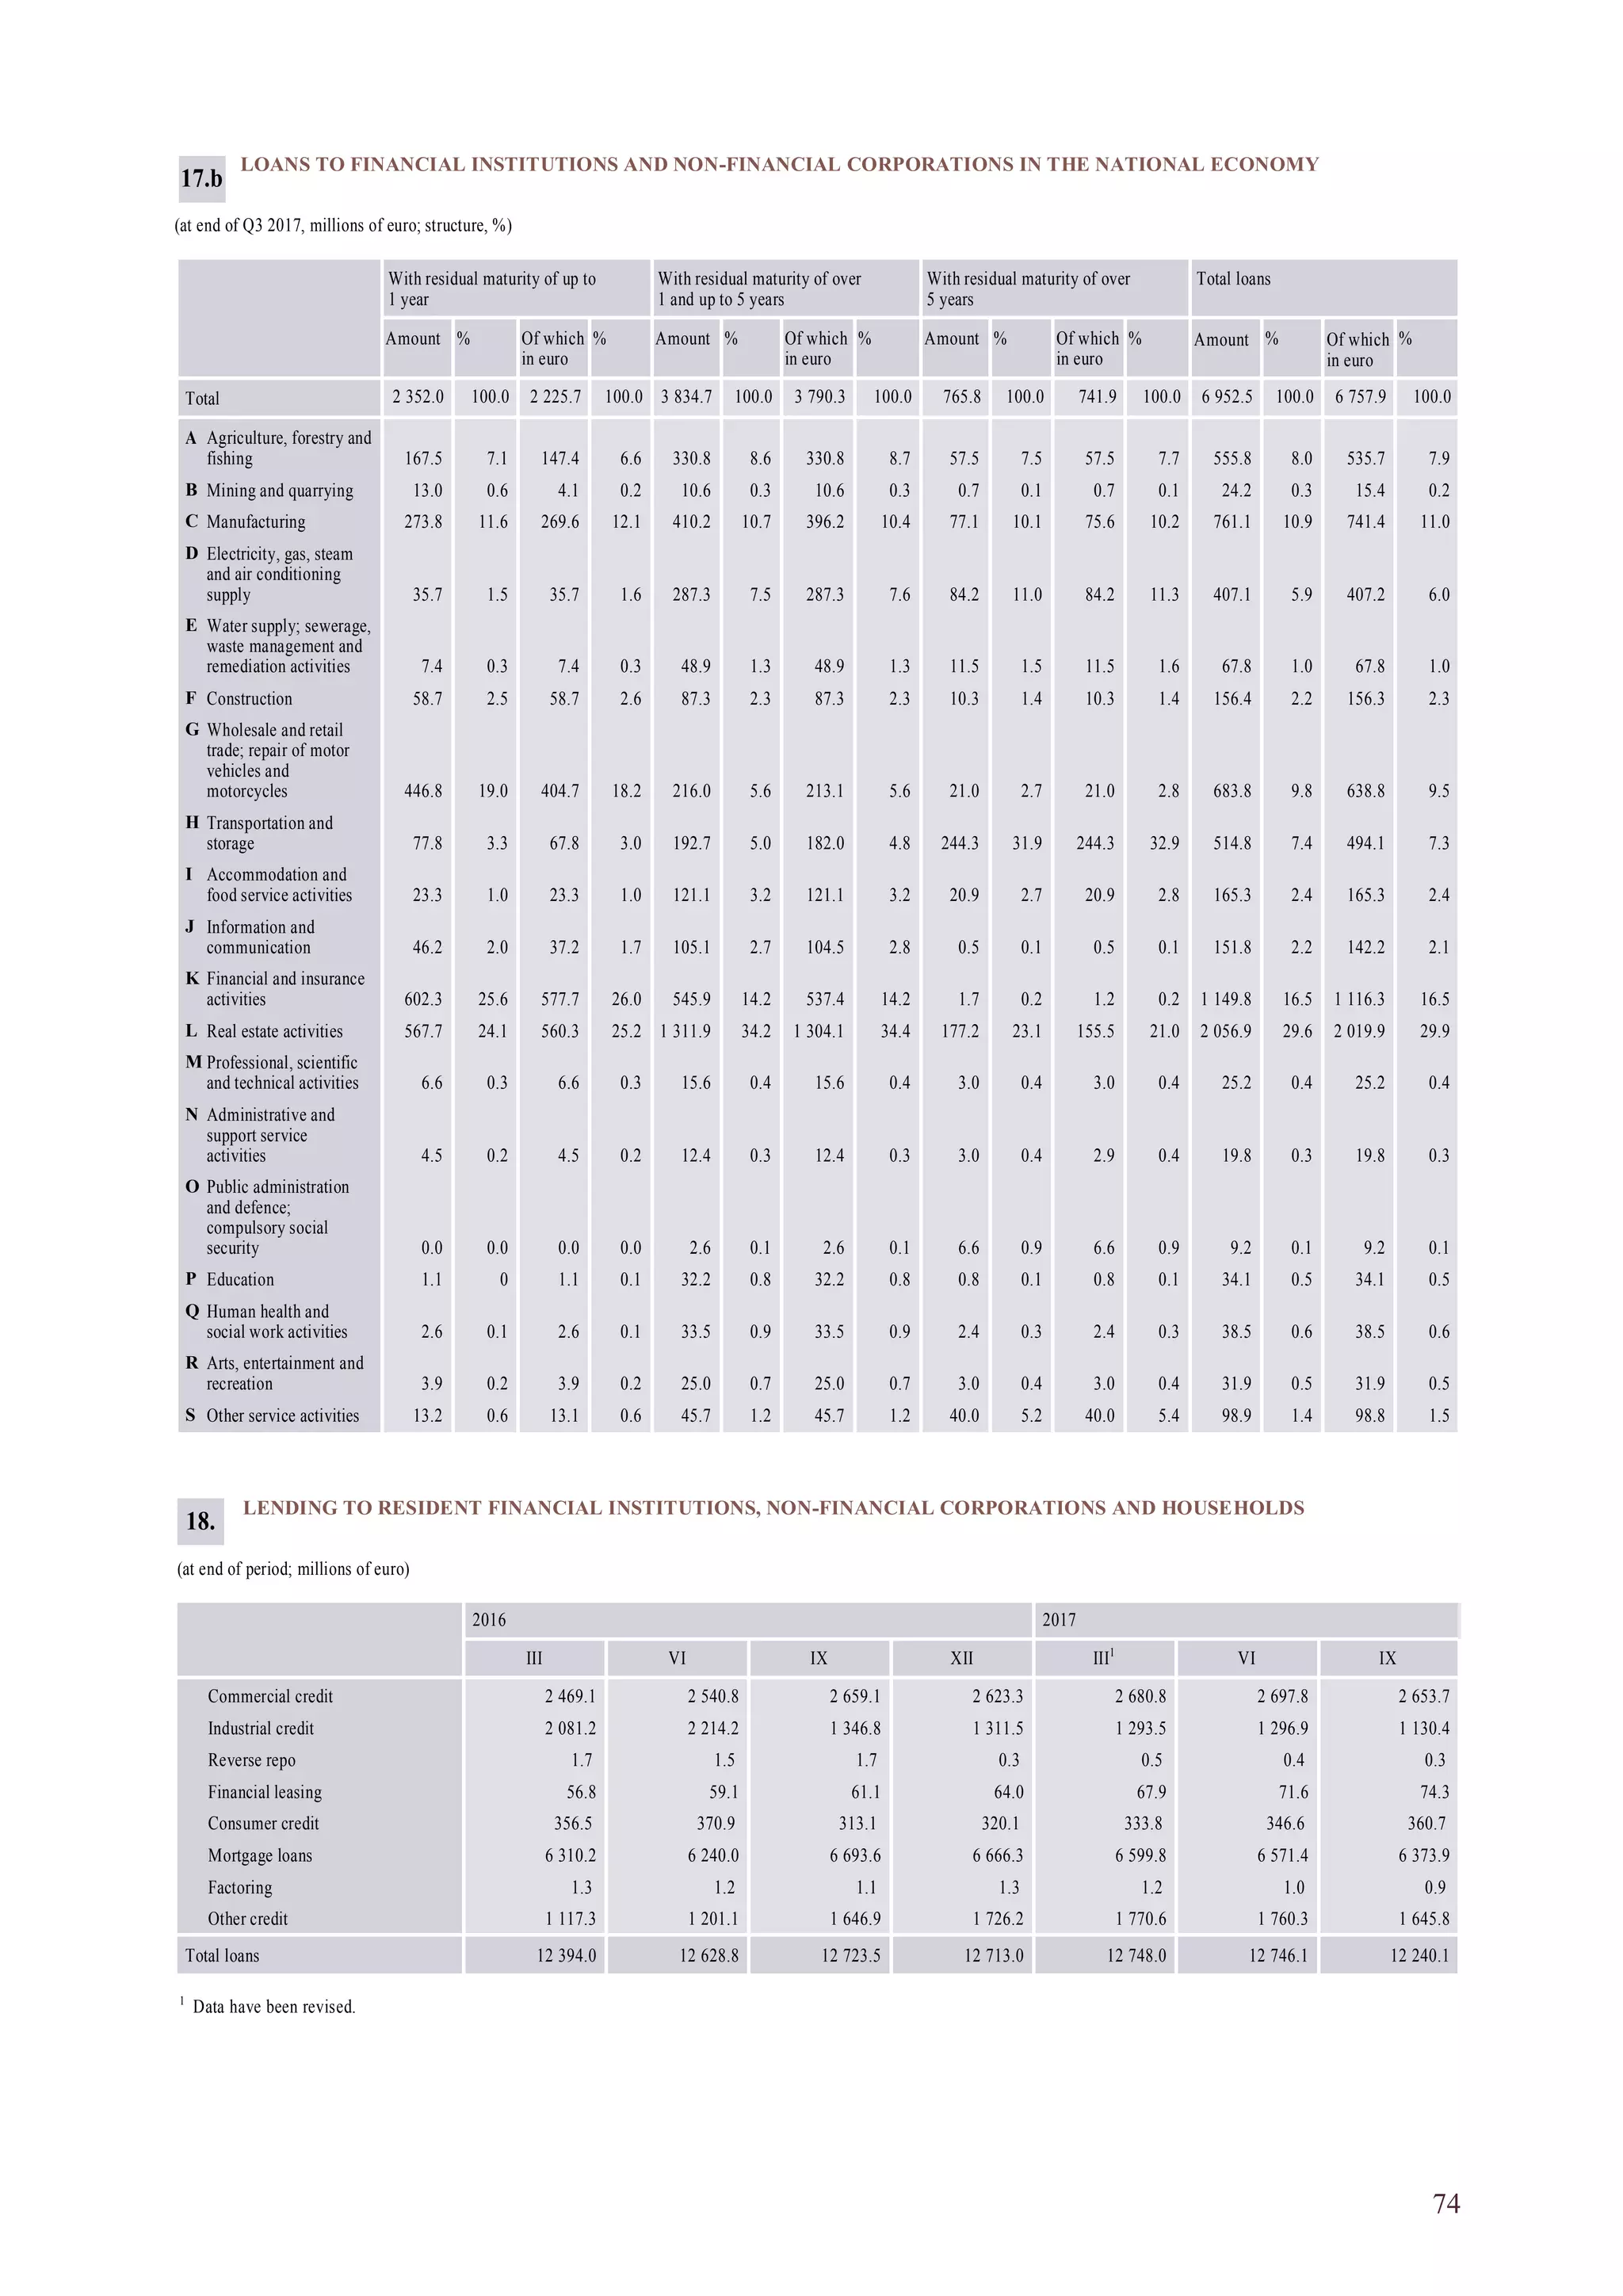
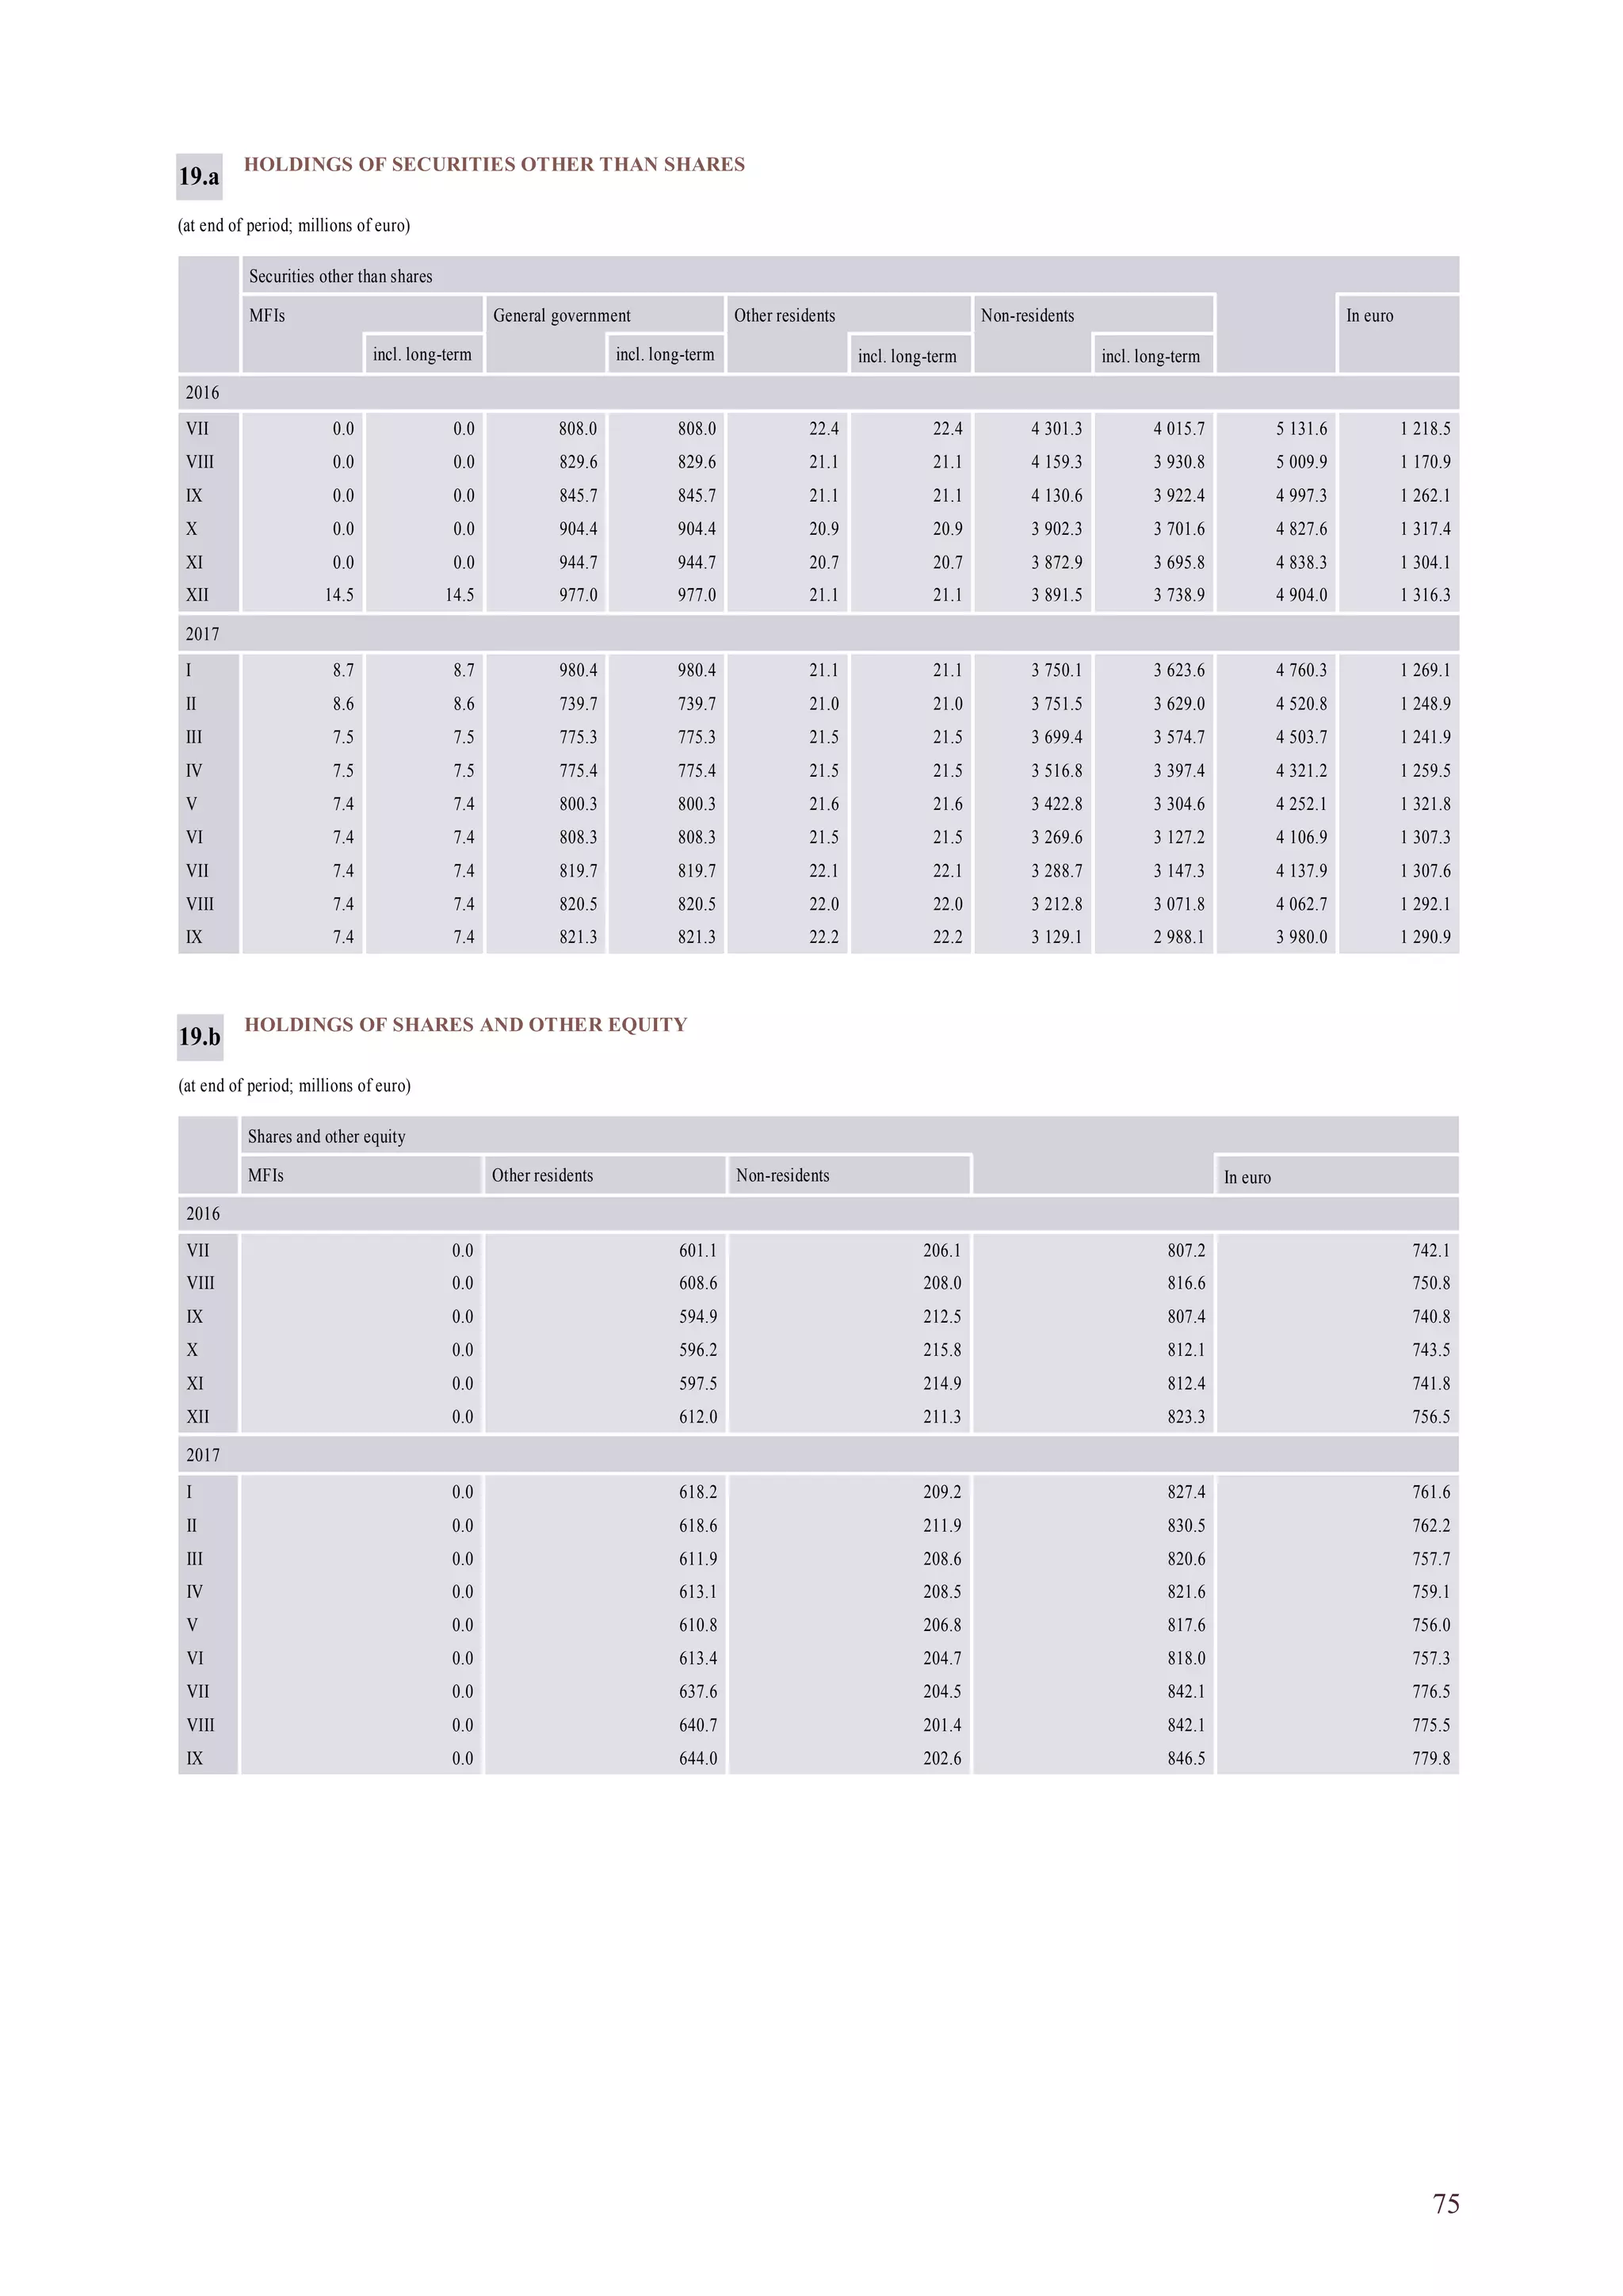
![44
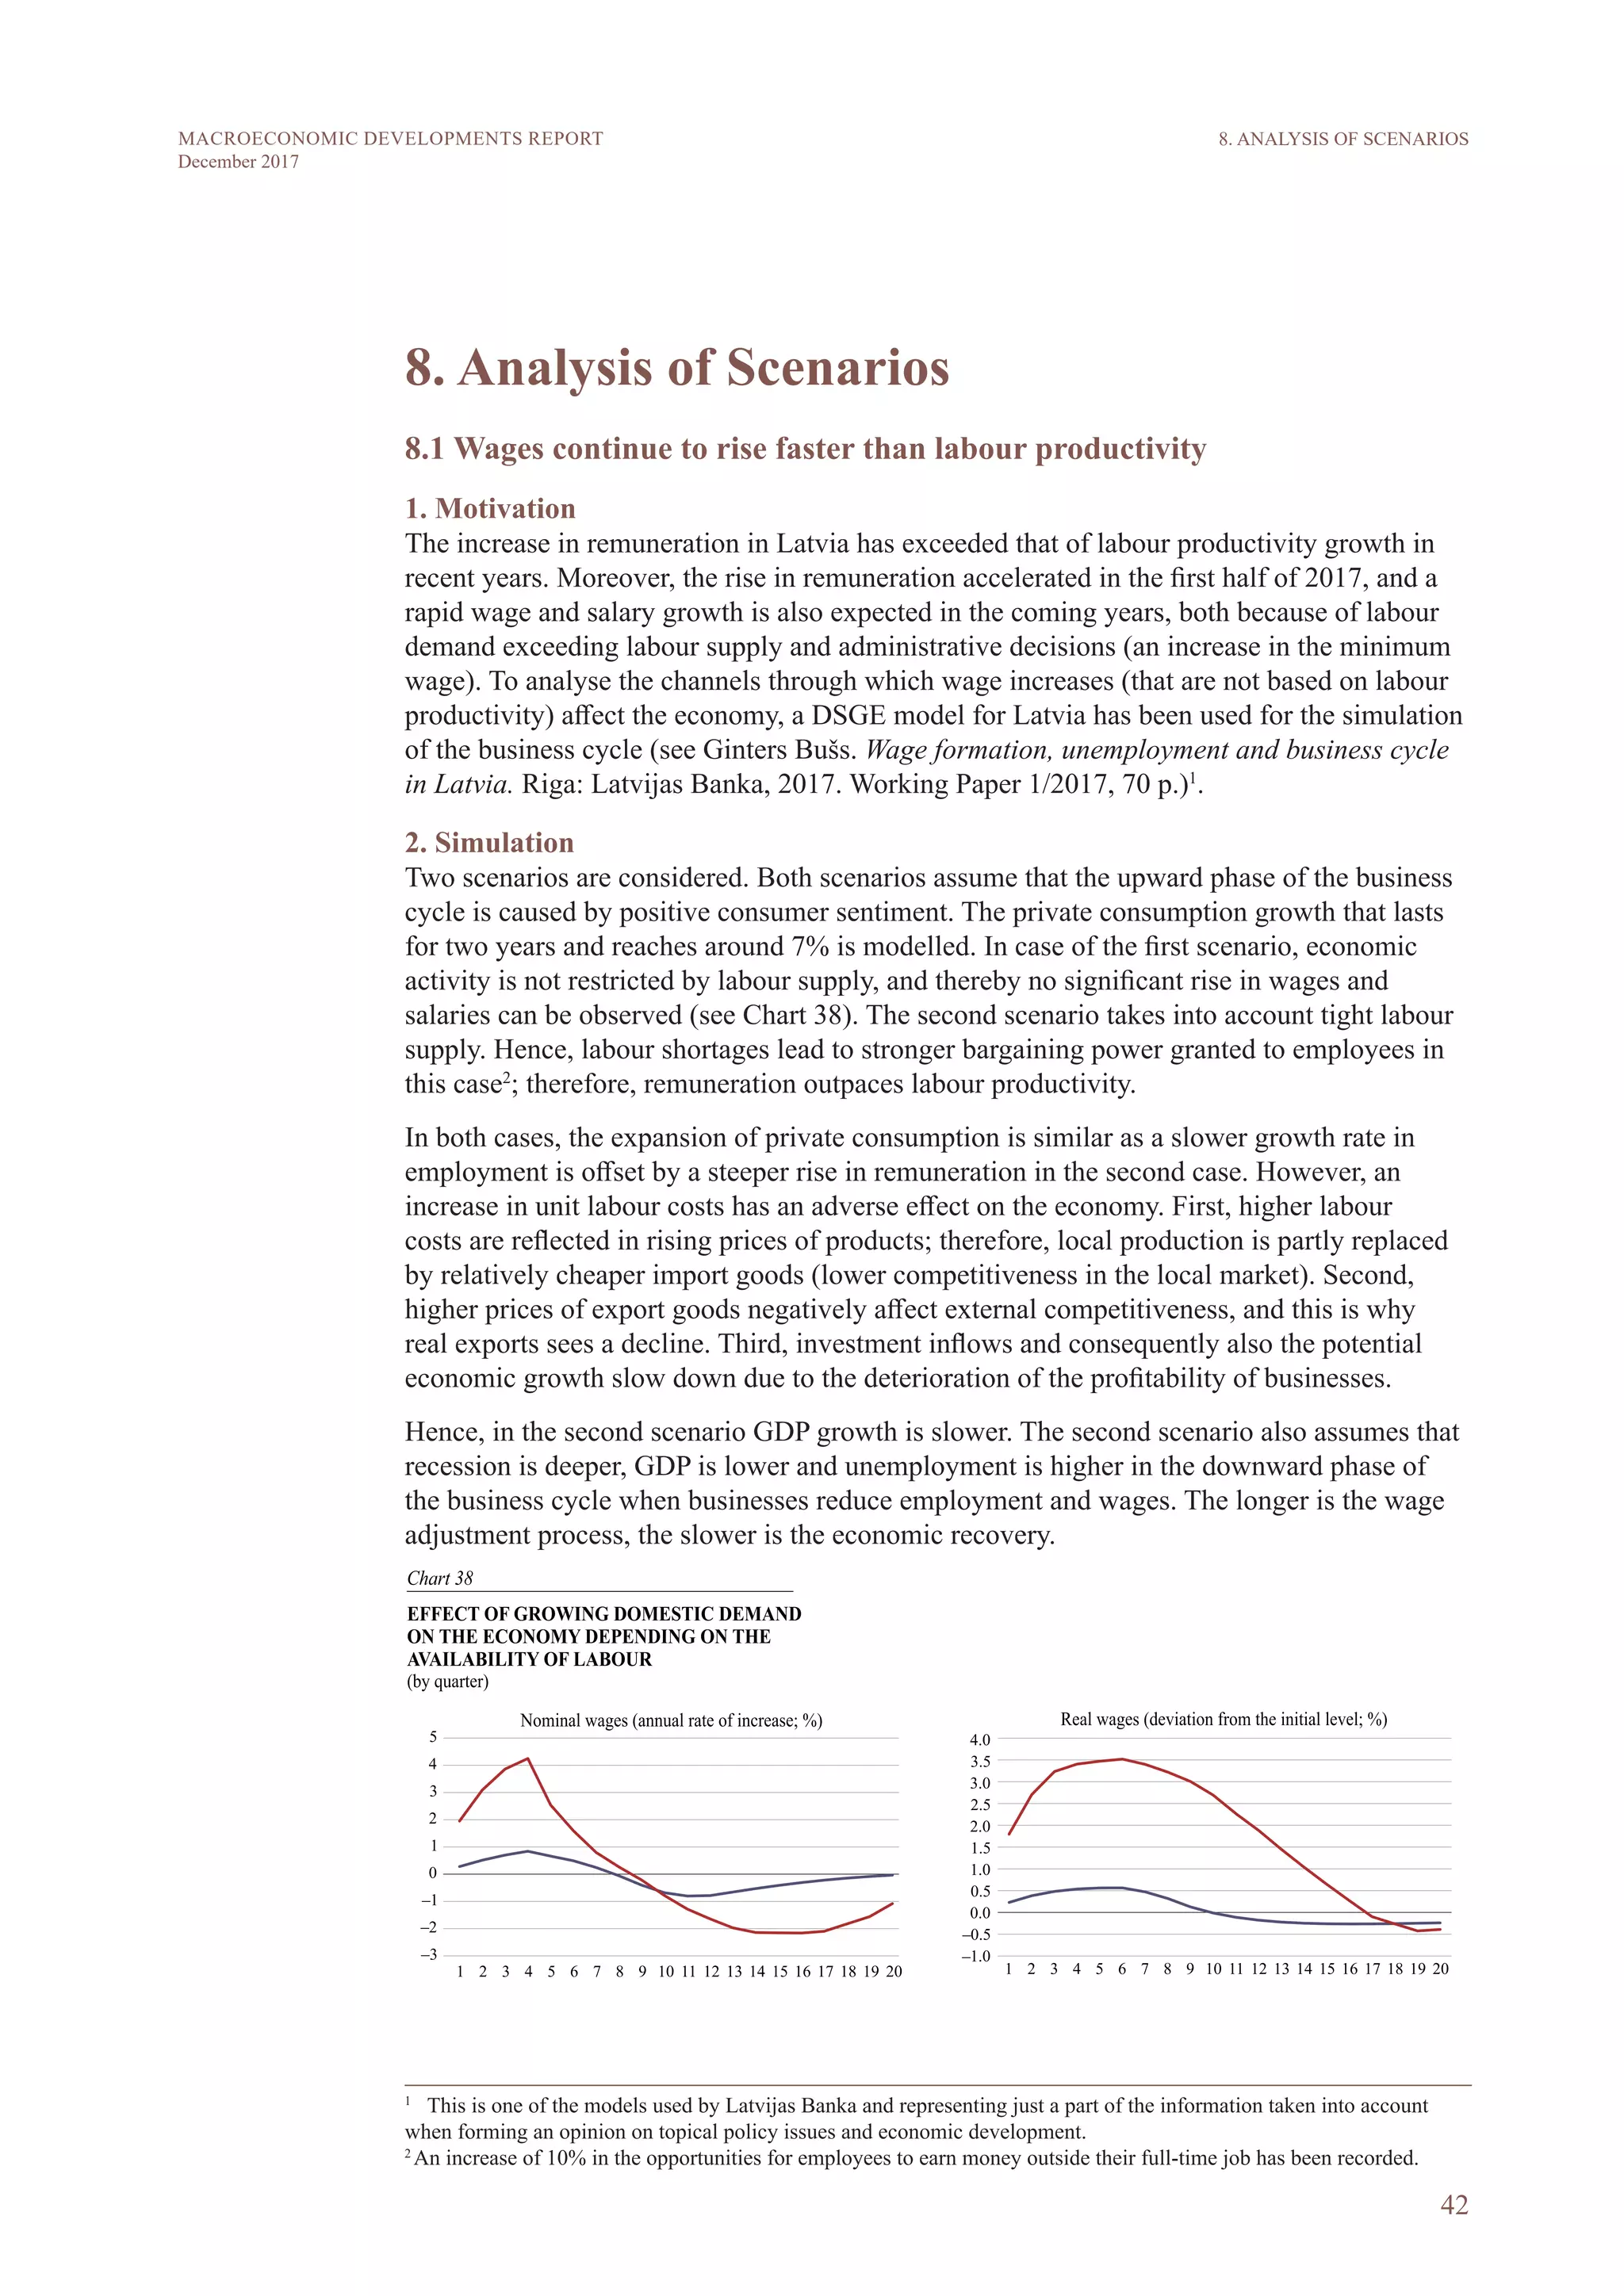
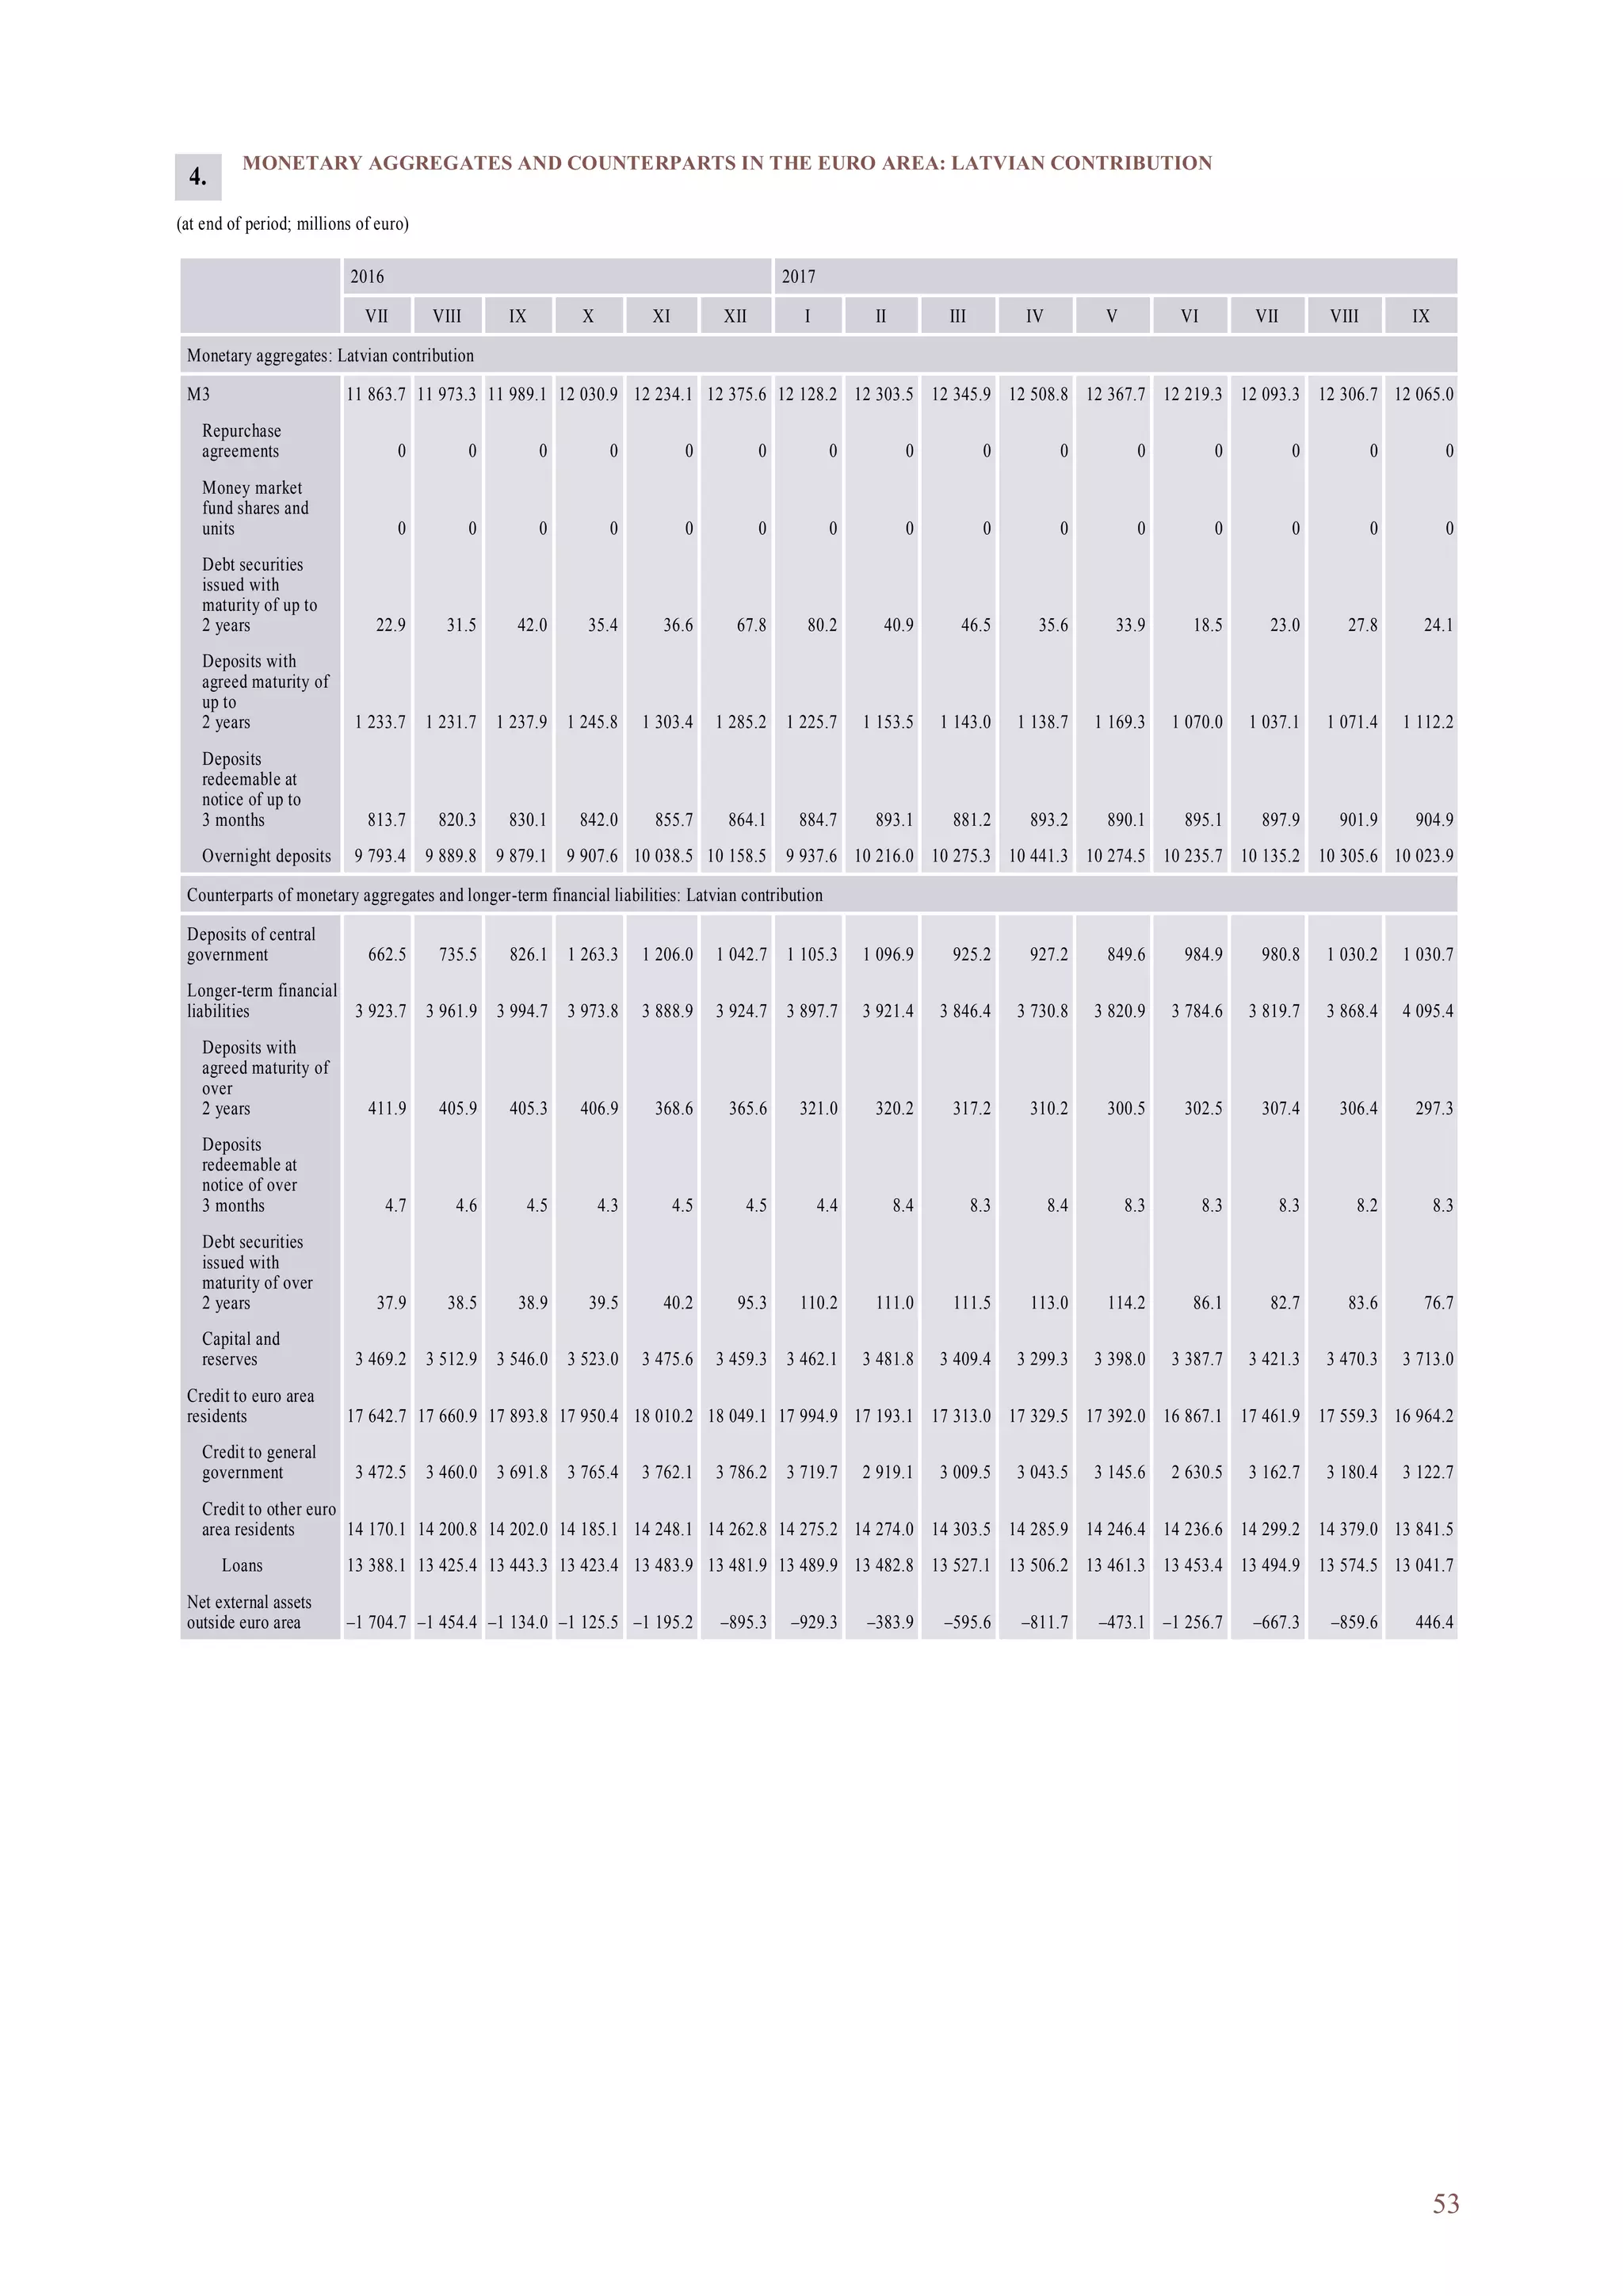
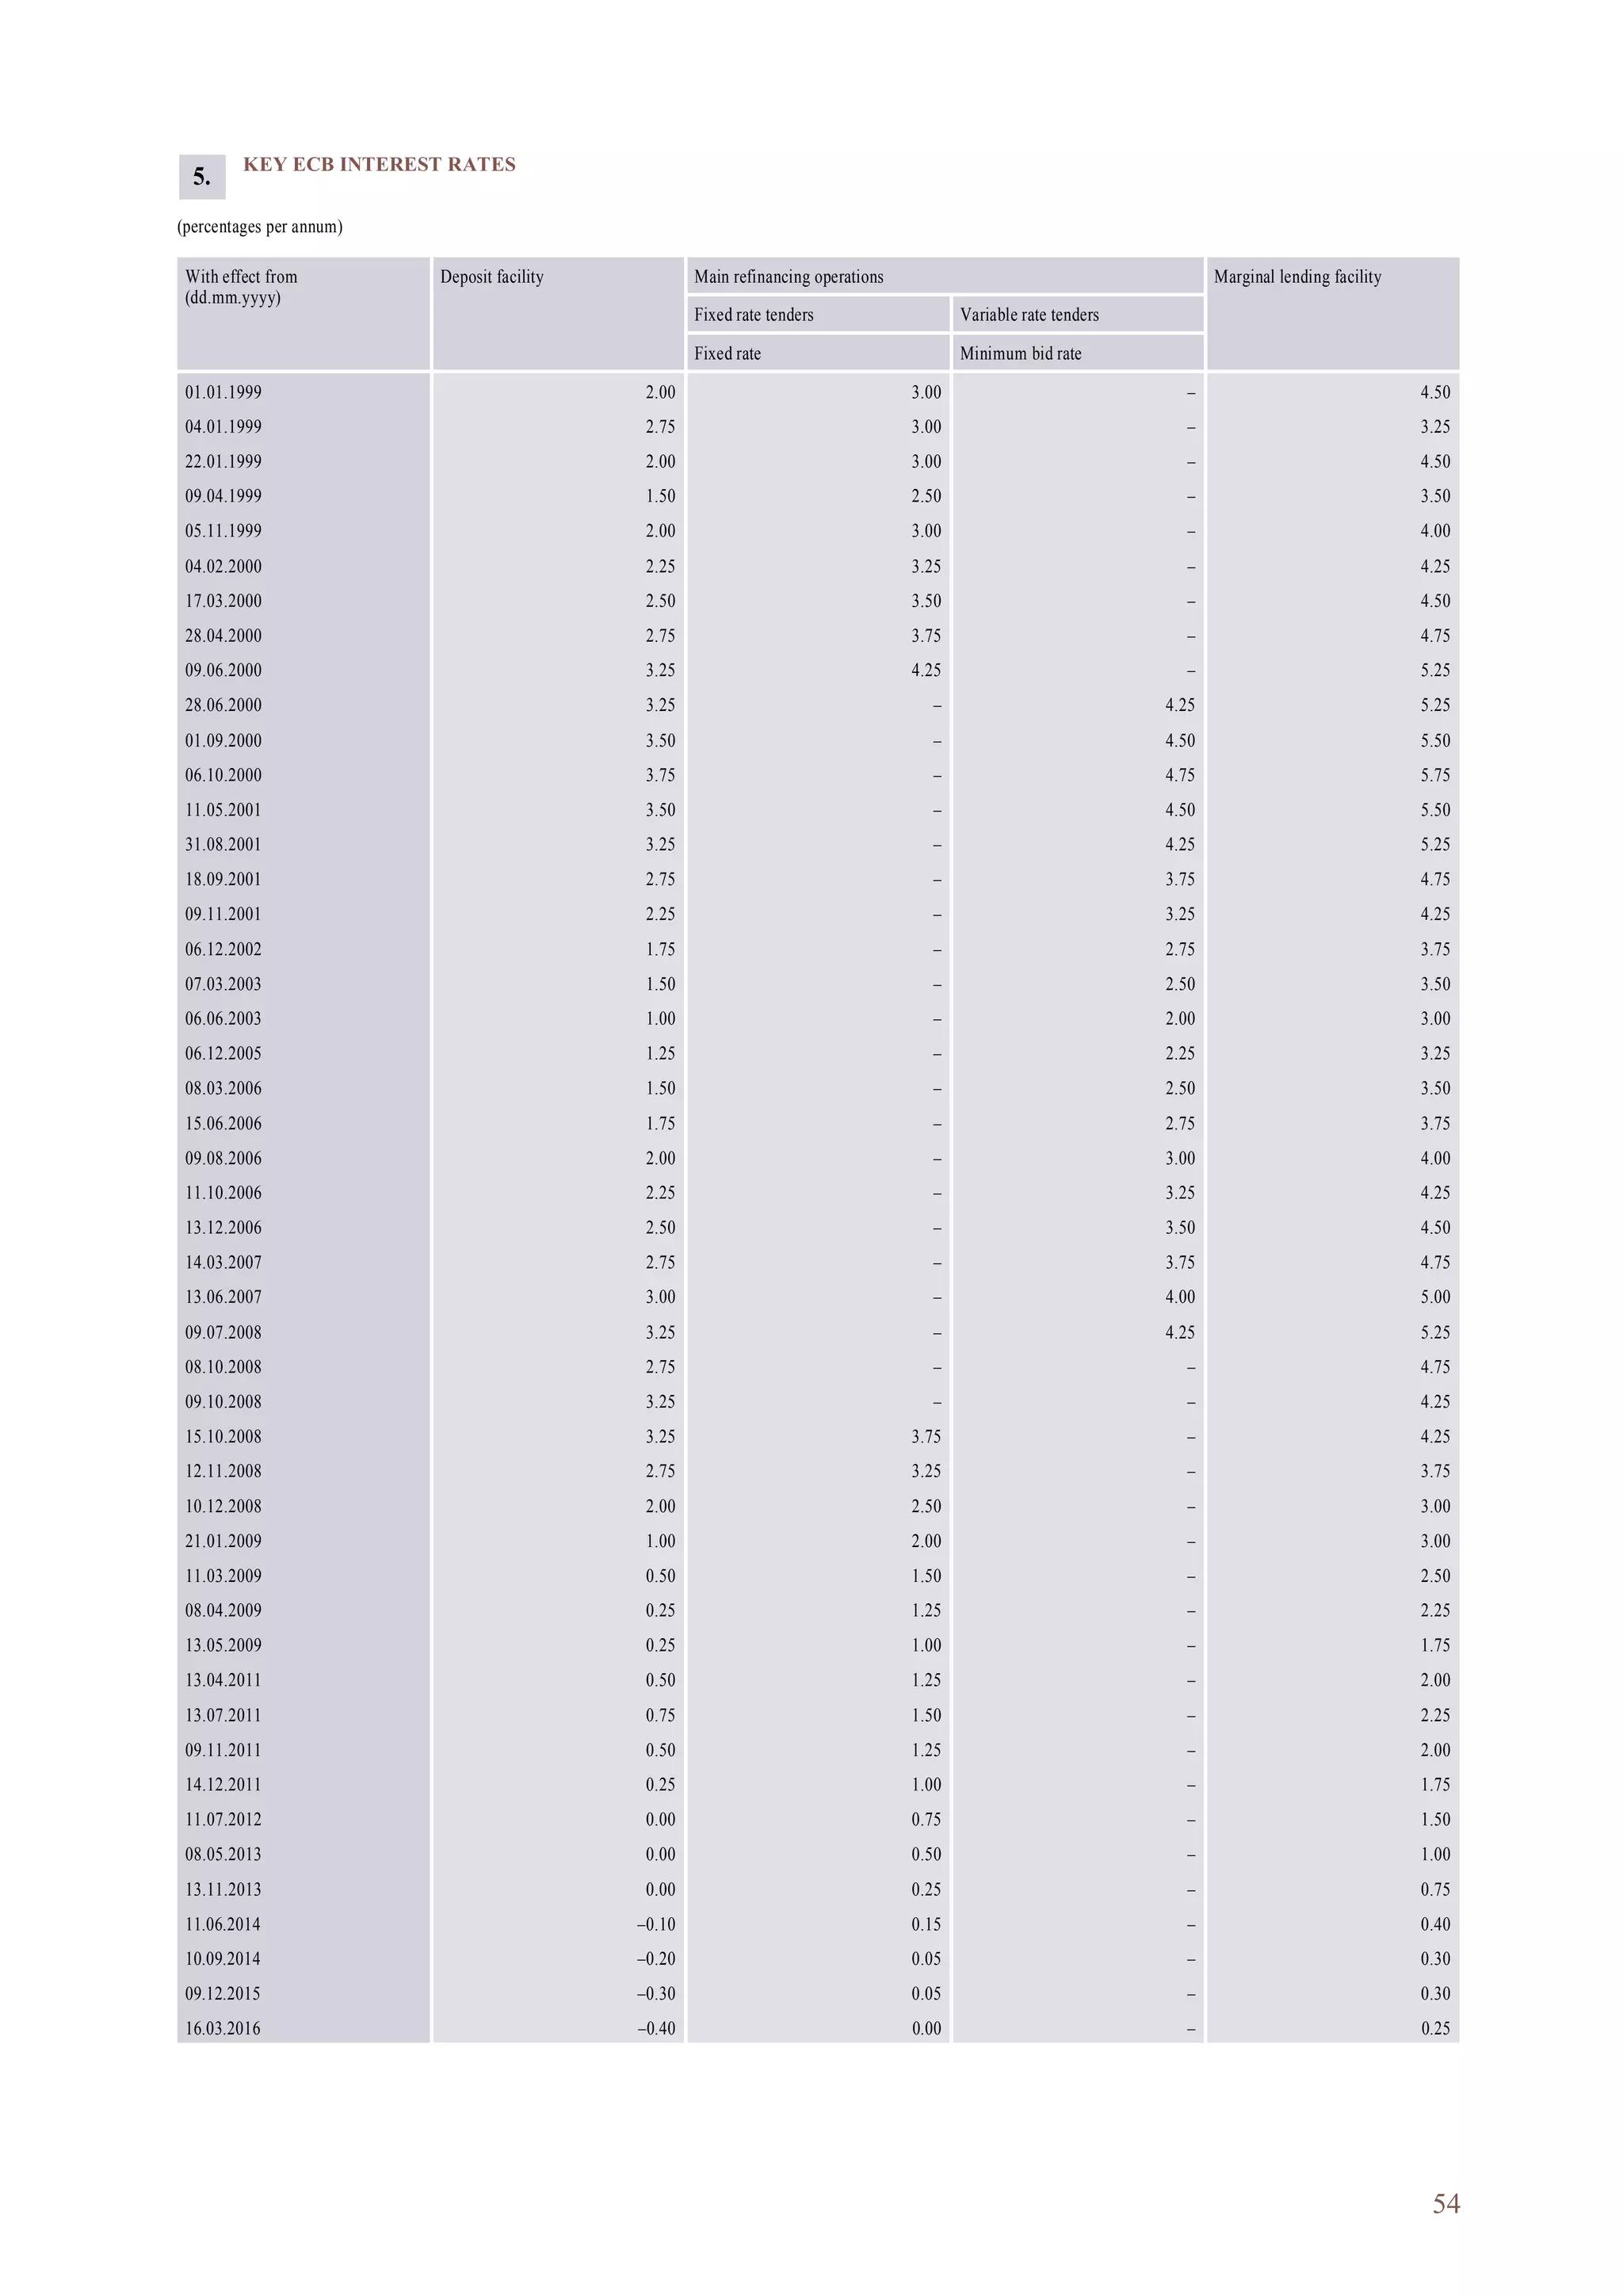
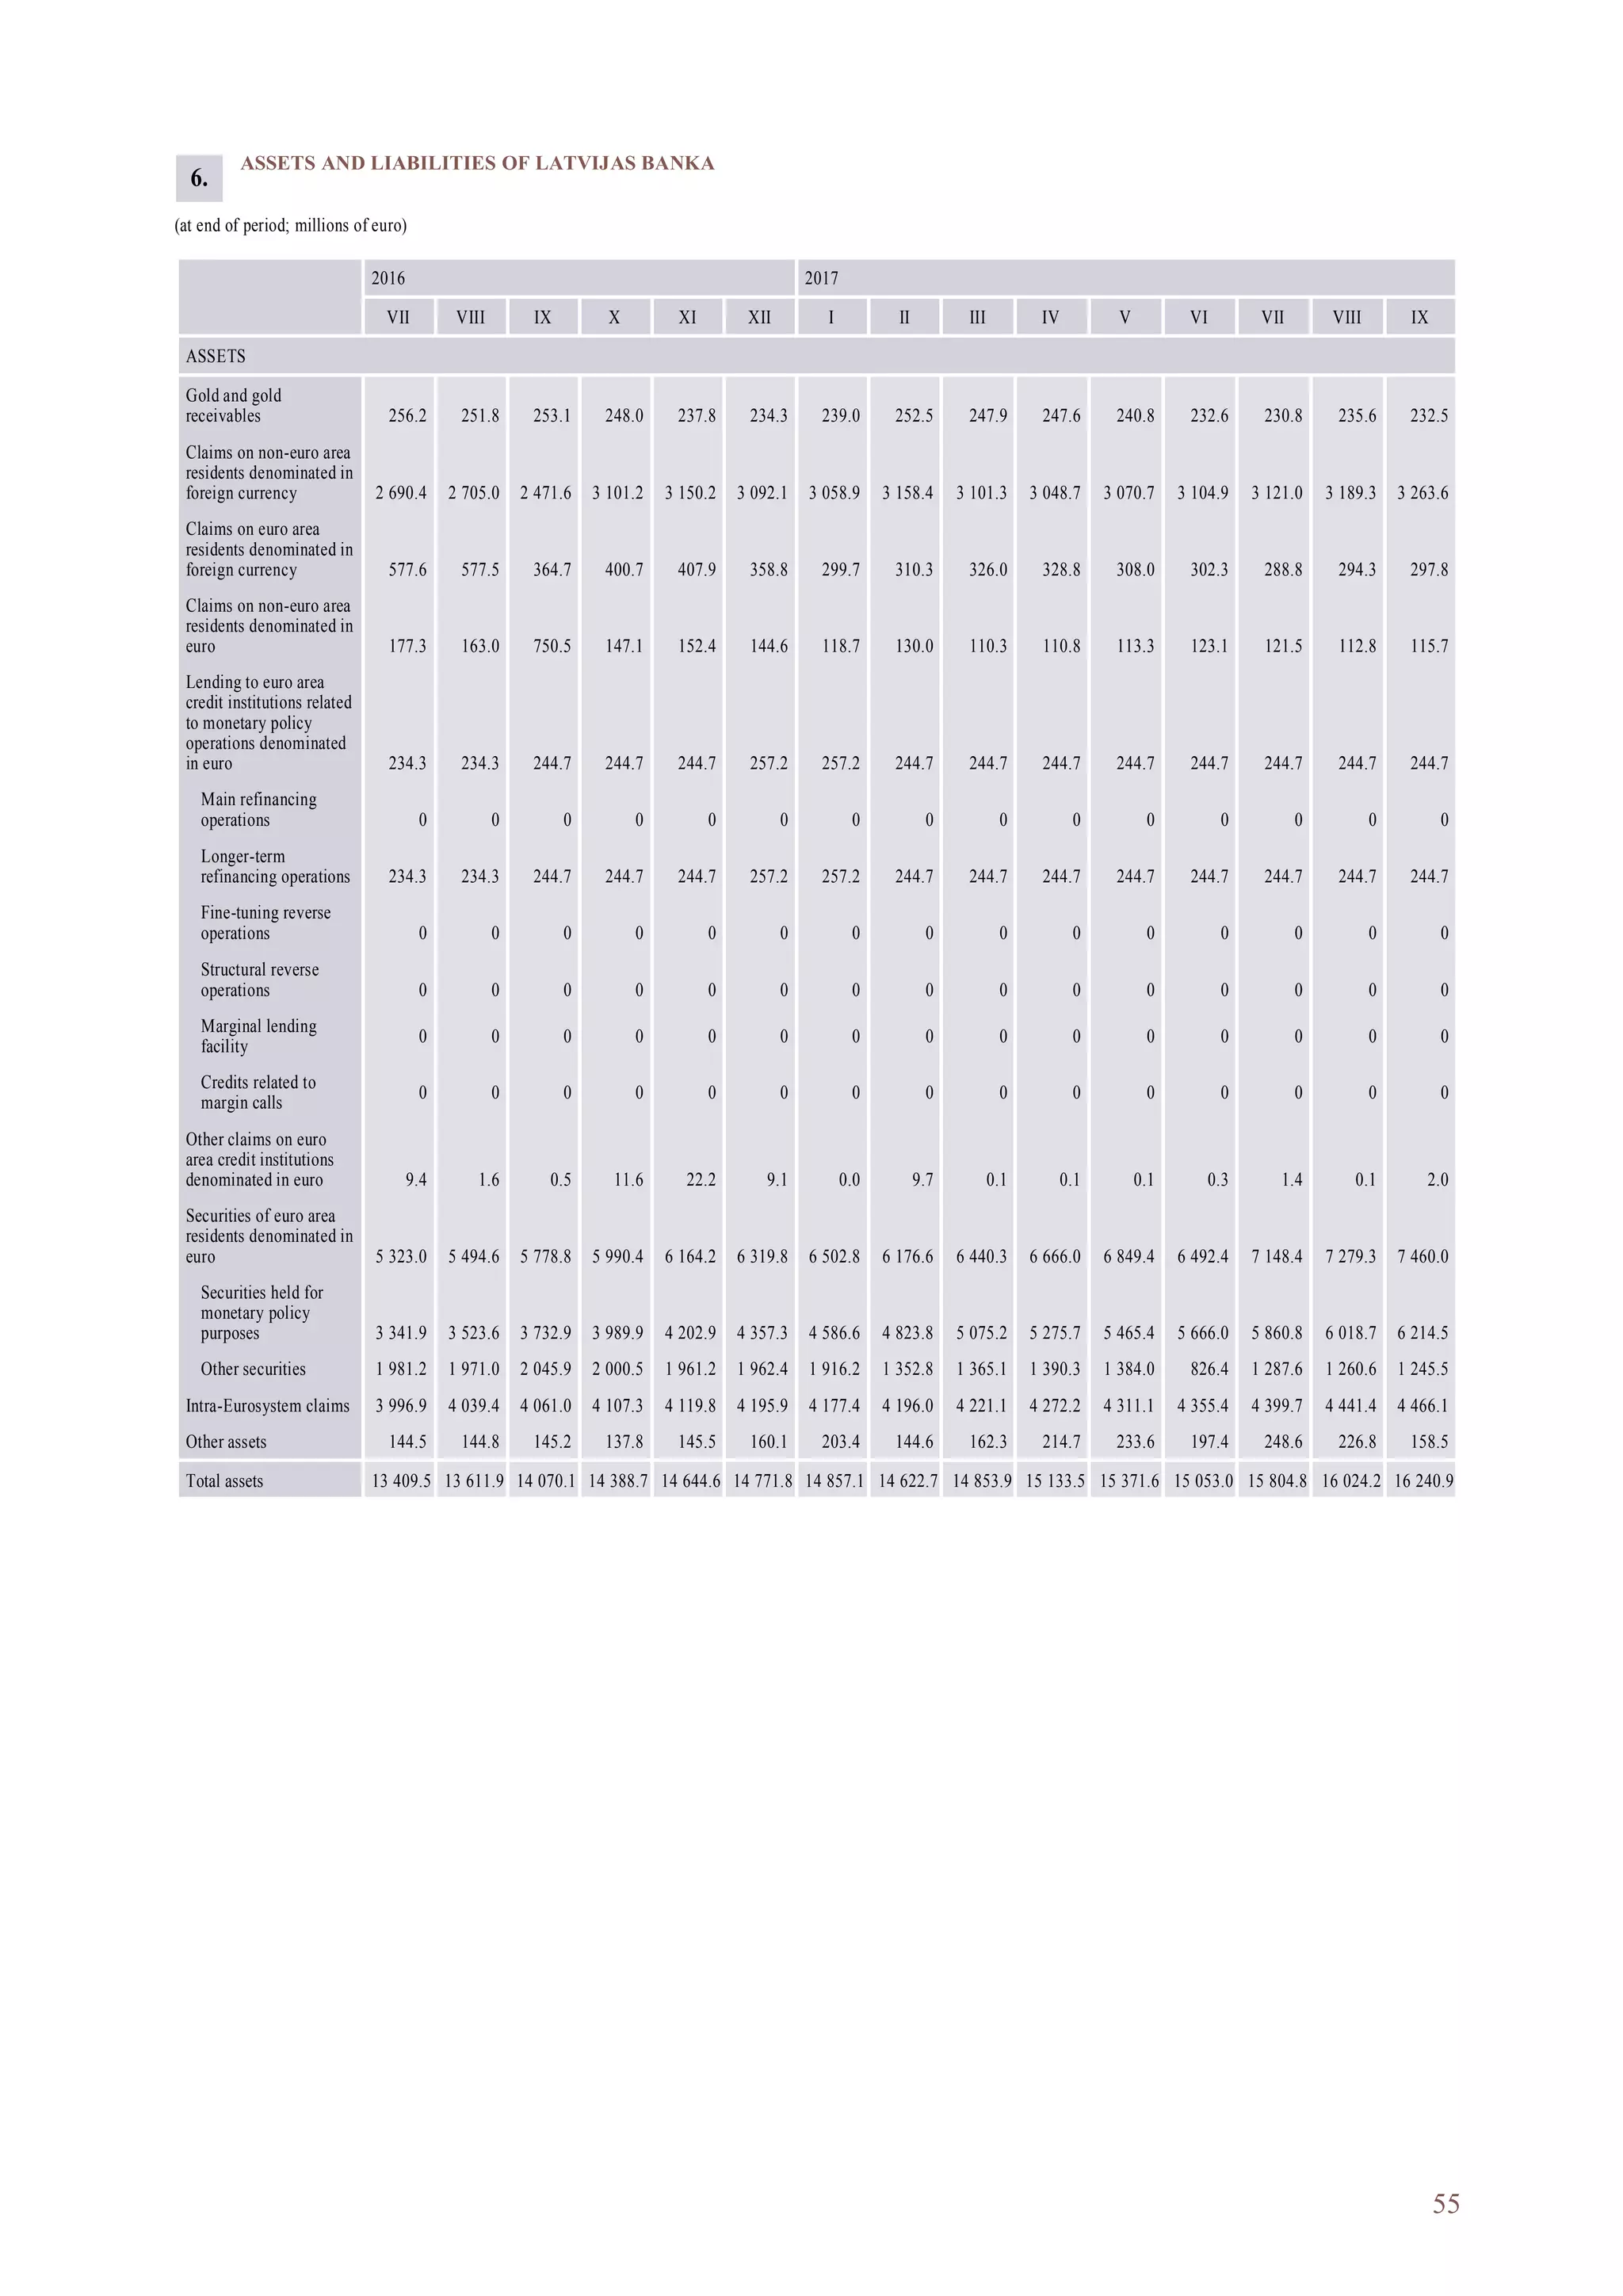
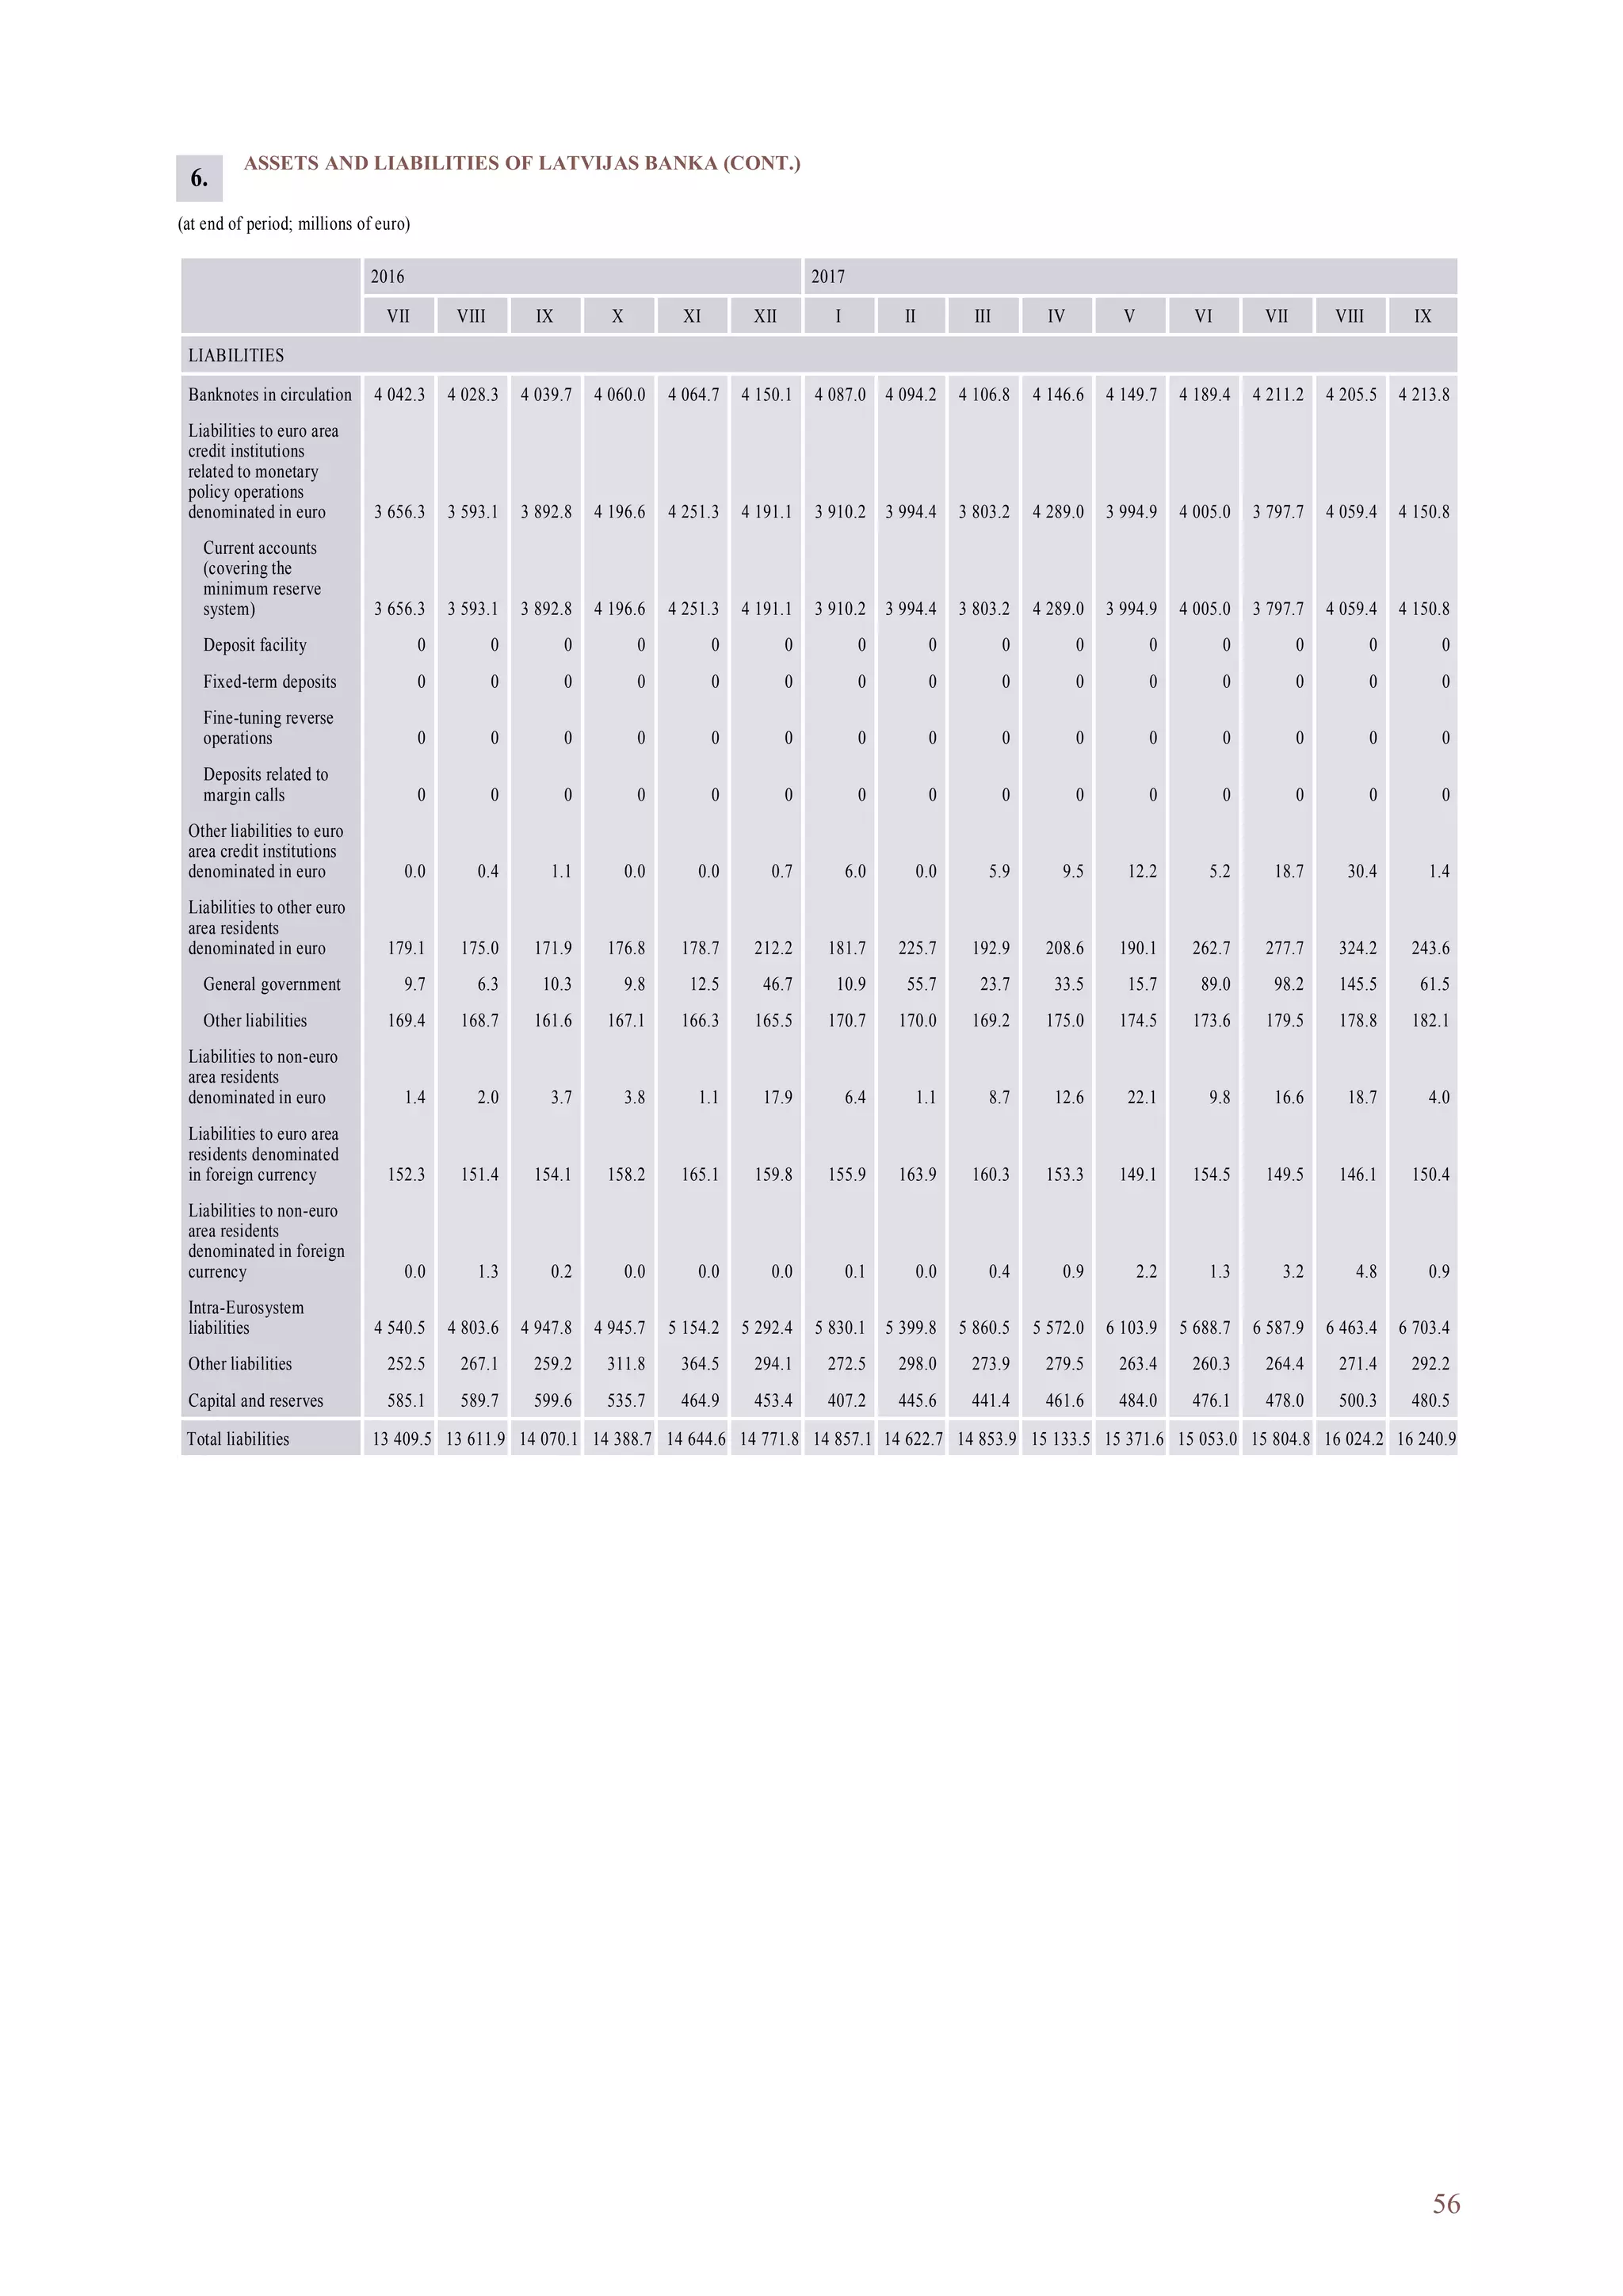
MACROECONOMIC DEVELOPMENTS REPORT
December 2017
8.2 Decline in housing prices in the Nordic countries
1. Motivation
The Latvian economy and financial system are very open. Thus, both regional and global
external shocks have a great potential to mirror in the country's economic and financial
indicators rather rapidly. A potential steep fall in Swedish real estate prices represents one of
the sources of systemic risk. Such a drop can cause macrofinancial tension throughout the
region of the Nordic and Baltic countries due to the close economic and financial ties that
exist between them.
The price dynamics of Swedish real estate in combination with an increase in lending and
private sector debt and the high debt level observed over the past years give rise to concerns
as to sustainability of the situation. Normalisation of historically low risk premiums at
global level could also mirror in erosion of real estate prices in Sweden and other Nordic
countries. Currently several indicators show that the Swedish housing market is witnessing
a slowdown in development. Most market participants and Sveriges Riksbank believe that
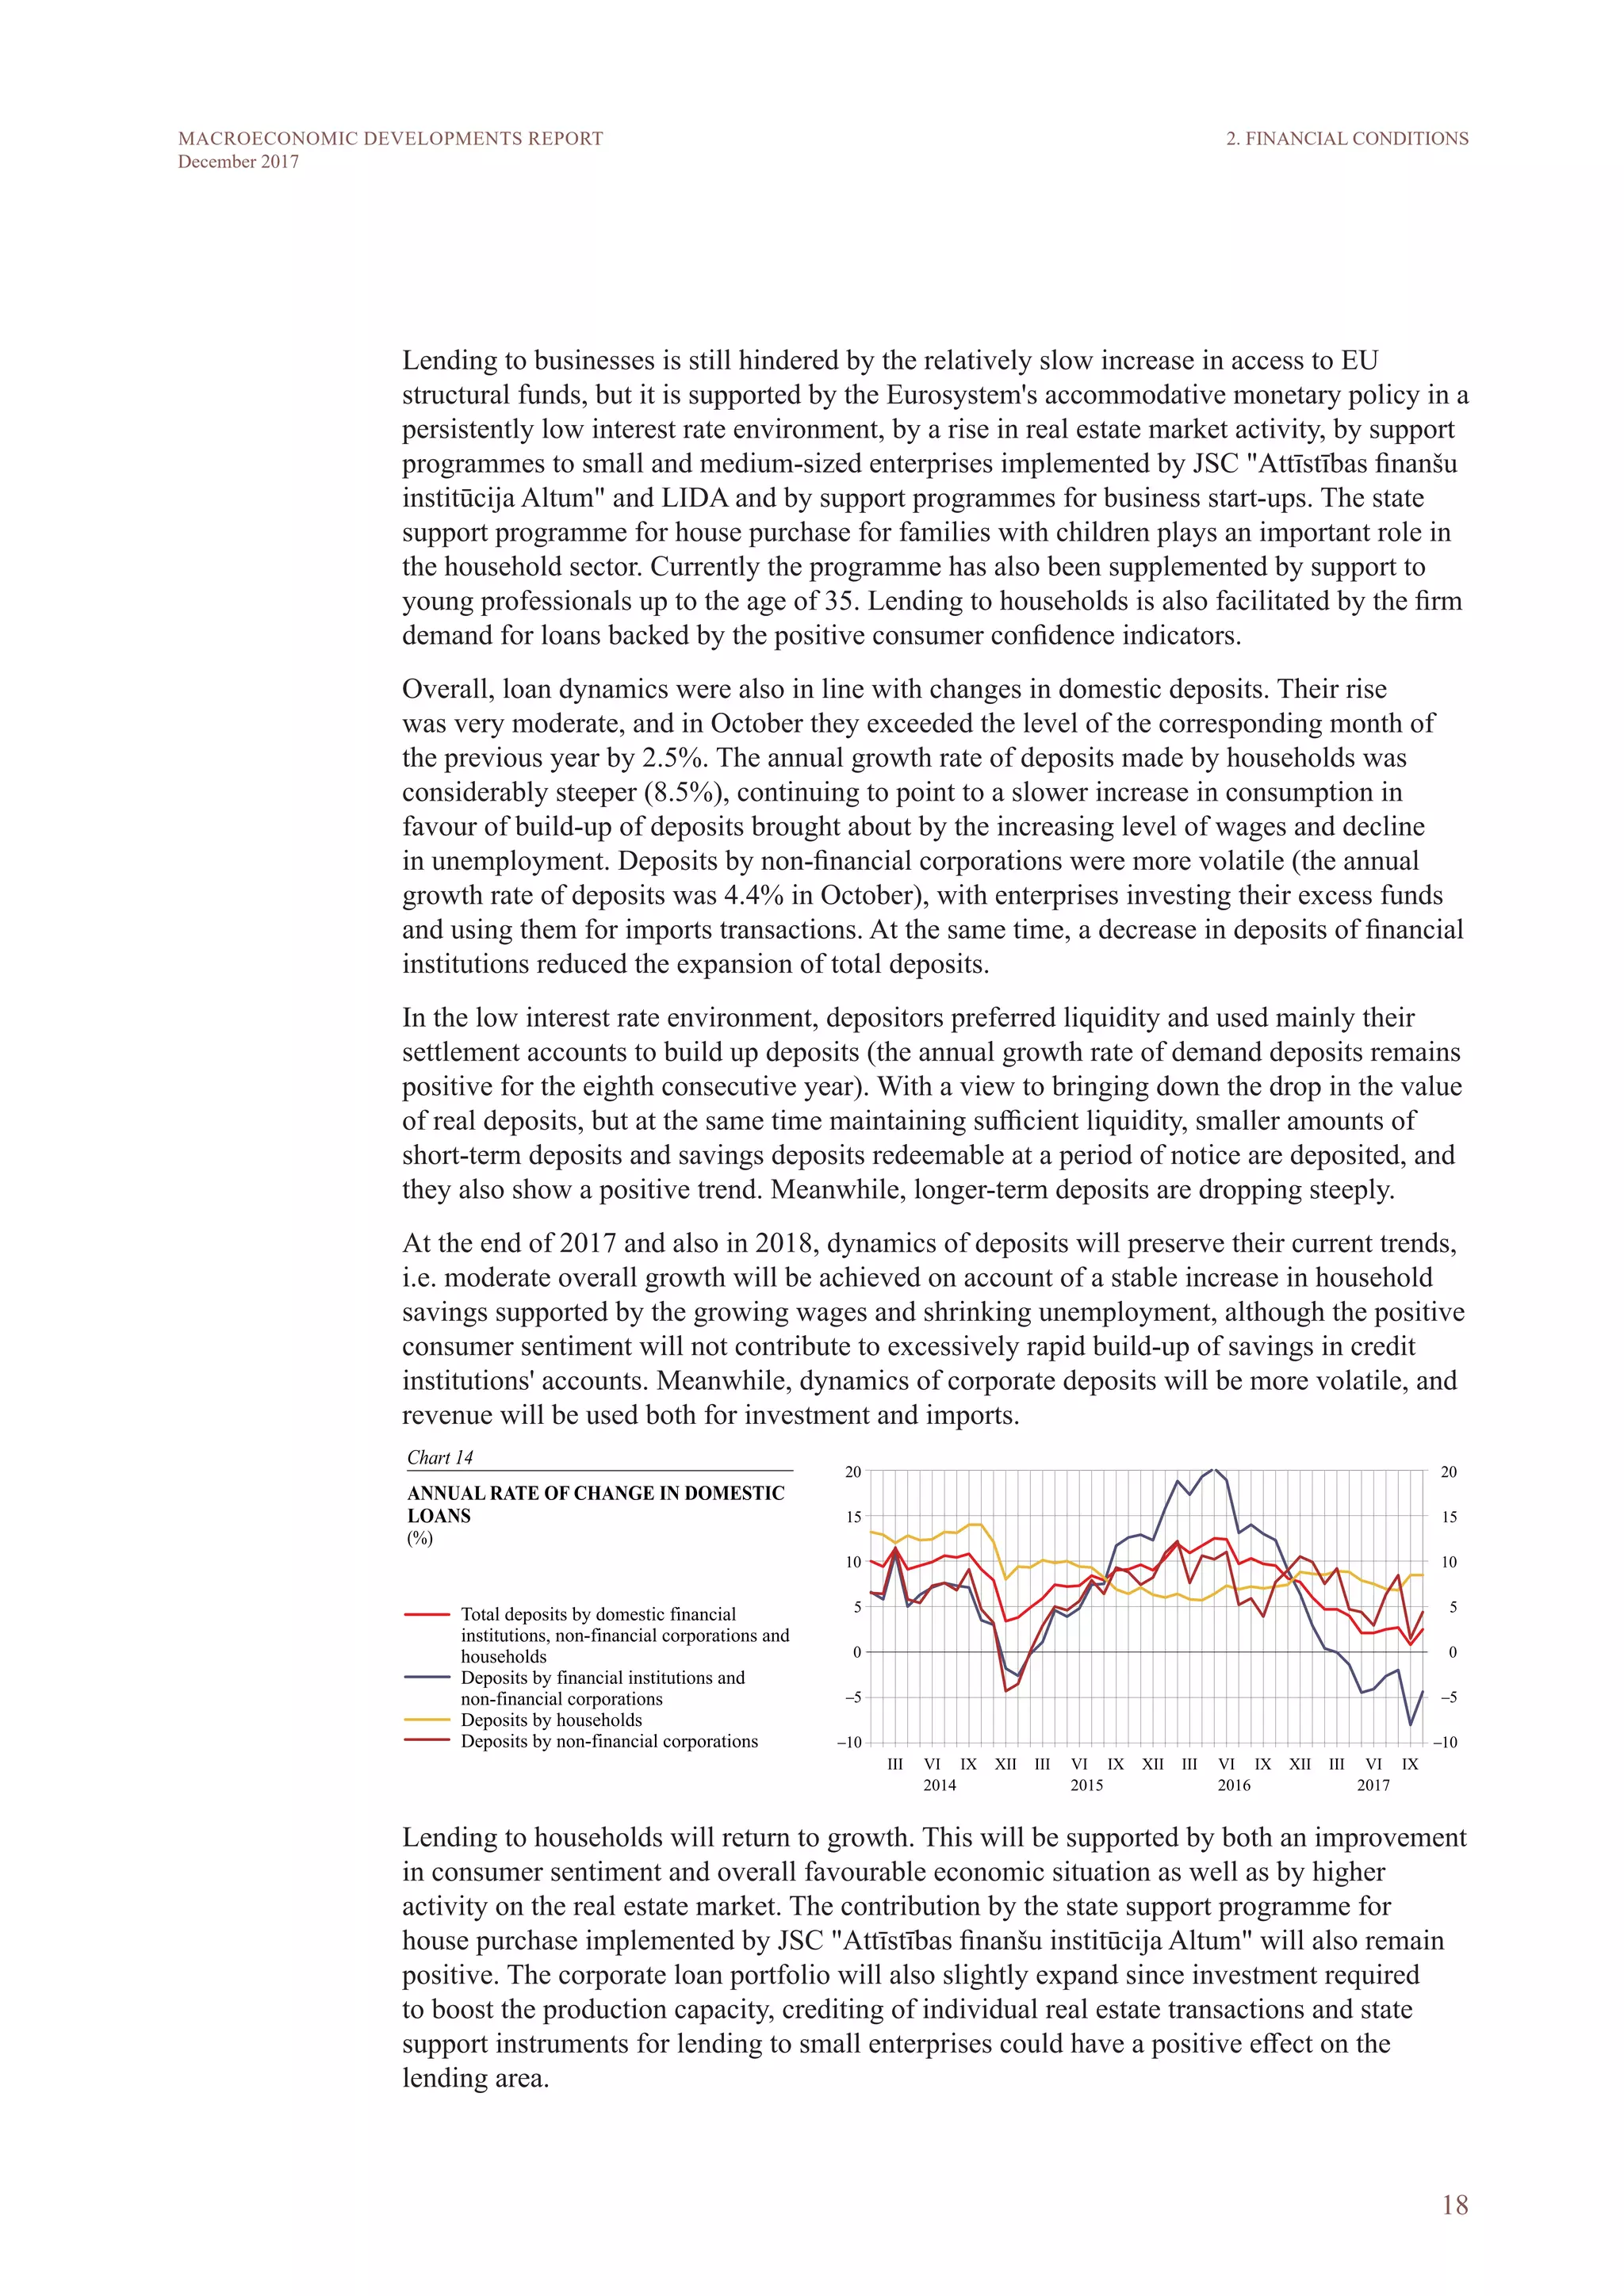
the Nordic countries will see healthy stabilisation of the real estate price level.1
Latvijas
Banka's forecast baseline scenario also contains an assumption of its gradual stabilisation.
Meanwhile, a risk scenario is aimed at modelling a steep decline in real estate prices peculiar
to deep crises and its potential impact on the Latvian economy. The likelihood that such a
scenario might occur is low, and the results obtained cannot be interpreted as forecast risks
of the baseline scenario. However, the results give an idea of the potential adverse effects if
developments were very unfavourable.
A significant drop in real estate prices in the Nordic countries would halt housing market
development, notably affecting consumer sentiment and investment in the economy. A
decline in demand in the Nordic countries would trigger a reduction in exports in their trade
partners (including the Baltic countries).
The halt in real estate market development would significantly deteriorate possibilities and
motivation of enterprises to make investment, using bank loans and their own funds or
capital market resources. Adverse development of the real estate market could worsen loan
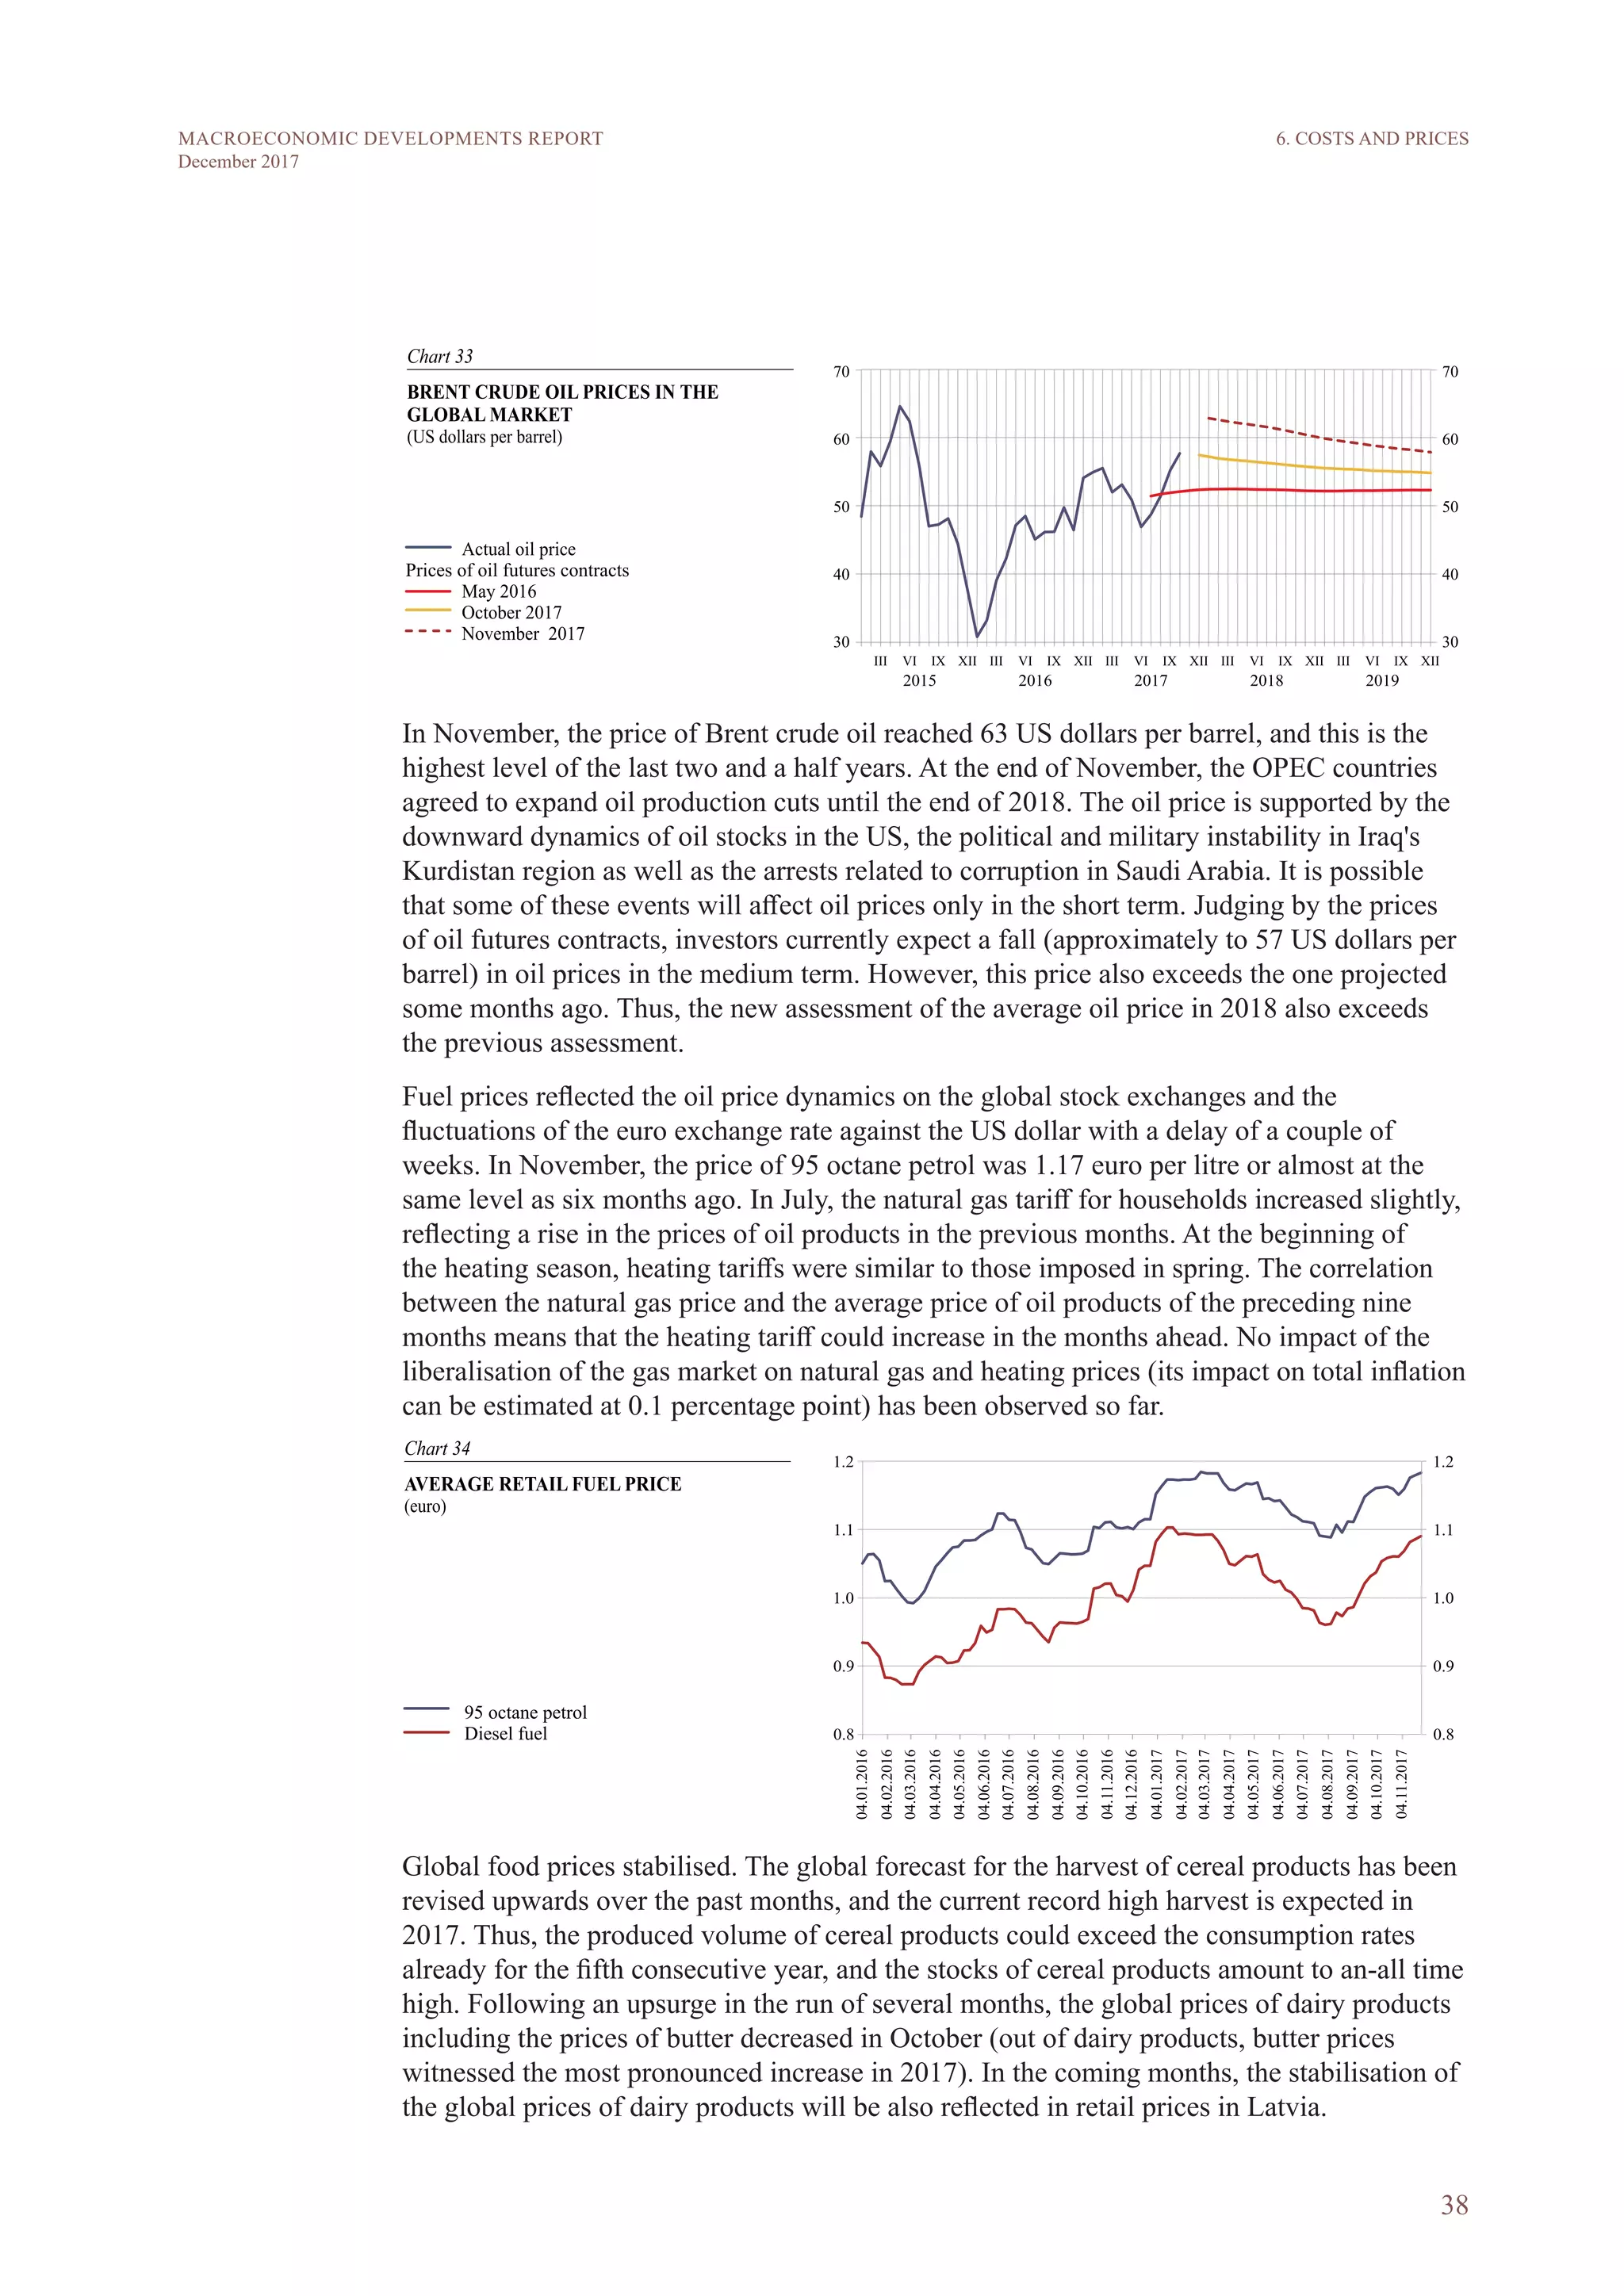
quality in Nordic banks which in turn would increase the risk premium of these banking
groups, making market funding more expensive for them (as they would be considered
riskier). A rise in financing costs of Nordic banking groups could boost interest rates on new
loans both in the Nordic countries and subsidiaries and branches of Nordic banking groups
in the Baltic region (including Latvia). Although dependence of subsidiaries on their parent
bank funding has decreased considerably and the ratio of domestic loans to deposits has
improved over the past years, decisions on the policy of interest rates on loans are largely
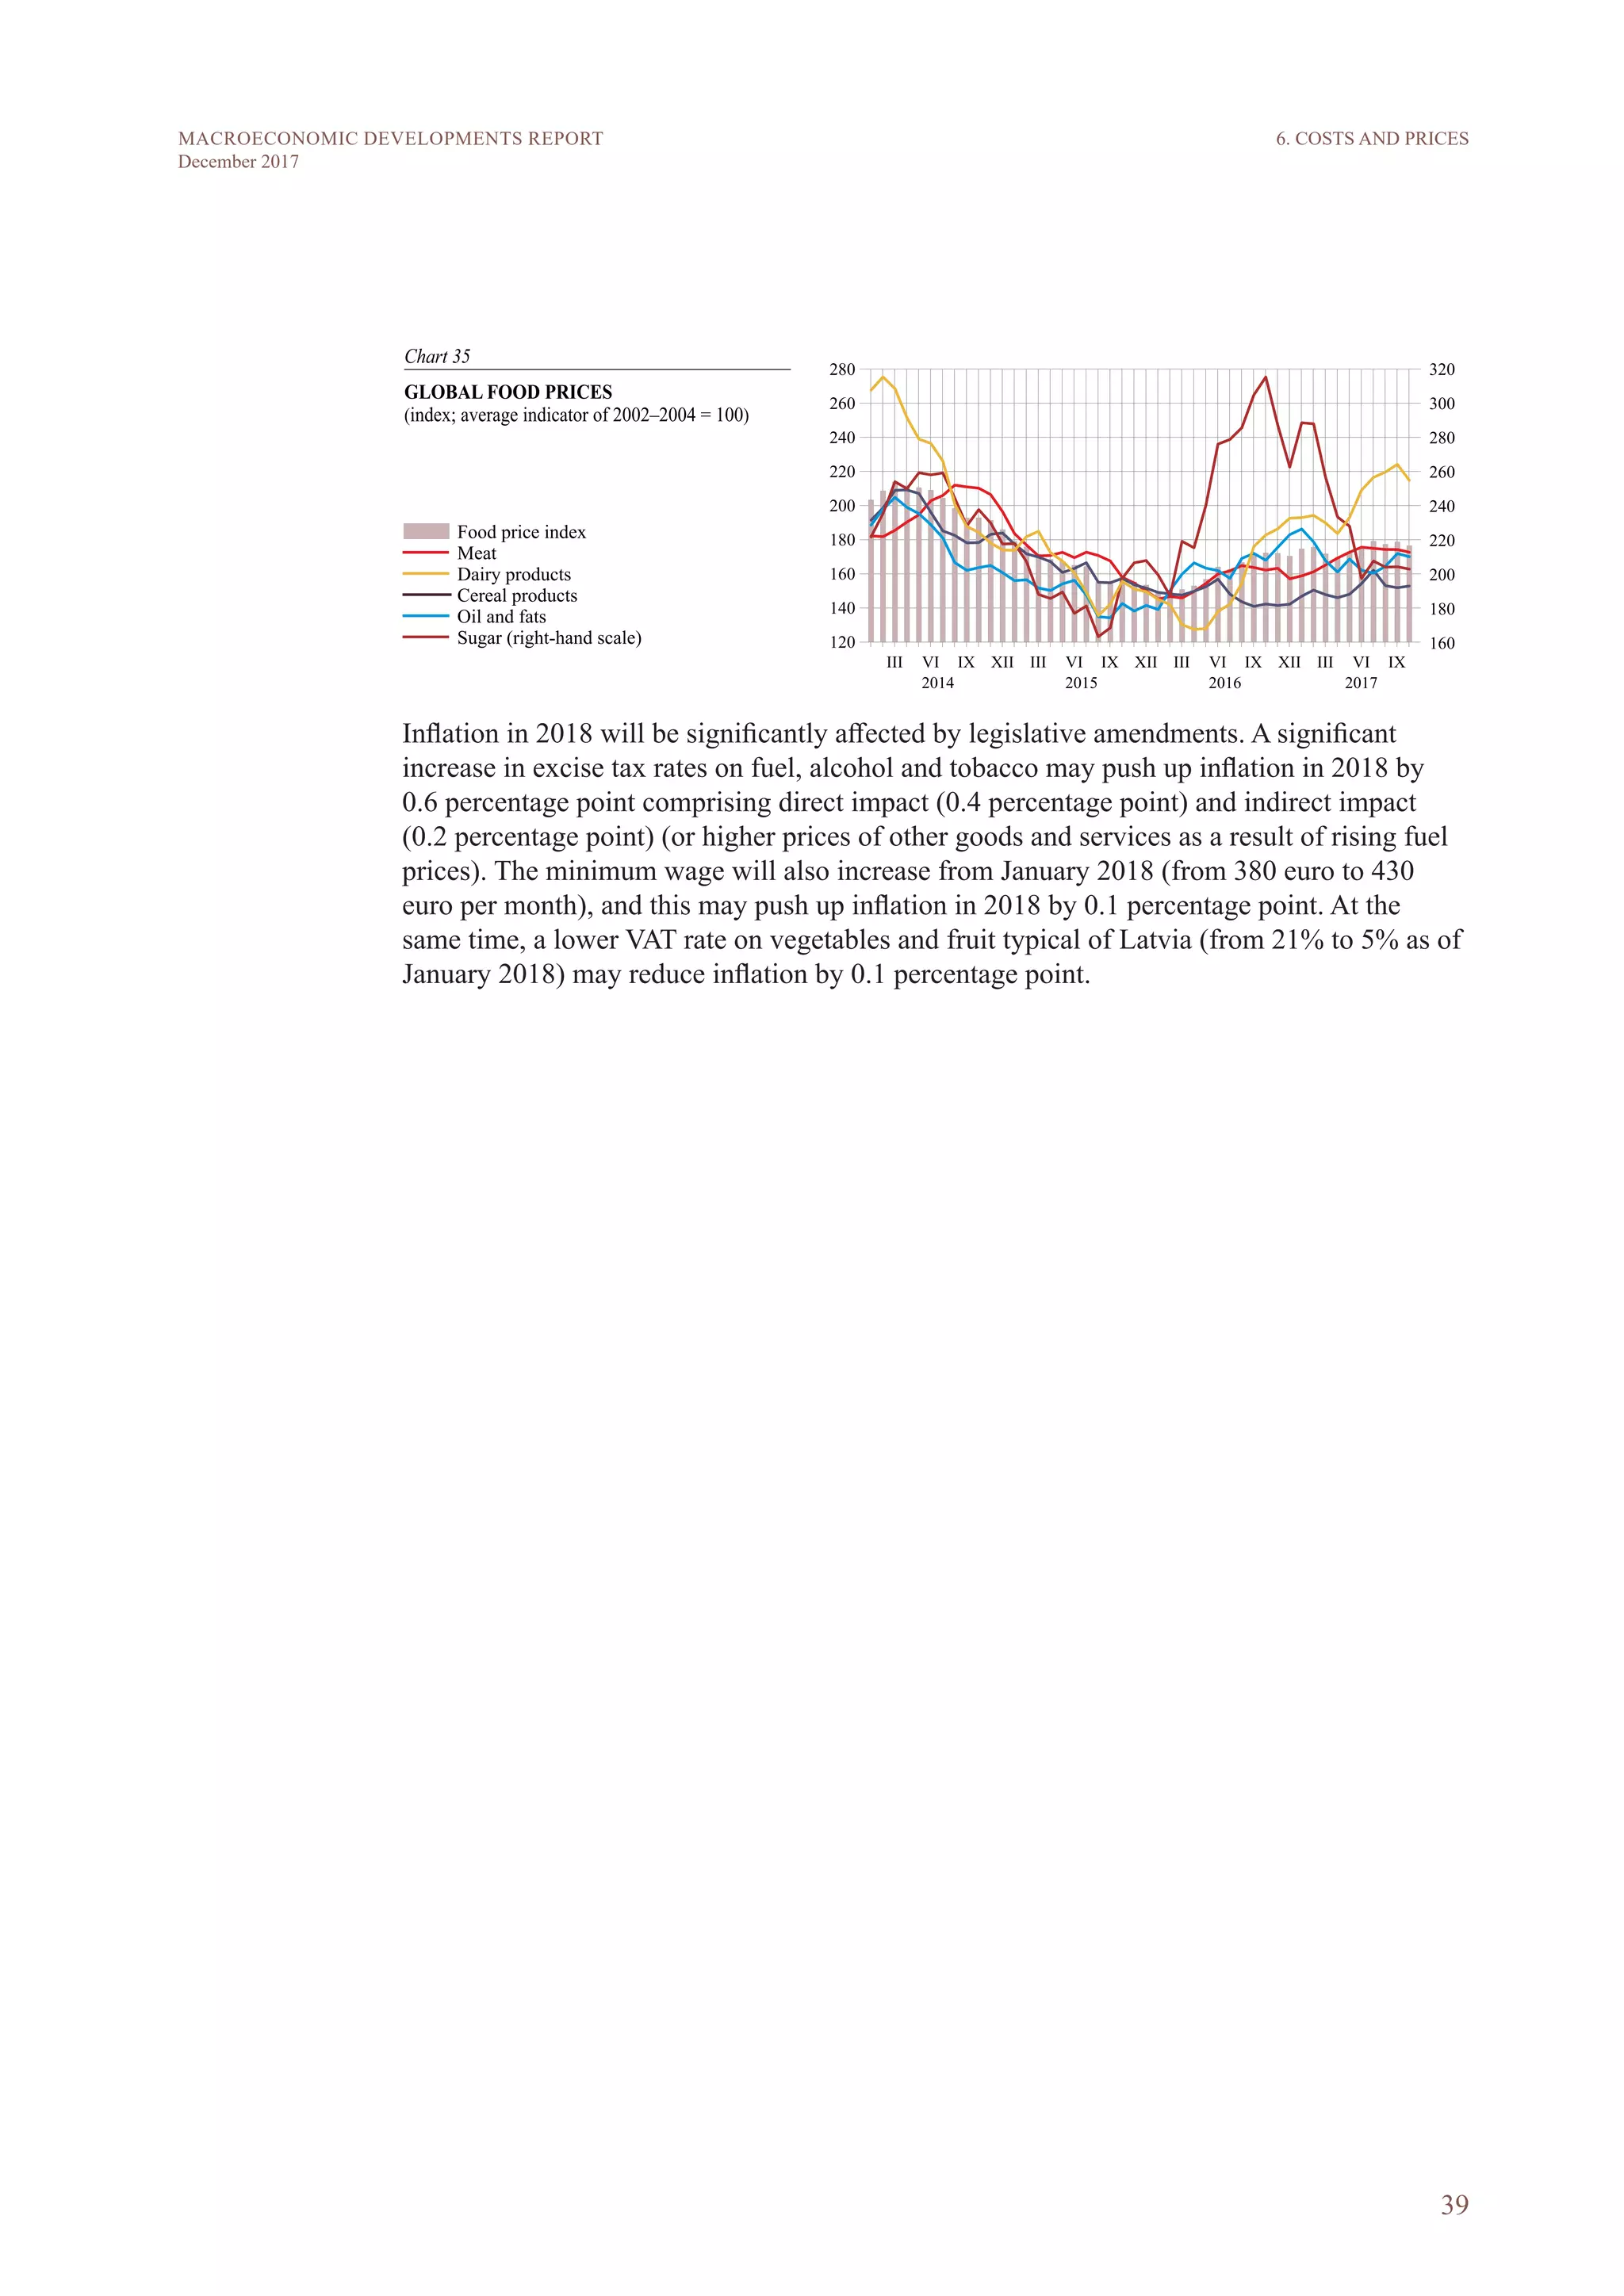
1
Press release by Sveriges Riksbank of 22 November 2017 A slower rate of increase of household indebtedness
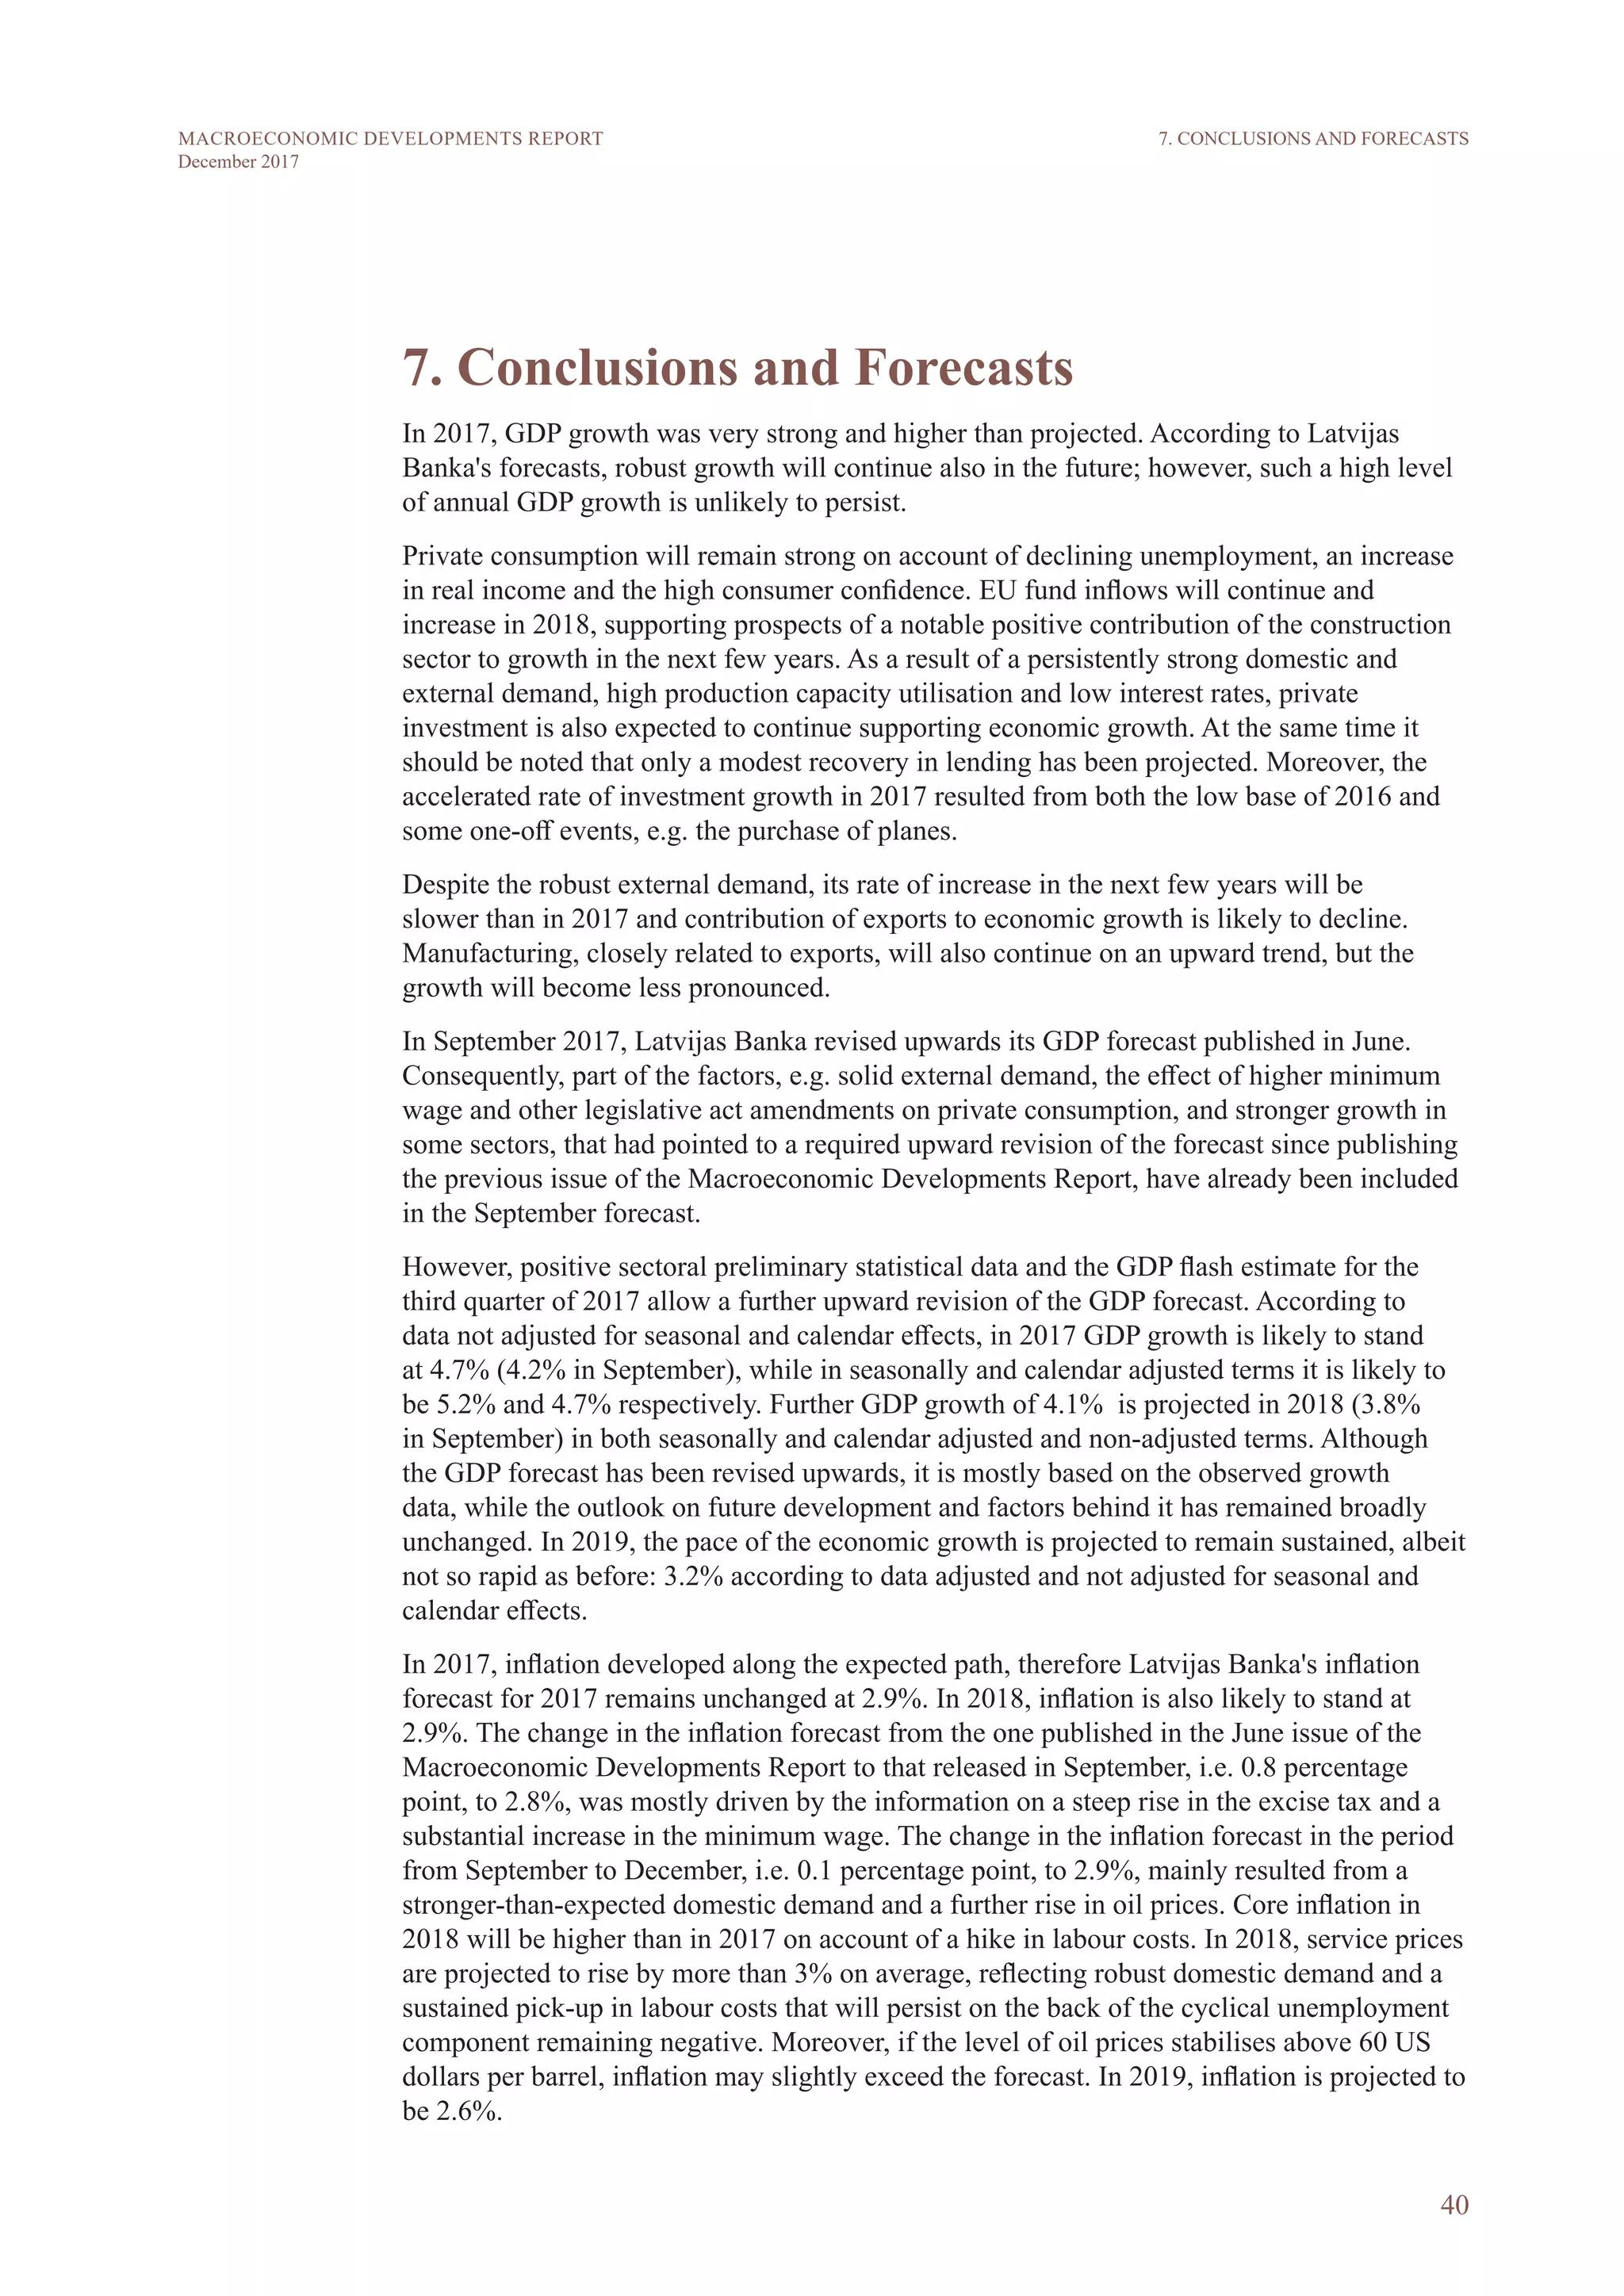
is needed for stability. [viewed on 15 December 2017]. Available: http://www.riksbank.se/Documents/
Pressmeddelanden/2017/prm_171122_eng.pdf. Arnold, Martin, Milne, Richard. Sweden's big banks call an end to
decades-long housing boom. Financial Times. 14 November 2017 [viewed on 15 December 2017]. Available: https://
www.ft.com/content/07c97b9e-c633-11e7-b2bb-322b2cb39656. Bergqvist, Robert, et al. Theme: The resilience of the
Swedish housing market. SEB Nordic Outlook. 21 November 2017, pp. 33–34.
8. ANALYSIS OF SCENARIOS](https://image.slidesharecdn.com/mnp2017decen-180202095957/75/Macroeconomic-Developments-Report-December-2017-45-2048.jpg)


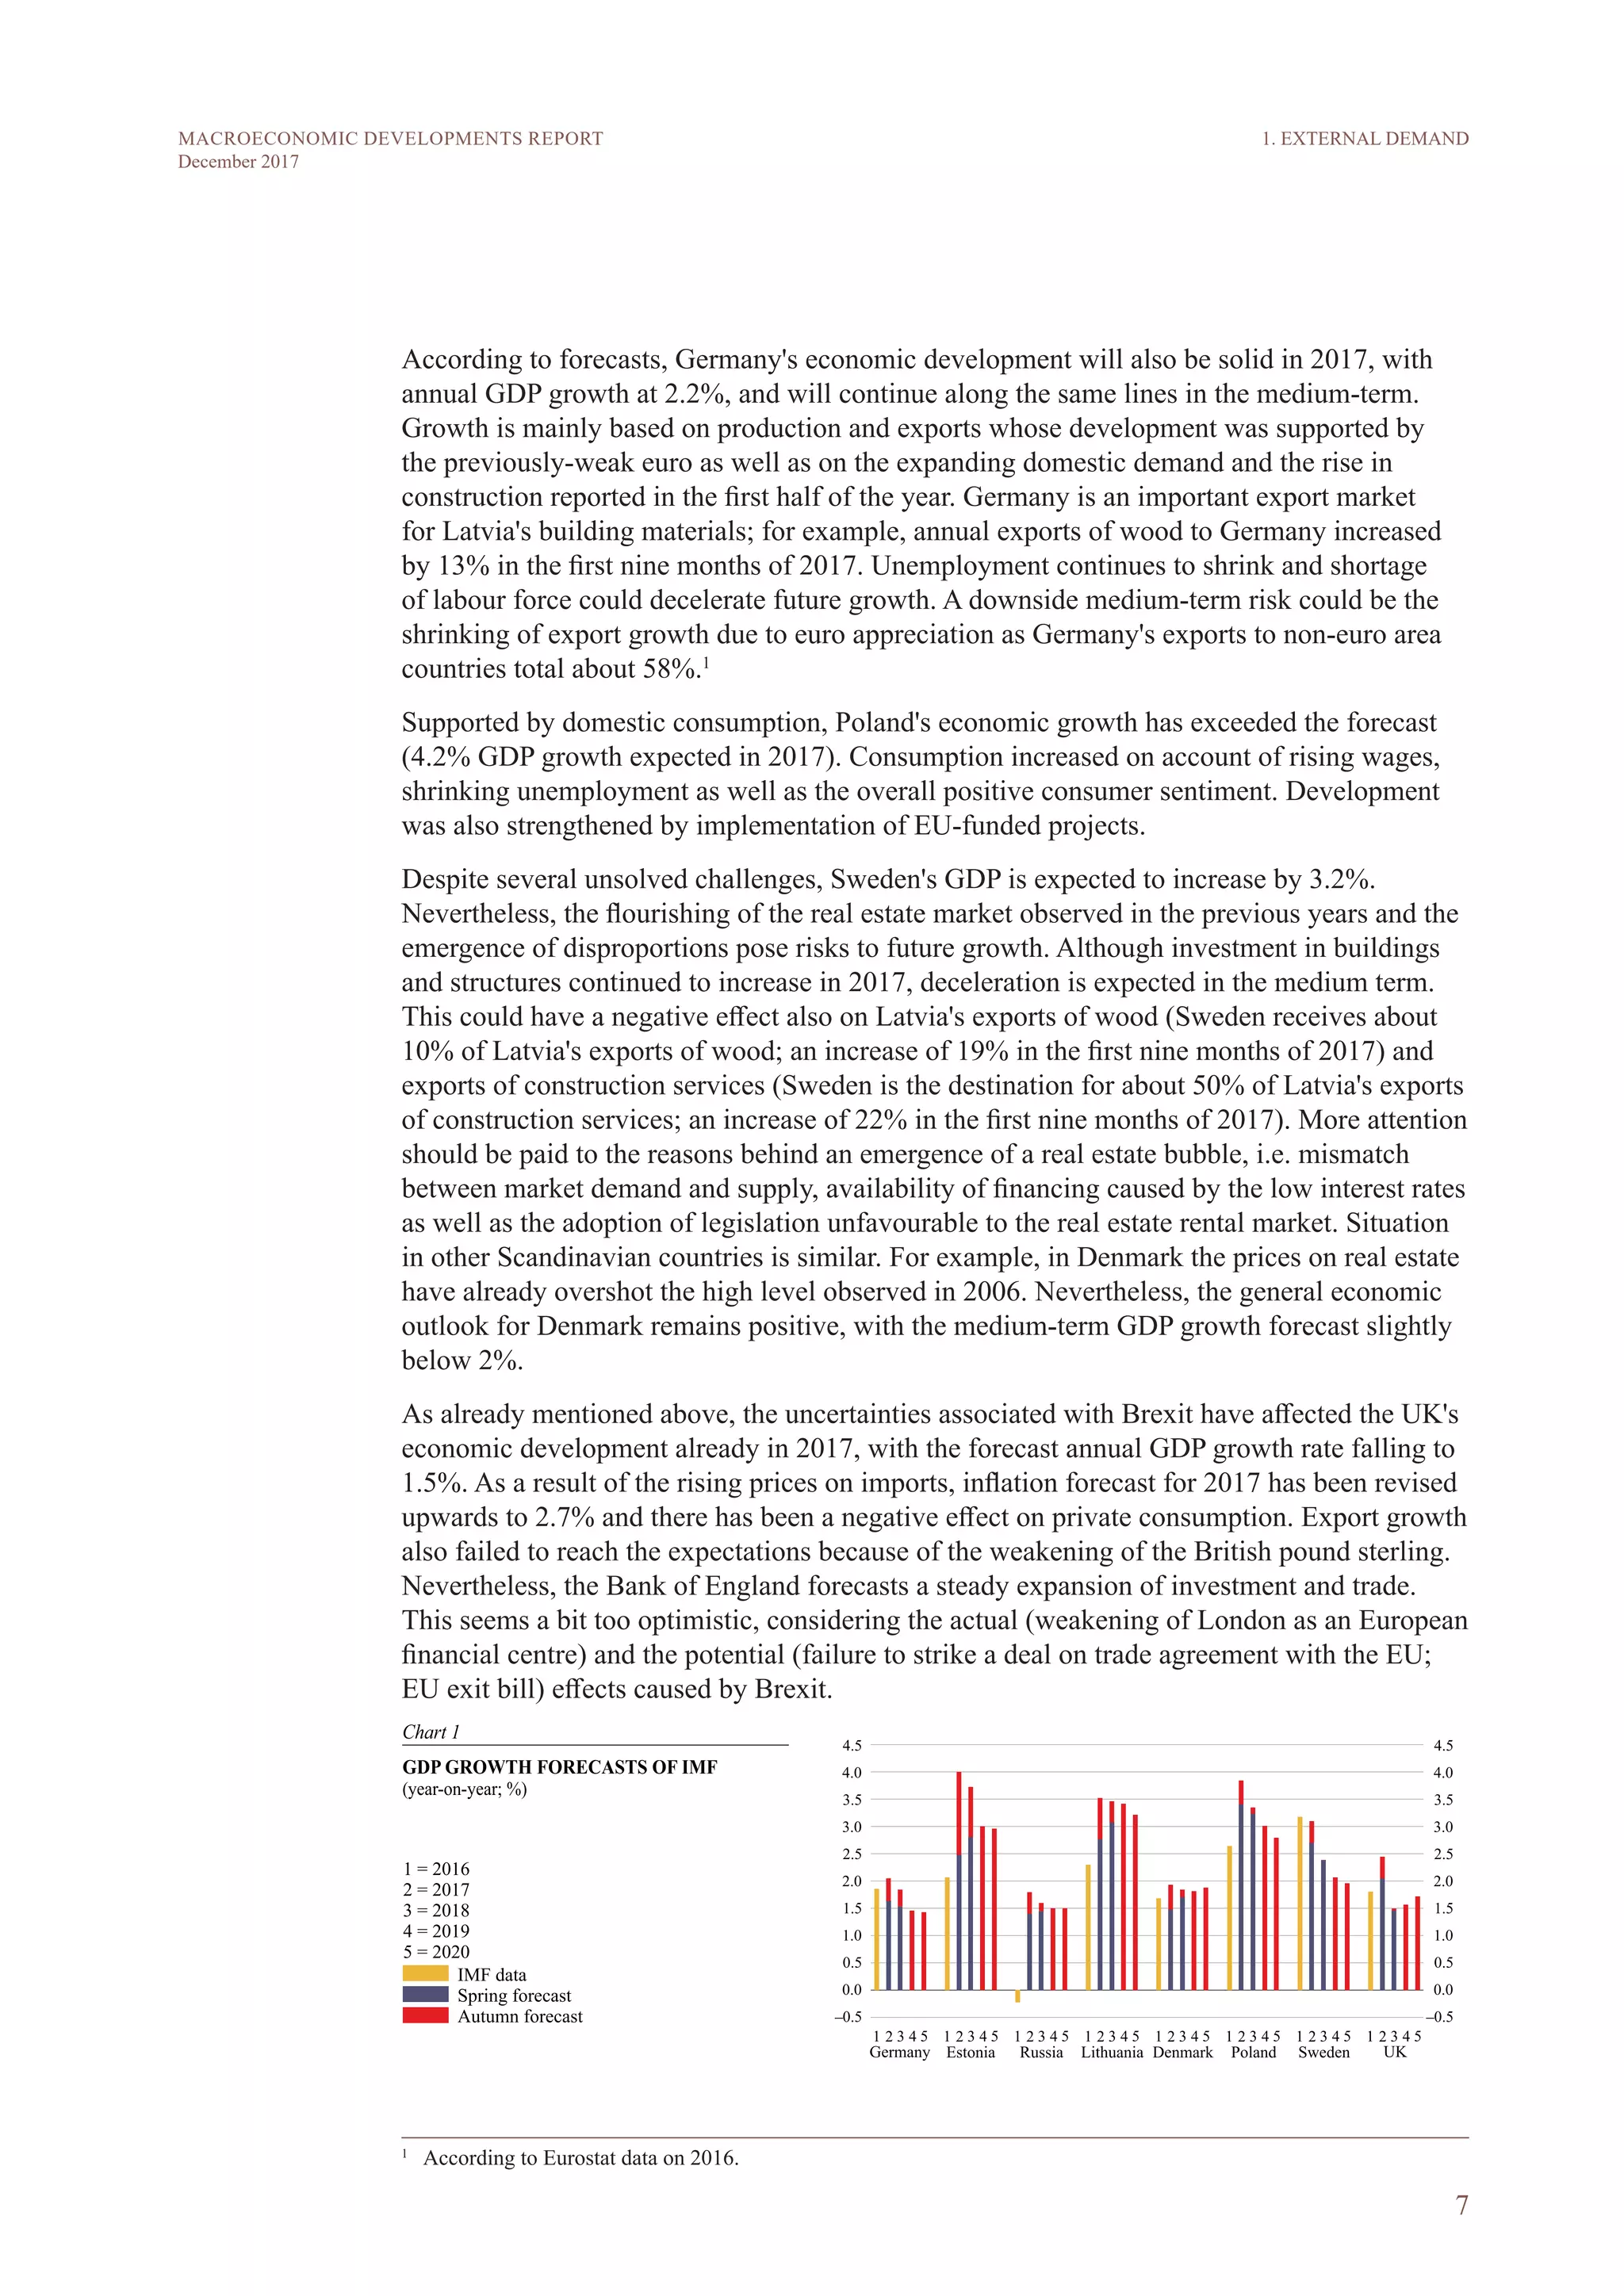
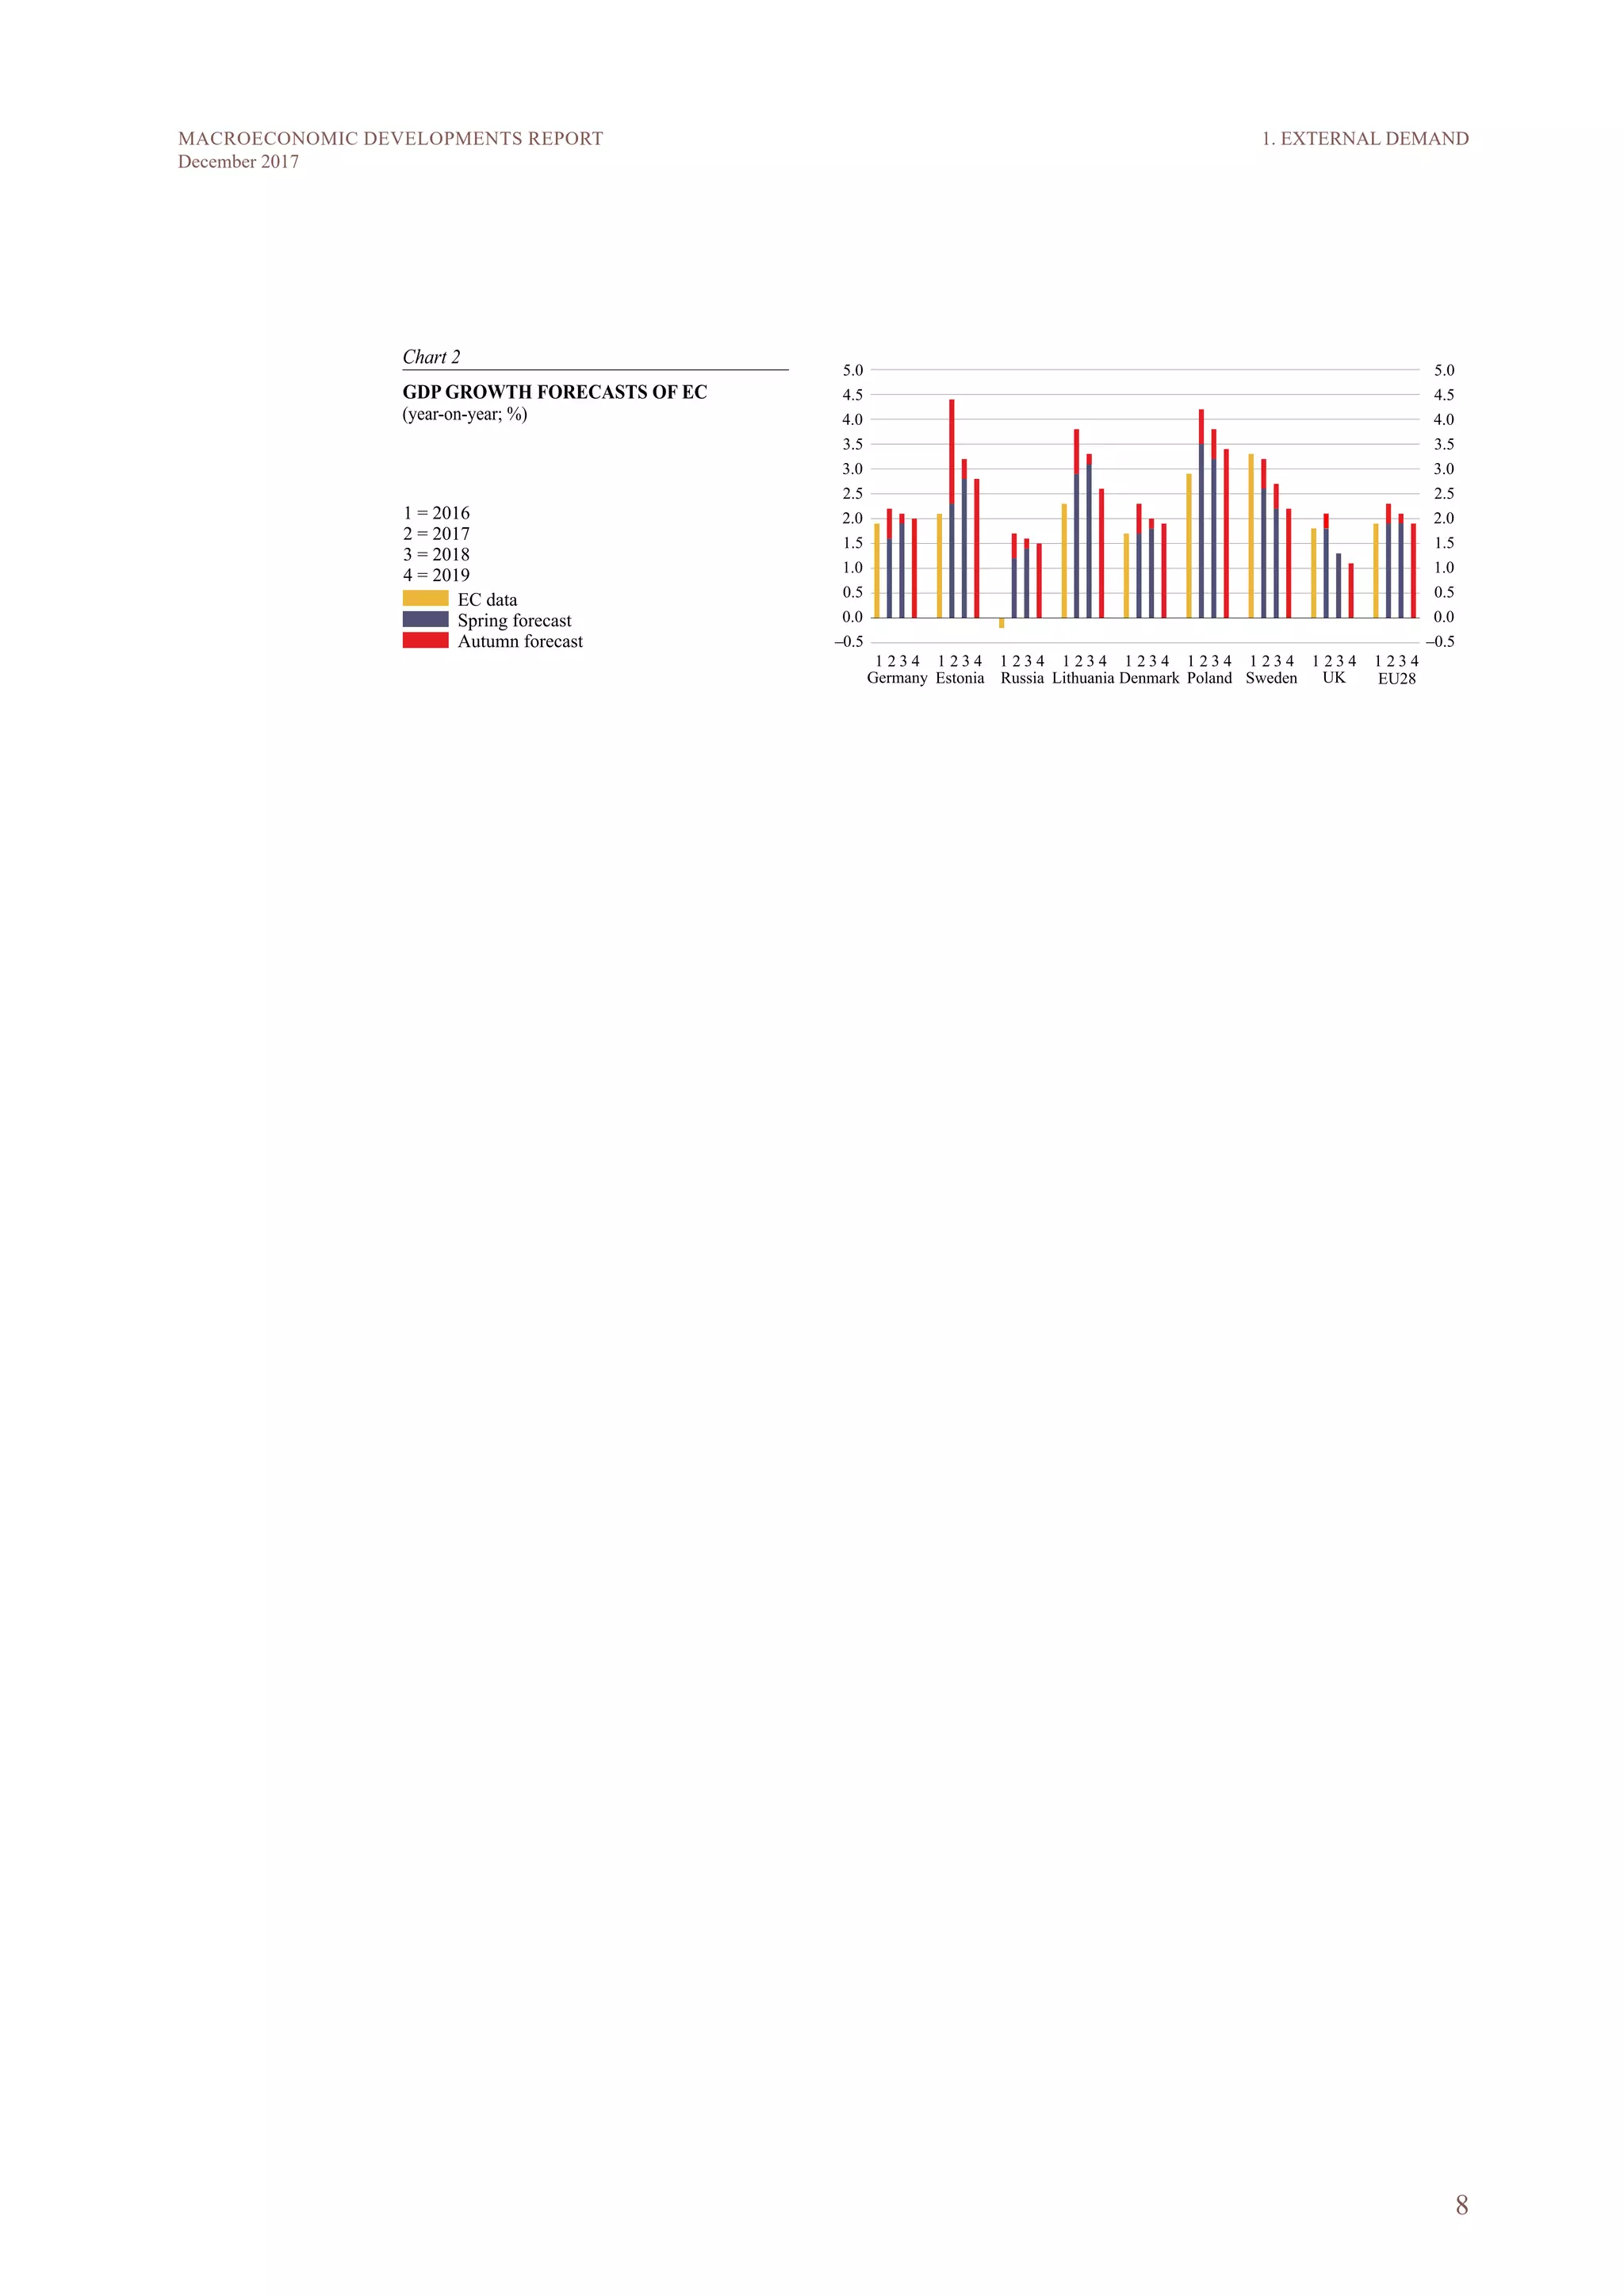
The document provides an overview of macroeconomic developments in December 2017, including: - External demand continued to grow, supported by robust global demand and growth among Latvia's main trade partners, though UK demand weakened due to Brexit uncertainties. - The ECB maintained interest rates and asset purchase programs as inflation remained below target. Financial conditions remained accommodative globally. - Latvia saw strong economic growth in 2017, driven by external demand, private consumption, and recovering investment inflows. Wage growth outpaced productivity, however, weakening competitiveness.


