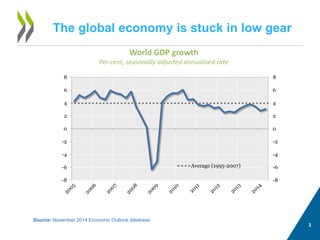
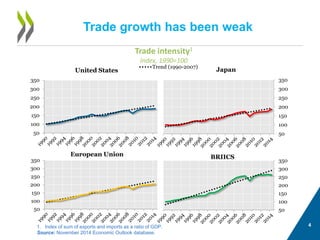
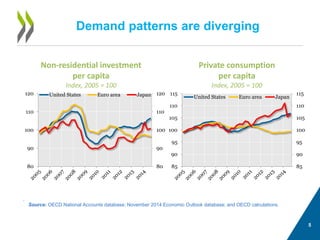
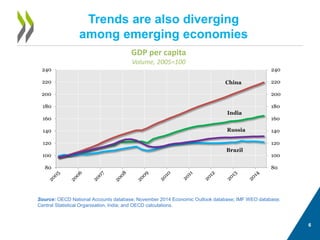
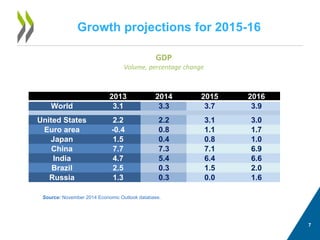
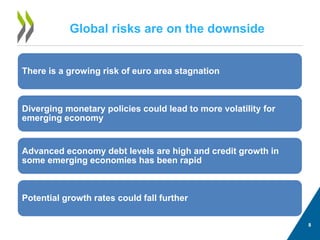
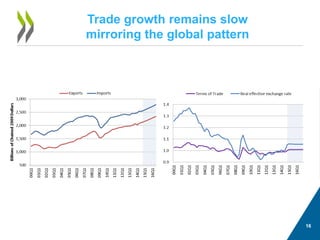
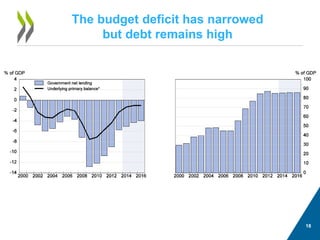
US economy accelerating 
but not yet in top gear 
25th November 2014 Catherine L. Mann 
OECD Chief Economist 
OECD Economic Outlook 
US and Global Briefing
GLOBAL OUTLOOK 
2
The global economy is stuck in low gear 
3 
World GDP growth 
Per cent, seasonally adjusted annualised rate 
Source: November 2014 Economic Outlook database. 
-8 
-6 
-4 
-2 
0 
2 
4 
6 
8 
-8 
-6 
-4 
-2 
0 
2 
4 
6 
8 
Average (1995-2007)
Trade growth has been weak 
4 
Trade intensity1 
Index, 1990=100 
1. 
Index of sum of exports and imports as a ratio of GDP. Source: November 2014 Economic Outlook database. 
50 
100 
150 
200 
250 
300 
350 
United States 
Trend (1990-2007) 
50 
100 
150 
200 
250 
300 
350 
Japan 
50 
100 
150 
200 
250 
300 
350 
European Union 
50 
100 
150 
200 
250 
300 
350 
BRIICS
5 
Demand patterns are diverging 
. 
Non-residential investment per capita Index, 2005 = 100 
Private consumption per capita 
Index, 2005 = 100 
80 
90 
100 
110 
120 
80 
90 
100 
110 
120 
United States 
Euro area 
Japan 
85 
90 
95 
100 
105 
110 
115 
85 
90 
95 
100 
105 
110 
115 
United States 
Euro area 
Japan 
Source: OECD National Accounts database; November 2014 Economic Outlook database; and OECD calculations.
6 
Trends are also diverging 
among emerging economies 
. 
GDP per capita 
Volume, 2005=100 
Source: OECD National Accounts database; November 2014 Economic Outlook database; IMF WEO database; Central Statistical Organisation, India; and OECD calculations. 
80 
100 
120 
140 
160 
180 
200 
220 
240 
80 
100 
120 
140 
160 
180 
200 
220 
240 
China 
India 
Brazil 
Russia
Growth projections for 2015-16 
GDP 
Volume, percentage change 7 
Source: November 2014 Economic Outlook database. 
Column12013201420152016World3.13.33.73.9United States2.22.23.13.0Euro area-0.40.81.11.7Japan1.50.40.81.0China7.77.37.16.9India4.75.46.46.6Brazil2.50.31.52.0Russia1.30.30.01.6
Global risks are on the downside 
There is a growing risk of euro area stagnation 
Diverging monetary policies could lead to more volatility for emerging economy 
Advanced economy debt levels are high and credit growth in some emerging economies has been rapid 
Potential growth rates could fall further 
8
Monetary, fiscal and structural policies need to support growth 
Monetary, fiscal and structural policies are complementary tools 
Monetary policy needs to remain accommodative in most countries, and more aggressive QE is needed in the euro area 
Progress on fiscal consolidation has left room in many economies -- including in the euro area -- to ease the drag of fiscal policy on demand 
Ambitious structural reforms are needed to boost investment, trade and job creation 
9
US OUTLOOK 
10
11 
Output is expected to accelerate relative to its trend over the past few quarters 
GDP Volume, 2009=100 
Real GDP growth 
Per cent, annual rate
12 
Consumption accelerates modestly but all pistons are not firing
13 
Household wealth has rebounded and deleveraging has largely run its course
14 
Business investment looks mediocre
15 
Residential investment accelerates but remains well below cruising speed
16 
Trade growth remains slow mirroring the global pattern
17 
The drag from fiscal consolidation is waning 
Government spending 
Contribution to GDP growth 
4 quarter moving average 
Government fixed assets 
Annual growth rate 
real net fixed assets (excluding defense)
18 
The budget deficit has narrowed but debt remains high
19 
Declines in unemployment running ahead of the recovery
20 
Signs that labour market slack remains elevated
21 
Labour market tightening should put upward pressure on wages and demand
22 
Inflation rises but not achieve target
Risks 
Acceleration of aggregate demand may not materialise 
Normalisation of monetary policy could create financial market tensions 
Upside and downside risks from the process of monetary policy normalisation 
Household consumption and business investment may pick up more quickly than expected 
23
Monetary and fiscal policy 
Fiscal policy should focus on addressing longer-term pressures associated with healthcare spending and old age pensions 
Assuming the recovery remains on track, policy rates should be gradually raised as labour-market slack is eliminated and wage growth becomes more apparent 
Monetary policy rates should remain at their current low level through mid-2015 
The authorities should facilitate infrastructure spending 
24
25 
More information… 
data visualization tool 
OECD Economic Outlook, November 2014 
• 
Website with additional information 
• 
Read this publication online 
• 
Compare your country with OECD data 
www.oecd.org/eco/economicoutlook.htm 
OECD 
OECD Economics 
Disclaimers: 
The statistical data for Israel are supplied by and under the responsibility of the relevant Israeli authorities. The use of such data by the OECD is without prejudice to the status of the Golan Heights, East Jerusalem and Israeli settlements in the West Bank under the terms of international law. 
This document and any map included herein are without prejudice to the status of or sovereignty over any territory, to the delimitation of international frontiers and boundaries and to the name of any territory, city or area.

US-economy-accelerating-but-not-yet-in-top-gear

  • 1.
    US economy accelerating but not yet in top gear 25th November 2014 Catherine L. Mann OECD Chief Economist OECD Economic Outlook US and Global Briefing
  • 2.
  • 3.
    The global economyis stuck in low gear 3 World GDP growth Per cent, seasonally adjusted annualised rate Source: November 2014 Economic Outlook database. -8 -6 -4 -2 0 2 4 6 8 -8 -6 -4 -2 0 2 4 6 8 Average (1995-2007)
  • 4.
    Trade growth hasbeen weak 4 Trade intensity1 Index, 1990=100 1. Index of sum of exports and imports as a ratio of GDP. Source: November 2014 Economic Outlook database. 50 100 150 200 250 300 350 United States Trend (1990-2007) 50 100 150 200 250 300 350 Japan 50 100 150 200 250 300 350 European Union 50 100 150 200 250 300 350 BRIICS
  • 5.
    5 Demand patternsare diverging . Non-residential investment per capita Index, 2005 = 100 Private consumption per capita Index, 2005 = 100 80 90 100 110 120 80 90 100 110 120 United States Euro area Japan 85 90 95 100 105 110 115 85 90 95 100 105 110 115 United States Euro area Japan Source: OECD National Accounts database; November 2014 Economic Outlook database; and OECD calculations.
  • 6.
    6 Trends arealso diverging among emerging economies . GDP per capita Volume, 2005=100 Source: OECD National Accounts database; November 2014 Economic Outlook database; IMF WEO database; Central Statistical Organisation, India; and OECD calculations. 80 100 120 140 160 180 200 220 240 80 100 120 140 160 180 200 220 240 China India Brazil Russia
  • 7.
    Growth projections for2015-16 GDP Volume, percentage change 7 Source: November 2014 Economic Outlook database. Column12013201420152016World3.13.33.73.9United States2.22.23.13.0Euro area-0.40.81.11.7Japan1.50.40.81.0China7.77.37.16.9India4.75.46.46.6Brazil2.50.31.52.0Russia1.30.30.01.6
  • 8.
    Global risks areon the downside There is a growing risk of euro area stagnation Diverging monetary policies could lead to more volatility for emerging economy Advanced economy debt levels are high and credit growth in some emerging economies has been rapid Potential growth rates could fall further 8
  • 9.
    Monetary, fiscal andstructural policies need to support growth Monetary, fiscal and structural policies are complementary tools Monetary policy needs to remain accommodative in most countries, and more aggressive QE is needed in the euro area Progress on fiscal consolidation has left room in many economies -- including in the euro area -- to ease the drag of fiscal policy on demand Ambitious structural reforms are needed to boost investment, trade and job creation 9
  • 10.
  • 11.
    11 Output isexpected to accelerate relative to its trend over the past few quarters GDP Volume, 2009=100 Real GDP growth Per cent, annual rate
  • 12.
    12 Consumption acceleratesmodestly but all pistons are not firing
  • 13.
    13 Household wealthhas rebounded and deleveraging has largely run its course
  • 14.
    14 Business investmentlooks mediocre
  • 15.
    15 Residential investmentaccelerates but remains well below cruising speed
  • 16.
    16 Trade growthremains slow mirroring the global pattern
  • 17.
    17 The dragfrom fiscal consolidation is waning Government spending Contribution to GDP growth 4 quarter moving average Government fixed assets Annual growth rate real net fixed assets (excluding defense)
  • 18.
    18 The budgetdeficit has narrowed but debt remains high
  • 19.
    19 Declines inunemployment running ahead of the recovery
  • 20.
    20 Signs thatlabour market slack remains elevated
  • 21.
    21 Labour markettightening should put upward pressure on wages and demand
  • 22.
    22 Inflation risesbut not achieve target
  • 23.
    Risks Acceleration ofaggregate demand may not materialise Normalisation of monetary policy could create financial market tensions Upside and downside risks from the process of monetary policy normalisation Household consumption and business investment may pick up more quickly than expected 23
  • 24.
    Monetary and fiscalpolicy Fiscal policy should focus on addressing longer-term pressures associated with healthcare spending and old age pensions Assuming the recovery remains on track, policy rates should be gradually raised as labour-market slack is eliminated and wage growth becomes more apparent Monetary policy rates should remain at their current low level through mid-2015 The authorities should facilitate infrastructure spending 24
  • 25.
    25 More information… data visualization tool OECD Economic Outlook, November 2014 • Website with additional information • Read this publication online • Compare your country with OECD data www.oecd.org/eco/economicoutlook.htm OECD OECD Economics Disclaimers: The statistical data for Israel are supplied by and under the responsibility of the relevant Israeli authorities. The use of such data by the OECD is without prejudice to the status of the Golan Heights, East Jerusalem and Israeli settlements in the West Bank under the terms of international law. This document and any map included herein are without prejudice to the status of or sovereignty over any territory, to the delimitation of international frontiers and boundaries and to the name of any territory, city or area.