Download to read offline
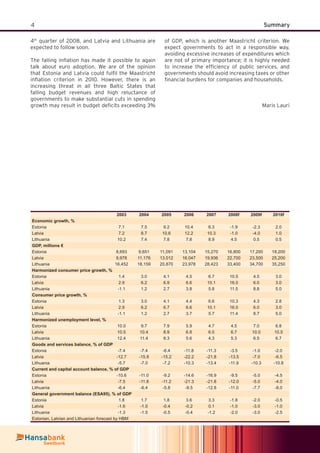


The document outlines a pessimistic macroeconomic outlook for the Baltic region in light of a global recession, with Estonia, Latvia, and Lithuania all facing negative GDP growth in 2008 and challenging conditions ahead. Despite slight recovery prospects for 2010, significant risks persist due to weak domestic demand, rising unemployment, and difficulties in accessing foreign financing. The Baltic economies will likely rely more on domestic resources while contending with the burdens of high energy costs and the ramifications of global economic turmoil.


