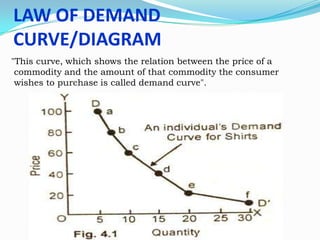
PRESENTATION ON DEMAND
ANALYSIS
GROUP MEMBERS:
ANKUR GUPTA (69)
PRIYANK SOOD
LINU KOSHI
SAVITA RAWAT
DEEPANSHU AMBERIA(101)
MEANING AND DEFINITION OF
DEMAND
 Demand in economics means a desire to possess a good

supported by willingness and ability to pay for it.

 If you have a desire to buy a certain commodity, say a

car, but you do not have the adequate means to pay for
it, it will simply be a wish, a desire or a want and not
demand. Demand is an effective desire, i.e., a desire
which is backed by willingness and ability to pay for a
commodity in order to obtain it.

 In the words of Prof. Hibdon:

"Demand means the various quantities of goods that
would be purchased per time period at different prices
in a given market".
CHARACTERISTICS OF DEMAND
There are thus three main characteristic's of demand in
economics.
(i) Willingness and ability to pay- Demand is the amount of a
commodity for which a consumer has the willingness and also the
ability to buy.
(ii) Demand is always at a price-If we talk of demand without
reference to price, it will be meaningless. The consumer must know
both the price and the commodity. He will then be able to tell the
quantity demanded by him.
(iii) Demand is always per unit of time-The time may be a day, a
week, a month, or a year.
Example:
For instance, when the milk is selling at the rate of $15.0 per liter,
the demand of a buyer for milk is 10 liters a day. If we do not
mention the period of time, nobody can guess as to how much milk
we consume? It is just possible we may be consuming ten liters of
milk a week, a month or a year.
TYPES OF DEMAND
The major classifications of demand are as
follows:
1. Individual and market demand
2. Demand for firm's product and industry's
products
3. Autonomous and derived demand
4. Demand for durable and non-durable
goods
5. Short-term and long-term demand
1. INDIVIDUAL AND MARKET
DEMAND FOR A COMMODITY
 "The individuals demand for a

commodity is the amount of a
commodity which the consumer is
willing to purchase at any given price
over a specified period of time".
 Price (p) is here an independent
variable and quantity (q) is dependent
variable.
CONTD.
Individual's Demand Schedule:
The demand schedule of an individual for a commodity is a
list or table of the different amounts of the commodity that are
purchased from the market at different prices per unit of
time. An individual demand schedule for a good say shirts is
presented in the table below:
Individual Demand Schedule for Shirts:
Price Per Shirt ($)
Quantity Demanded
Per Year Q dx

100

5

80

60

40

20

10

7

10

15

20

30

According to this demand schedule, an individual buys 5
shirts at $100 per shirt and 30 shirts at $10 per shirt in a
year.
INDIVIDUAL DEMAND CURVE
Demand curve is a graphical representation of the demand
schedule.
According to Lipsey:

"The curve, which shows the relation between the price of a
commodity and the amount of that commodity the
consumer wishes to purchase is called demand curve".
CONTD..
MARKET DEMAND OF A
COMMODITY
The market demand for a commodity is obtained by
adding up the total quantity demanded at various
prices by all the individual over a specified period of
time in the market. It is described as the horizontal
summation of the individuals demand for a
commodity at various possible prices in market.
MARKET DEMAND SCHEDULE
The horizontal summation of individuals demand
for a commodity will be the market demand for a
commodity.
In a market, there are a number of buyers for a
commodity at each price. In order to avoid a lengthy
addition process, we assume here that there are
only four buyers for a commodity who purchase
different amounts of the commodity at each price.
A market Demand Schedule in a Four
Consumer Market:
Price ($)

10
8
6
4
2

Quantity Quantity Quantity Quantity
Total
Demande Demande Demanded Demande Quantity
d
d
d
Demande
First
Second
Third
Fourth
d Per
Buyer
Buyer
Buyer
Buyer
Week (in
thousand
s)
10
15
25
40
60

13
20
30
35
50

6
9
10
15
30

11
16
20
30
40

40
60
85
120
180
MARKET DEMAND CURVE
 Market demand curve for a Commodity is the

horizontal sum of individual demand curves of all the
buyers in a market. This is illustrated with the help of
the market demand schedule given above.
DEMAND FOR FIRM’S
PRODUCT AND INDUSTRY’S
PRODUCT
2.

The quantity of a firm's yield, that can be disposed of at
a given price over a period refers to the demand for
firm's product. The aggregate demand for the product
of all firms of an industry is known as the marketdemand or demand for industry's product.
3. AUTONOMOUS DEMAND AND
DERIVED DEMAND
An Autonomous demand for a product is one that
arises independently of the demand for any other good
whereas a derived demand is one, which is derived
from demand of some other good.
4. DEMAND FOR DURABLE AND
NON-DURABLE GOODS
Durable goods are those goods whose total utility is not
exhausted in single or short-run use. Such goods can be
used continuously over a period of time. Durable goods
may be consumer goods as well as producer goods.
Durable consumer goods include clothes, shoes, house
furniture, refrigerators, scooters, and cars.
On the other hand, non-durable goods are those goods,
which can be used only once such as food items and their
total utility is exhausted in a single use. This category of
goods can also be grouped under non-durable consumer
and producer goods. All food items such as drinks, soap,
cooking fuel, gas, kerosene, coal and cosmetics fall in the
former category whereas, goods such as raw materials',
fuel and power, finishing materials and packing items
come in the latter category.
5. SHORT-TERM AND LONG-TERM
DEMAND

Short-term demand refers to the demand for goods
that are demanded over a short period. In this category
fall mostly the fashion consumer goods, goods of
seasonal use and inferior substitutes during the
scarcity period of superior goods.
The long-term demand, on the hand, refers to the
demand, which exists over a long-period. The change in
long-term demand is visible only after a long period.
Most generic goods have long-term demand. For
example, demand for consumer and producer goods,
durable and non-durable goods, is long-term demand,
though their different varieties or brands may have only
short-term demand.
LAW OF DEMAND

We have stated earlier that demand for a
commodity is related to price per unit of time. It is
the experience of every consumer that when the
prices of the commodities fall, they are tempted to
purchase more. Commodities and when the prices
rise, the quantity demanded decreases. There is,
thus, inverse relationship between the price of the
product and the quantity demanded. The
economists have named this inverse relationship
between demand and price as the law of demand.

E. Miller writes:
"Other things remaining the same, the quantity
demanded increases with every fall in the price and
decreases with every rise in the price".
LAW OF DEMAND
CURVE/DIAGRAM
"This curve, which shows the relation between the price of a
commodity and the amount of that commodity the consumer
wishes to purchase is called demand curve".
ASSUMPTIONS OF LAW OF
DEMAND
According to Prof. Stigler and Boulding:
There are three main assumptions of the Law:
(i) There should not be any change in the tastes of the
consumers for goods (T).
(ii) The purchasing power of the typical consumer must
remain constant (M).
(iii) The price of all other commodities should not vary (Po).
EXAMPLE OF LAW OF DEMAND
If there is a change, in the above and other assumptions, the law
May not hold true. For example, according to the law of demand,
other things being equal quantity demanded increases with a fall in
price and diminishes with rise to price. Now let us suppose that
price of tea comes down from $40 per pound to $20 per pound. The
demand for tea may not increase, because there has taken place a
change in the taste of consumers or the price of coffee has fallen down
as compared to tea or the purchasing power of the consumers has
decreased, etc., etc. From this we find that demand responds to price
inversely only, if other thing remains constant. Otherwise, the
chances are that, the quantity demanded may not increase with a
fall in price or vice-versa.
Demand, thus, is a negative relationship between price and quantity.
SLOPE OF DEMAND CURVE
The fundamental reasons for demand curve to slope downward are
as follows:
i. Law of diminishing marginal utility-When a consumer
purchases more units of a commodity, its marginal utility
declines. The consumer, therefore, will purchase more units of
that commodity only if its price falls. Thus a decrease in price
brings about an increase, in demand. The demand curve,
therefore, is downward sloping.
ii. Income effect- Other things being equal, when the price of a
commodity decreases, the real income or the purchasing power of
the household increases. The consumer is now in a position to
purchase more commodities with the same income.
iii. Substitution effect- if the price of a commodity increases the
relative price of the substitute goods decreases as a result of
which the demand for the commodity decreases.
iv. Entry of new buyers- When the price of a commodity falls, its
demand not only increases from the old buyers but the new
buyers also enter the market.
LIMITATIONS/EXCEPTIONS TO LAW
OF DEMAND
Prestigious goods: There are certain commodities like
diamond, sports cars etc., which are purchased as a mark
of distinction in society. If the price of these goods rise, the
demand for them may increase instead of falling.
ii. Price expectations: If people expect a further rise in the
price particular commodity, they may buy more in spite of
rise in price. The violation of the law in this case is only
temporary.
iii. Ignorance of the consumer: If the consumer is ignorant
about the rise in price of goods, he may buy more at a
higher price.
iv. Giffen goods: If the prices of basic goods, (potatoes, sugar,
etc) on which the poor spend a large part of their incomes
declines, the poor increase the demand for superior goods,
hence when the price of Giffen good falls, its demand also
falls. There is a positive price effect in case of Giffen goods.
i.
DEMAND FUNCTION
QD

F ( P , M , PR , T , PE , N )

Where
QD
= quantity demanded of the good or service
P = price of the good or service
M = consumers’ income(generally per capita)
P
= price of related goods or services
T = taste patterns of consumers
P
= expected price of the good in some future period
N = number of consumers in the market
R

E
DETERMINANTS OF DEMAND
Price factor
Non-price factors
1. Prices of the commodity- The functional relationship
between price of a commodity and its demand is
represented by price demand.
2. Prices of the related goods or products-substitutes,
complements
The functional relationship between demand for a
commodity and price of its related goods is represented by
cross demand.
3. Income of the consumer- the effect on demand due
to income of a consumer on the quantity demanded
depends on the nature of the commodity.
3 categories of goods Necessities
 Inferior goods
 Luxury/Normal goods
Contd..
Consumers' taste and preferences
-directly related to the quantity demanded.
4.

5.

Advertisement Expenditure

6.

Consumers’ Expectations about future price rise.

Demonstration EffectInfluence on consumers by buying pattern of other consumers.
7.

8. Consumer-Credit Facility
If it is easily available then the demand will increases and vicea-versa.
9. Distribution of National Income
MOVEMENT V/S SHIFT IN
DEMAND CURVE
Changes in demand for a commodity can be shown through the
demand curve in two ways:
(1) Movement Along the Demand Curve and (2) Shifts of the
Demand Curve.
(1) Movement Along the Demand Curve:
Demand is a multivariable function. If income and other
determinants of demand such as tastes of the consumers,
changes in prices of related goods, income distribution, etc.,
remain constant and there is a change only in price of the
commodity, then we move along the same demand curve.
In this case, the demand curve remains unchanged. When, as a
result of change in price, the quantity demanded increases or
decreases, it is technically called extension and contraction in
demand.
CONTD..

Here the price of a commodity falls from $8 to $2. As a result,
therefore, the quantity demanded increases from 100 units to 400
units per unit of time. There is extension in demand by 300 units.
This movement is from one point price quantity combination (a) to
another point (b) along a given demand curve. On the other hand,if the
price of a good rises from $2 to $8, there is contraction in demand by
300 units.
SHIFTS IN DEMAND CURVE

Demand, as we know, is determined by many factors. When there
is a change in demand due to one or more than one factors other
than price, results in the shift of demand curve.
For example, if the level of income in community rises, other
factors remaining the same, the demand for the goods increases.
Consumers demand more goods at each price per period of me (rise
or Increase in demand). The demand curve shifts upward from he
original demand curve indicating that consumers at each price
purchase more units of commodity per unit of time.
If there is a fall in the disposable income of the consumers or rise
in the prices of close substitute of a good or decline in consumer
taste or non-availability of good on credit, etc, there is a reduction
in demand (fall or decrease in demand). The fall or decrease in
demand shifts the demand curve from the original demand curve to
the left. The lower demand curve shows that consumers are able
and willing to buy less of the good at each price than before.
CONTD..
Eco final ppt

Eco final ppt

  • 1.
    PRESENTATION ON DEMAND ANALYSIS GROUPMEMBERS: ANKUR GUPTA (69) PRIYANK SOOD LINU KOSHI SAVITA RAWAT DEEPANSHU AMBERIA(101)
  • 2.
    MEANING AND DEFINITIONOF DEMAND  Demand in economics means a desire to possess a good supported by willingness and ability to pay for it.  If you have a desire to buy a certain commodity, say a car, but you do not have the adequate means to pay for it, it will simply be a wish, a desire or a want and not demand. Demand is an effective desire, i.e., a desire which is backed by willingness and ability to pay for a commodity in order to obtain it.  In the words of Prof. Hibdon: "Demand means the various quantities of goods that would be purchased per time period at different prices in a given market".
  • 3.
    CHARACTERISTICS OF DEMAND Thereare thus three main characteristic's of demand in economics. (i) Willingness and ability to pay- Demand is the amount of a commodity for which a consumer has the willingness and also the ability to buy. (ii) Demand is always at a price-If we talk of demand without reference to price, it will be meaningless. The consumer must know both the price and the commodity. He will then be able to tell the quantity demanded by him. (iii) Demand is always per unit of time-The time may be a day, a week, a month, or a year. Example: For instance, when the milk is selling at the rate of $15.0 per liter, the demand of a buyer for milk is 10 liters a day. If we do not mention the period of time, nobody can guess as to how much milk we consume? It is just possible we may be consuming ten liters of milk a week, a month or a year.
  • 4.
    TYPES OF DEMAND Themajor classifications of demand are as follows: 1. Individual and market demand 2. Demand for firm's product and industry's products 3. Autonomous and derived demand 4. Demand for durable and non-durable goods 5. Short-term and long-term demand
  • 5.
    1. INDIVIDUAL ANDMARKET DEMAND FOR A COMMODITY  "The individuals demand for a commodity is the amount of a commodity which the consumer is willing to purchase at any given price over a specified period of time".  Price (p) is here an independent variable and quantity (q) is dependent variable.
  • 6.
    CONTD. Individual's Demand Schedule: Thedemand schedule of an individual for a commodity is a list or table of the different amounts of the commodity that are purchased from the market at different prices per unit of time. An individual demand schedule for a good say shirts is presented in the table below: Individual Demand Schedule for Shirts: Price Per Shirt ($) Quantity Demanded Per Year Q dx 100 5 80 60 40 20 10 7 10 15 20 30 According to this demand schedule, an individual buys 5 shirts at $100 per shirt and 30 shirts at $10 per shirt in a year.
  • 7.
    INDIVIDUAL DEMAND CURVE Demandcurve is a graphical representation of the demand schedule. According to Lipsey: "The curve, which shows the relation between the price of a commodity and the amount of that commodity the consumer wishes to purchase is called demand curve".
  • 8.
  • 9.
    MARKET DEMAND OFA COMMODITY The market demand for a commodity is obtained by adding up the total quantity demanded at various prices by all the individual over a specified period of time in the market. It is described as the horizontal summation of the individuals demand for a commodity at various possible prices in market.
  • 10.
    MARKET DEMAND SCHEDULE Thehorizontal summation of individuals demand for a commodity will be the market demand for a commodity. In a market, there are a number of buyers for a commodity at each price. In order to avoid a lengthy addition process, we assume here that there are only four buyers for a commodity who purchase different amounts of the commodity at each price.
  • 11.
    A market DemandSchedule in a Four Consumer Market: Price ($) 10 8 6 4 2 Quantity Quantity Quantity Quantity Total Demande Demande Demanded Demande Quantity d d d Demande First Second Third Fourth d Per Buyer Buyer Buyer Buyer Week (in thousand s) 10 15 25 40 60 13 20 30 35 50 6 9 10 15 30 11 16 20 30 40 40 60 85 120 180
  • 12.
    MARKET DEMAND CURVE Market demand curve for a Commodity is the horizontal sum of individual demand curves of all the buyers in a market. This is illustrated with the help of the market demand schedule given above.
  • 13.
    DEMAND FOR FIRM’S PRODUCTAND INDUSTRY’S PRODUCT 2. The quantity of a firm's yield, that can be disposed of at a given price over a period refers to the demand for firm's product. The aggregate demand for the product of all firms of an industry is known as the marketdemand or demand for industry's product.
  • 14.
    3. AUTONOMOUS DEMANDAND DERIVED DEMAND An Autonomous demand for a product is one that arises independently of the demand for any other good whereas a derived demand is one, which is derived from demand of some other good.
  • 15.
    4. DEMAND FORDURABLE AND NON-DURABLE GOODS Durable goods are those goods whose total utility is not exhausted in single or short-run use. Such goods can be used continuously over a period of time. Durable goods may be consumer goods as well as producer goods. Durable consumer goods include clothes, shoes, house furniture, refrigerators, scooters, and cars. On the other hand, non-durable goods are those goods, which can be used only once such as food items and their total utility is exhausted in a single use. This category of goods can also be grouped under non-durable consumer and producer goods. All food items such as drinks, soap, cooking fuel, gas, kerosene, coal and cosmetics fall in the former category whereas, goods such as raw materials', fuel and power, finishing materials and packing items come in the latter category.
  • 16.
    5. SHORT-TERM ANDLONG-TERM DEMAND Short-term demand refers to the demand for goods that are demanded over a short period. In this category fall mostly the fashion consumer goods, goods of seasonal use and inferior substitutes during the scarcity period of superior goods. The long-term demand, on the hand, refers to the demand, which exists over a long-period. The change in long-term demand is visible only after a long period. Most generic goods have long-term demand. For example, demand for consumer and producer goods, durable and non-durable goods, is long-term demand, though their different varieties or brands may have only short-term demand.
  • 17.
    LAW OF DEMAND Wehave stated earlier that demand for a commodity is related to price per unit of time. It is the experience of every consumer that when the prices of the commodities fall, they are tempted to purchase more. Commodities and when the prices rise, the quantity demanded decreases. There is, thus, inverse relationship between the price of the product and the quantity demanded. The economists have named this inverse relationship between demand and price as the law of demand. E. Miller writes: "Other things remaining the same, the quantity demanded increases with every fall in the price and decreases with every rise in the price".
  • 18.
    LAW OF DEMAND CURVE/DIAGRAM "Thiscurve, which shows the relation between the price of a commodity and the amount of that commodity the consumer wishes to purchase is called demand curve".
  • 19.
    ASSUMPTIONS OF LAWOF DEMAND According to Prof. Stigler and Boulding: There are three main assumptions of the Law: (i) There should not be any change in the tastes of the consumers for goods (T). (ii) The purchasing power of the typical consumer must remain constant (M). (iii) The price of all other commodities should not vary (Po).
  • 20.
    EXAMPLE OF LAWOF DEMAND If there is a change, in the above and other assumptions, the law May not hold true. For example, according to the law of demand, other things being equal quantity demanded increases with a fall in price and diminishes with rise to price. Now let us suppose that price of tea comes down from $40 per pound to $20 per pound. The demand for tea may not increase, because there has taken place a change in the taste of consumers or the price of coffee has fallen down as compared to tea or the purchasing power of the consumers has decreased, etc., etc. From this we find that demand responds to price inversely only, if other thing remains constant. Otherwise, the chances are that, the quantity demanded may not increase with a fall in price or vice-versa. Demand, thus, is a negative relationship between price and quantity.
  • 21.
    SLOPE OF DEMANDCURVE The fundamental reasons for demand curve to slope downward are as follows: i. Law of diminishing marginal utility-When a consumer purchases more units of a commodity, its marginal utility declines. The consumer, therefore, will purchase more units of that commodity only if its price falls. Thus a decrease in price brings about an increase, in demand. The demand curve, therefore, is downward sloping. ii. Income effect- Other things being equal, when the price of a commodity decreases, the real income or the purchasing power of the household increases. The consumer is now in a position to purchase more commodities with the same income. iii. Substitution effect- if the price of a commodity increases the relative price of the substitute goods decreases as a result of which the demand for the commodity decreases. iv. Entry of new buyers- When the price of a commodity falls, its demand not only increases from the old buyers but the new buyers also enter the market.
  • 22.
    LIMITATIONS/EXCEPTIONS TO LAW OFDEMAND Prestigious goods: There are certain commodities like diamond, sports cars etc., which are purchased as a mark of distinction in society. If the price of these goods rise, the demand for them may increase instead of falling. ii. Price expectations: If people expect a further rise in the price particular commodity, they may buy more in spite of rise in price. The violation of the law in this case is only temporary. iii. Ignorance of the consumer: If the consumer is ignorant about the rise in price of goods, he may buy more at a higher price. iv. Giffen goods: If the prices of basic goods, (potatoes, sugar, etc) on which the poor spend a large part of their incomes declines, the poor increase the demand for superior goods, hence when the price of Giffen good falls, its demand also falls. There is a positive price effect in case of Giffen goods. i.
  • 23.
    DEMAND FUNCTION QD F (P , M , PR , T , PE , N ) Where QD = quantity demanded of the good or service P = price of the good or service M = consumers’ income(generally per capita) P = price of related goods or services T = taste patterns of consumers P = expected price of the good in some future period N = number of consumers in the market R E
  • 24.
    DETERMINANTS OF DEMAND Pricefactor Non-price factors 1. Prices of the commodity- The functional relationship between price of a commodity and its demand is represented by price demand. 2. Prices of the related goods or products-substitutes, complements The functional relationship between demand for a commodity and price of its related goods is represented by cross demand. 3. Income of the consumer- the effect on demand due to income of a consumer on the quantity demanded depends on the nature of the commodity. 3 categories of goods Necessities  Inferior goods  Luxury/Normal goods
  • 25.
    Contd.. Consumers' taste andpreferences -directly related to the quantity demanded. 4. 5. Advertisement Expenditure 6. Consumers’ Expectations about future price rise. Demonstration EffectInfluence on consumers by buying pattern of other consumers. 7. 8. Consumer-Credit Facility If it is easily available then the demand will increases and vicea-versa. 9. Distribution of National Income
  • 26.
    MOVEMENT V/S SHIFTIN DEMAND CURVE Changes in demand for a commodity can be shown through the demand curve in two ways: (1) Movement Along the Demand Curve and (2) Shifts of the Demand Curve. (1) Movement Along the Demand Curve: Demand is a multivariable function. If income and other determinants of demand such as tastes of the consumers, changes in prices of related goods, income distribution, etc., remain constant and there is a change only in price of the commodity, then we move along the same demand curve. In this case, the demand curve remains unchanged. When, as a result of change in price, the quantity demanded increases or decreases, it is technically called extension and contraction in demand.
  • 27.
    CONTD.. Here the priceof a commodity falls from $8 to $2. As a result, therefore, the quantity demanded increases from 100 units to 400 units per unit of time. There is extension in demand by 300 units. This movement is from one point price quantity combination (a) to another point (b) along a given demand curve. On the other hand,if the price of a good rises from $2 to $8, there is contraction in demand by 300 units.
  • 28.
    SHIFTS IN DEMANDCURVE Demand, as we know, is determined by many factors. When there is a change in demand due to one or more than one factors other than price, results in the shift of demand curve. For example, if the level of income in community rises, other factors remaining the same, the demand for the goods increases. Consumers demand more goods at each price per period of me (rise or Increase in demand). The demand curve shifts upward from he original demand curve indicating that consumers at each price purchase more units of commodity per unit of time. If there is a fall in the disposable income of the consumers or rise in the prices of close substitute of a good or decline in consumer taste or non-availability of good on credit, etc, there is a reduction in demand (fall or decrease in demand). The fall or decrease in demand shifts the demand curve from the original demand curve to the left. The lower demand curve shows that consumers are able and willing to buy less of the good at each price than before.
  • 29.