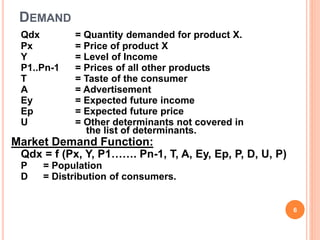
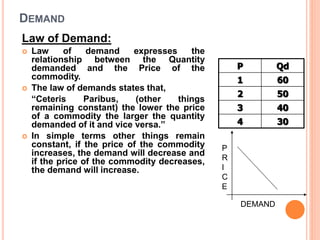
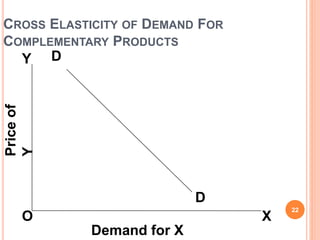
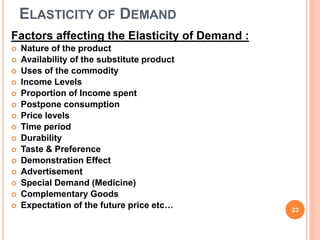
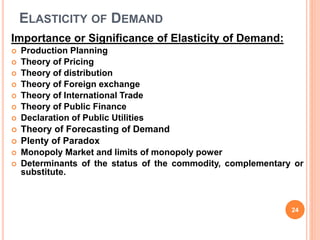
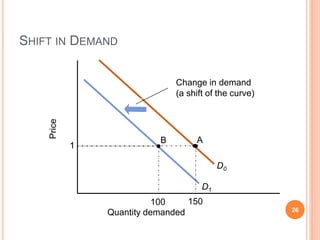
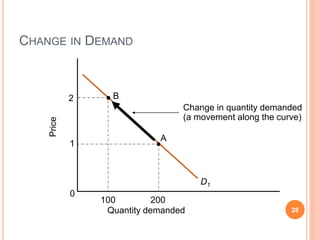
DEMAND & SUPPLY
Presented by-
Ankit Singh
1
IMPORTANT INFORMATION
 This slide is totally self made including the graphs
and diagrams. Resemblance to any slide found on
internet will only be a coincidence.
2
DEMAND
Meaning of Demand:
 Demand for a particular commodity refers to the
commodity which an individual consumer or
household is willing to purchase per unit of time at a
particular price.
 Demand for a particular commodity implies:
Desire of the customer to buy the product;
The customers willingness to buy the product;
Sufficient purchasing power in the customers possession to
buy the product.
 The demand for a particular commodity by an
individual consumer or household is known as
Individual demand for the commodity and
Summation of the individual demand is known as the
Market demand.
3
DEMAND
Factors Determining Demand:
 General Factors:
 Price of the product
 Taste and Preference
 Income
 Prices of the related goods
 Additional Factors: (Luxury Goods & Durables)
 Consumer’s Expectation of future price.
 Consumer’s Expectation of future income.
 Additional Factors:( Market Demand)
 Population
 Social, Economic & Demographic distribution of Consumer’s.
4
DEMAND
Demand Function:
 A Mathematical relationship between quantity
demanded of the commodity and its determinants
is known as Demand Function.
 When this relationship relates to the demand by an
individual consumer it is known as Individual
demand function and while it relates to the market
its known as market demand function.
 Individual Demand Function :
Qdx = f (Px, Y, P1……. Pn-1, T, A, Ey. Ep, U)
5
DEMAND
Qdx = Quantity demanded for product X.
Px = Price of product X
Y = Level of Income
P1..Pn-1 = Prices of all other products
T = Taste of the consumer
A = Advertisement
Ey = Expected future income
Ep = Expected future price
U = Other determinants not covered in
the list of determinants.
Market Demand Function:
Qdx = f (Px, Y, P1……. Pn-1, T, A, Ey, Ep, P, D, U, P)
P = Population
D = Distribution of consumers.
6
DEMAND
Demand Schedule:
 A demand schedule is a numerical tabulation that
shows the quantity of demanded commodity at
different prices.
 The demand schedule may be of 2 types :
• Individual demand Schedule
• Market demand Schedule.
Demand Curve:
 The demand curve is a graphic presentation of
quantities of a good demanded by the consumer
at various possible prices in a period of time.
7
DEMAND
Law of Demand:
 Law of demand expresses the
relationship between the Quantity
demanded and the Price of the
commodity.
 The law of demands states that,
“Ceteris Paribus, (other things
remaining constant) the lower the price
of a commodity the larger the quantity
demanded of it and vice versa.”
 In simple terms other things remain
constant, if the price of the commodity
increases, the demand will decrease and
if the price of the commodity decreases,
the demand will increase.
P Qd
1 60
2 50
3 40
4 30
8
P
R
I
C
E
DEMAND
DEMAND
Assumptions:
 No change in taste and preference.
 Income of the consumer is constant.
 No change in customs, habit, quality of goods.
 No change in substitute products, related products
and the price of the product.
 No complementary goods.
9
DEMAND
Exceptions of Law of Demand:
In certain cases the slope of Demand Curve is upward
i.e. positively sloped, it is known as the exceptions of
Law of Demand.
These exceptions are as follows:
 Giffen Goods (Giffen Paradox)
 Emergency (War etc…)
 Conspicuous necessities (Car, Fancy Cloths etc…)
and Conspicuous Consumption (Fancy Diamonds,
High price shoes, pens etc…)
 Depression ( Price and quantity demand is low)
 Ignorance Effect (High priced commodity is better in
quality)
 Speculation (Future change in price)
10
ELASTICITY OF DEMAND
Elasticity of Demand:
 Elasticity of demand is defined as the percentage
change in quantity demanded caused one percent
change in each of the determinants under
consideration while the other determinants are held
constant.
 Ed = % change in quantity demanded / % change in
the determinant.
 There are mainly three types of Elasticity of Demand :
 Price Elasticity of demand
 Income Elasticity of demand
 Cross Elasticity of demand
11
ELASTICITY OF DEMAND
Price Elasticity of Demand :
 Price Elasticity of Demand measures the degree of
responsiveness of the quantity demanded of a commodity
due to a change in its own price.
 Ep = (% change in quantity demanded) /
( % change in the Price).
 Here we ignore the –ve sign as the relation between price and
the quantity demanded is opposite & we are interested in
magnitude of responsiveness.
 Price Elasticity of Demand are of 5 types :
1. Perfectly elastic demand
2. Perfectly / Absolutely inelastic demand
3. Relatively Elastic demand
4. Relatively Inelastic demand
5. Unitary Elastic demand
12
PERFECTLY ELASTIC DEMAND
13
P
R
I
C
E
y
0 x
Perfectly elastic
demand curve
P
When the
demand for a
product
changes,
increases or
decreases
even when
there is no
change in
price, it is
known as
perfect elastic
demand.
Infinity
D1 D2
RELATIVELY ELASTIC DEMAND
14
Relatively elastic
demand curve
P
R
I
C
E
demand0 x
y
P1
When the
change in
demand is
more than the
changes in
price, it is
known as
relatively
elastic
demand.
P2
D1 D2
UNITARY ELASTIC DEMAND
15
Elasticity of
demand equal
to utility curve
y
x0 demand
P
R
I
C
E
D
D
When the
change in
demand is
equal to
changes in
price, it is
known as
unitary elastic
demand
P1
P2
D1 D2
RELATIVELY INELASTIC DEMAND
16
Relatively inelastic
demand curve
XO
Y
demand
D
D
P
R
I
C
E
When the change
in demand is less
than the changes
in price, it is
known as
relatively inelastic
demand
P
1
P2
D1 D2
PERFECTLY INELASTIC DEMAND
17
demand
D
D
Perfectly inelastic
demand curve
0
Y
X
P
R
I
C
E
When a change
in price,
howsoever large,
change no
changes in
quality demand,
it is known as
perfectly inelastic
demand
P
1
P
2
P3
ELASTICITY OF DEMAND
Income Elasticity of Demand:
 Income Elasticity of Demand measures the degree of
responsiveness of the quantity demanded of a commodity
due to a change in income of the consumer.
 Em = (% change in quantity demanded) /
( % change in the Money Income).
18
POSITIVE INCOME ELASTICITY OF DEMAND
19
Y
P
A
D
D
B S
O XQuantity Demanded
Income
ELASTICITY OF DEMAND
Cross Elasticity of Demand:
 Income Elasticity of Demand measures the
degree of responsiveness of the quantity
demanded of one commodity due to a change in
price of some related goods.
 Exy = - (% change in quantity demand of goods
Y) /
( % change in the price of goods X).
20
CROSS ELASTICITY OF DEMAND FOR SUBSTITUTES
21
Priceof
Y
Demand for X
O
Y
X
D
D
CROSS ELASTICITY OF DEMAND FOR
COMPLEMENTARY PRODUCTS
22
Priceof
Y
O
Y
X
D
D
Demand for X
ELASTICITY OF DEMAND
Factors affecting the Elasticity of Demand :
 Nature of the product
 Availability of the substitute product
 Uses of the commodity
 Income Levels
 Proportion of Income spent
 Postpone consumption
 Price levels
 Time period
 Durability
 Taste & Preference
 Demonstration Effect
 Advertisement
 Special Demand (Medicine)
 Complementary Goods
 Expectation of the future price etc… 23
ELASTICITY OF DEMAND
Importance or Significance of Elasticity of Demand:
 Production Planning
 Theory of Pricing
 Theory of distribution
 Theory of Foreign exchange
 Theory of International Trade
 Theory of Public Finance
 Declaration of Public Utilities
 Theory of Forecasting of Demand
 Plenty of Paradox
 Monopoly Market and limits of monopoly power
 Determinants of the status of the commodity, complementary or
substitute.
24
 A shift in demand is the graphical representation of the
effect of anything other than price on demand.
25
Shifts in Demand Versus Movements
Along a Demand Curve
D0
D1
SHIFT IN DEMAND
26
Price
Quantity demanded
1
100
B A
Change in demand
(a shift of the curve)
150
 A movement along a demand curve is the graphical
representation of the effect of a change in price on the
quantity demanded.
27
Shifts in Demand Versus Movements
Along a Demand Curve
CHANGE IN DEMAND
28
D1
Change in quantity demanded
(a movement along the curve)
B
0
Price
Quantity demanded
100
2
1
200
A
THANK YOU
29

Demand by Ankit Singh

  • 1.
    DEMAND & SUPPLY Presentedby- Ankit Singh 1
  • 2.
    IMPORTANT INFORMATION  Thisslide is totally self made including the graphs and diagrams. Resemblance to any slide found on internet will only be a coincidence. 2
  • 3.
    DEMAND Meaning of Demand: Demand for a particular commodity refers to the commodity which an individual consumer or household is willing to purchase per unit of time at a particular price.  Demand for a particular commodity implies: Desire of the customer to buy the product; The customers willingness to buy the product; Sufficient purchasing power in the customers possession to buy the product.  The demand for a particular commodity by an individual consumer or household is known as Individual demand for the commodity and Summation of the individual demand is known as the Market demand. 3
  • 4.
    DEMAND Factors Determining Demand: General Factors:  Price of the product  Taste and Preference  Income  Prices of the related goods  Additional Factors: (Luxury Goods & Durables)  Consumer’s Expectation of future price.  Consumer’s Expectation of future income.  Additional Factors:( Market Demand)  Population  Social, Economic & Demographic distribution of Consumer’s. 4
  • 5.
    DEMAND Demand Function:  AMathematical relationship between quantity demanded of the commodity and its determinants is known as Demand Function.  When this relationship relates to the demand by an individual consumer it is known as Individual demand function and while it relates to the market its known as market demand function.  Individual Demand Function : Qdx = f (Px, Y, P1……. Pn-1, T, A, Ey. Ep, U) 5
  • 6.
    DEMAND Qdx = Quantitydemanded for product X. Px = Price of product X Y = Level of Income P1..Pn-1 = Prices of all other products T = Taste of the consumer A = Advertisement Ey = Expected future income Ep = Expected future price U = Other determinants not covered in the list of determinants. Market Demand Function: Qdx = f (Px, Y, P1……. Pn-1, T, A, Ey, Ep, P, D, U, P) P = Population D = Distribution of consumers. 6
  • 7.
    DEMAND Demand Schedule:  Ademand schedule is a numerical tabulation that shows the quantity of demanded commodity at different prices.  The demand schedule may be of 2 types : • Individual demand Schedule • Market demand Schedule. Demand Curve:  The demand curve is a graphic presentation of quantities of a good demanded by the consumer at various possible prices in a period of time. 7
  • 8.
    DEMAND Law of Demand: Law of demand expresses the relationship between the Quantity demanded and the Price of the commodity.  The law of demands states that, “Ceteris Paribus, (other things remaining constant) the lower the price of a commodity the larger the quantity demanded of it and vice versa.”  In simple terms other things remain constant, if the price of the commodity increases, the demand will decrease and if the price of the commodity decreases, the demand will increase. P Qd 1 60 2 50 3 40 4 30 8 P R I C E DEMAND
  • 9.
    DEMAND Assumptions:  No changein taste and preference.  Income of the consumer is constant.  No change in customs, habit, quality of goods.  No change in substitute products, related products and the price of the product.  No complementary goods. 9
  • 10.
    DEMAND Exceptions of Lawof Demand: In certain cases the slope of Demand Curve is upward i.e. positively sloped, it is known as the exceptions of Law of Demand. These exceptions are as follows:  Giffen Goods (Giffen Paradox)  Emergency (War etc…)  Conspicuous necessities (Car, Fancy Cloths etc…) and Conspicuous Consumption (Fancy Diamonds, High price shoes, pens etc…)  Depression ( Price and quantity demand is low)  Ignorance Effect (High priced commodity is better in quality)  Speculation (Future change in price) 10
  • 11.
    ELASTICITY OF DEMAND Elasticityof Demand:  Elasticity of demand is defined as the percentage change in quantity demanded caused one percent change in each of the determinants under consideration while the other determinants are held constant.  Ed = % change in quantity demanded / % change in the determinant.  There are mainly three types of Elasticity of Demand :  Price Elasticity of demand  Income Elasticity of demand  Cross Elasticity of demand 11
  • 12.
    ELASTICITY OF DEMAND PriceElasticity of Demand :  Price Elasticity of Demand measures the degree of responsiveness of the quantity demanded of a commodity due to a change in its own price.  Ep = (% change in quantity demanded) / ( % change in the Price).  Here we ignore the –ve sign as the relation between price and the quantity demanded is opposite & we are interested in magnitude of responsiveness.  Price Elasticity of Demand are of 5 types : 1. Perfectly elastic demand 2. Perfectly / Absolutely inelastic demand 3. Relatively Elastic demand 4. Relatively Inelastic demand 5. Unitary Elastic demand 12
  • 13.
    PERFECTLY ELASTIC DEMAND 13 P R I C E y 0x Perfectly elastic demand curve P When the demand for a product changes, increases or decreases even when there is no change in price, it is known as perfect elastic demand. Infinity D1 D2
  • 14.
    RELATIVELY ELASTIC DEMAND 14 Relativelyelastic demand curve P R I C E demand0 x y P1 When the change in demand is more than the changes in price, it is known as relatively elastic demand. P2 D1 D2
  • 15.
    UNITARY ELASTIC DEMAND 15 Elasticityof demand equal to utility curve y x0 demand P R I C E D D When the change in demand is equal to changes in price, it is known as unitary elastic demand P1 P2 D1 D2
  • 16.
    RELATIVELY INELASTIC DEMAND 16 Relativelyinelastic demand curve XO Y demand D D P R I C E When the change in demand is less than the changes in price, it is known as relatively inelastic demand P 1 P2 D1 D2
  • 17.
    PERFECTLY INELASTIC DEMAND 17 demand D D Perfectlyinelastic demand curve 0 Y X P R I C E When a change in price, howsoever large, change no changes in quality demand, it is known as perfectly inelastic demand P 1 P 2 P3
  • 18.
    ELASTICITY OF DEMAND IncomeElasticity of Demand:  Income Elasticity of Demand measures the degree of responsiveness of the quantity demanded of a commodity due to a change in income of the consumer.  Em = (% change in quantity demanded) / ( % change in the Money Income). 18
  • 19.
    POSITIVE INCOME ELASTICITYOF DEMAND 19 Y P A D D B S O XQuantity Demanded Income
  • 20.
    ELASTICITY OF DEMAND CrossElasticity of Demand:  Income Elasticity of Demand measures the degree of responsiveness of the quantity demanded of one commodity due to a change in price of some related goods.  Exy = - (% change in quantity demand of goods Y) / ( % change in the price of goods X). 20
  • 21.
    CROSS ELASTICITY OFDEMAND FOR SUBSTITUTES 21 Priceof Y Demand for X O Y X D D
  • 22.
    CROSS ELASTICITY OFDEMAND FOR COMPLEMENTARY PRODUCTS 22 Priceof Y O Y X D D Demand for X
  • 23.
    ELASTICITY OF DEMAND Factorsaffecting the Elasticity of Demand :  Nature of the product  Availability of the substitute product  Uses of the commodity  Income Levels  Proportion of Income spent  Postpone consumption  Price levels  Time period  Durability  Taste & Preference  Demonstration Effect  Advertisement  Special Demand (Medicine)  Complementary Goods  Expectation of the future price etc… 23
  • 24.
    ELASTICITY OF DEMAND Importanceor Significance of Elasticity of Demand:  Production Planning  Theory of Pricing  Theory of distribution  Theory of Foreign exchange  Theory of International Trade  Theory of Public Finance  Declaration of Public Utilities  Theory of Forecasting of Demand  Plenty of Paradox  Monopoly Market and limits of monopoly power  Determinants of the status of the commodity, complementary or substitute. 24
  • 25.
     A shiftin demand is the graphical representation of the effect of anything other than price on demand. 25 Shifts in Demand Versus Movements Along a Demand Curve
  • 26.
    D0 D1 SHIFT IN DEMAND 26 Price Quantitydemanded 1 100 B A Change in demand (a shift of the curve) 150
  • 27.
     A movementalong a demand curve is the graphical representation of the effect of a change in price on the quantity demanded. 27 Shifts in Demand Versus Movements Along a Demand Curve
  • 28.
    CHANGE IN DEMAND 28 D1 Changein quantity demanded (a movement along the curve) B 0 Price Quantity demanded 100 2 1 200 A
  • 29.