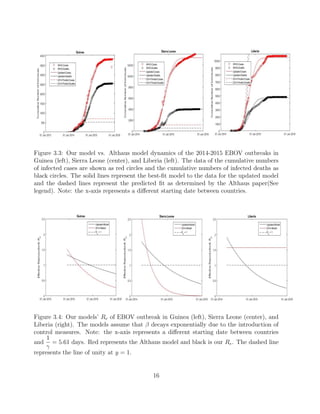
This document summarizes an SEIR model used to model the 2014-2015 Ebola outbreak in West Africa. The model tracks susceptible, exposed, infectious, and recovered individuals over time. It was able to fit reported case and death data from Guinea, Sierra Leone, and Liberia reasonably well. When updated with more recent data, the model still fit dynamics in Guinea and Sierra Leone but overestimated cases in Liberia. Parameter values like transmission rate and decay rate varied between countries and initial assumptions in the original model were too simplistic.


![Chapter 2
Model
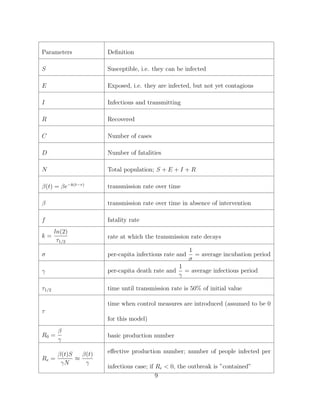
The model used in Estimating the Reproduction Number of Ebola Virus (EBOV) During
the 2014 Outbreak in West Africa [1] is an SEIR model. Before introducing the disease,
the entire population, N, is in the susceptible, S, category and are equally likely to catch
the virus. An individual who contracts Ebola then enters the incubation period, E, where
symptoms are not apparent and they are not yet infectious. Then the individual enters an
infectious stage, I, once they begin to show symptoms and can now infect others. Finally,
the individual either enters the recovered stage, R, or dies. Individuals belonging to stage
R are no longer susceptible to the virus as they have gained a temporary immunity to the
virus. C is the number of cases at a certain time. D is the number of fatalities at a certain
time.
The model ignores the initial vector of transmission from bats to humans. It only consid-
ers human to human transmission. However, it does not take into account infections caused
6](https://image.slidesharecdn.com/ebola-final-project-paper-160216032805/85/Ebola-final-project-paper-7-320.jpg)


![s(2,1).SierraLeone = ’Sierra Leone’;
s(3,1).Liberia = ’Liberia’;
countries= fieldnames(s);
beta=[.27,.45,.28]; %.27 Guinea; .45 Sierra Leon; .28 Liberia
k=[.0023,.0097,0]; % .0023 Guinea; .0097 Sierra Leon; 0* Liberia
tau=0; %Model Assumption-control measure began after appearance of first infected case;
sigma=1/5.3; %days; based on data from Congo
gamma=1/5.61; %days; ” ” ” ” ”
fata=[.74,.48,.71]; %.74 Guinea; .48 Sierra Leon; .71 Liberia
%Specify INITIAL VALUE
N= (1 ∗ 106
); %total population
S 0 = (N − 1); E 0 = 0; I 0 = 1; R 0 = 0; C 0 = 1; F 0 = 0; %proportional populations
%initial SEIR=[S 0 ; E 0; I 0; R 0]*N; %set initial pop. for each stage
initial SEIR=[S 0 ; E 0; I 0; R 0; C 0; F 0]; %set initial pop. for each stage, used when need
cases and fatalities
country data = xlsread(’previous-case-counts.xlsx’); % data from CDC, previous case
counts
% data from 3/25/14 - 11/25/15, 609 days
24](https://image.slidesharecdn.com/ebola-final-project-paper-160216032805/85/Ebola-final-project-paper-25-320.jpg)
![figure()
for i=1:3
param = [N,beta(i),k(i),tau,sigma,gamma,fata(i)];
%Call ODE solver ode45 as follows
% function F=my ebolafun(t,SEIR,N,beta,k,tau,sigma,gamma,f)
[t,SEIR]=ode45(@my ebolafun,tspan,initial SEIR,[],param);
%plot solution components vs. time
%figure(i)
subplot(3,3,i)
plot(t, SEIR(:,1)) ; hold on
plot(t, SEIR(:,2))
plot(t, SEIR(:,3))
plot(t, SEIR(:,4))
plot(t, SEIR(:,5))
plot(t, SEIR(:,6))
xlabel(’Time, t(days)’,’FontSize’,10)
ylabel(’Population of each Stage (S,E,I,R)’,’Fontsize’,10)
title([’Model Population Dynamics for ’,num2str(countriesi)],’Fontsize’,10)
legend(’S-Susceptible’,’E-Exposed’,’I-Infected’,’R-Recovered’,’C-Cases’,’F-Fatalities’,’Location’,’Best’)
25](https://image.slidesharecdn.com/ebola-final-project-paper-160216032805/85/Ebola-final-project-paper-26-320.jpg)
![R e=zeros(length(tspan),1);
for j=1:length(tspan)
beta t = beta(i)*exp(-k(i)*(j-tau));
R e(j)=beta t/gamma;
end
subplot(3,3,i+3)
plot(t,R e)
xlabel(’Time from initial breakout, t(days)’,’FontSize’,10)
ylabel(’Effective reproduction number, R e’,’Fontsize’,10)
title([num2str(countriesi)])
subplot(3,3,i+6)
t data=41723:1:42332; % same serial dates as case data
plot(country data(:,1),country data(:,2*i),’ro’); hold on;
plot(country data(:,1),country data(:,(2*i+1)),’ko’); hold on;
axis manual %keep the axis fixed now
plot(t data, SEIR(:,5),’r-’); hold on; % cases
plot(t data, SEIR(:,6),’k–’); hold on; % fatalities
%axis auto
xlabel(’Time, t(days)’,’FontSize’,10)
ylabel(’Individuals’,’FontSize’,10)
26](https://image.slidesharecdn.com/ebola-final-project-paper-160216032805/85/Ebola-final-project-paper-27-320.jpg)
![title([num2str(countriesi)])
legend(’Cases’, ’Deaths’, ’Cases Model’, ’Deaths Model’,’Location’,’northwest’)
datetick(’x’, 2)
end
my ebolafun.m
function dSEIR dt=my ebolafun(t,SEIR 0,p)
%t is the time
%SEIR is the state vector
%F is the velocity vector
%N is total pop. size = S+E+I+R
%beta is transmission rate in absence of control interventions
%k: the transmission rate was assumed to decay exponentially at rate k
%tau is the time that control measures were introduced tau <= t
N = p(1); beta = p(2); k = p(3); tau= p(4); sigma= p(5); gamma= p(6); f = p(7);
%Therefore, betat is the effect of the control measures on the
%transmission rate over time, t
beta t= beta ∗ exp(−k ∗ (t − tau));
%sigma is 1/”the average duration of incubation”
%gamma is 1/”the average duration of infectiousness”
27](https://image.slidesharecdn.com/ebola-final-project-paper-160216032805/85/Ebola-final-project-paper-28-320.jpg)
![%f is the fatality rate
S=SEIR 0(1);
E=SEIR 0(2);
I=SEIR 0(3);
R=SEIR 0(4);
dS dt=-beta t*S*I/N;
dE dt=beta t*S*I/N-sigma*E;
dI dt=sigma*E-gamma*I;
dR dt=(1-f)*gamma*I;
dC dt=sigma*E;
dF dt=f*gamma*I;
%dSEIR dt=[dS dt; dE dt; dI dt; dR dt];
dSEIR dt=[dS dt; dE dt; dI dt; dR dt; dC dt; dF dt];
end
% function R e=my ebolafun2(S,N,gamma,beta t)
% R e=beta t*S/(gamma*N);
% end
28](https://image.slidesharecdn.com/ebola-final-project-paper-160216032805/85/Ebola-final-project-paper-29-320.jpg)
![min ebola.m
function SSE=min ebola(p0)
beta=p0(1);
k=p0(2);
f=p0(3);
% parameters that are fixed
tau=0;
sigma=1/5.3;
gamma=1/5.61;
N= (1 ∗ 106
); %total population
param=[N;beta;k;tau;sigma;gamma;f];
country=8:9;
% Guin=2:3; Lib=4:5; SLeo=6:7; Tot=8:9;
country data = xlsread(’previous-case-counts.xlsx’); % data from CDC, previous case counts
CD data=country data(:,country); % only using guinea data for now
t data = country data(:,1);
%Set max time point
Tmax=max(t data);
29](https://image.slidesharecdn.com/ebola-final-project-paper-160216032805/85/Ebola-final-project-paper-30-320.jpg)
![%Time range where want solution
tspan=0:1:Tmax;
%Specify INITIAL VALUE
S 0 = (N − 1); E 0 = 0; I 0 = 1; R 0 = 0; C 0 = 1; F 0 = 0; %proportional populations
initial SEIR=[S 0 ; E 0; I 0; R 0; C 0; F 0]; %set initial pop. for each stage, used when need
cases and fatalities
[t,SEIRCD output]=ode45(@my ebolafun,tspan,initial SEIR,[],param);
CD output = [t, SEIRCD output(:,5:6)];
% From our model, get the dates that we have data for
num timepts=length(t data);
same CD output=zeros(num timepts,2);
for i=1:num timepts
same CD output(i,:)=CD output(t data(i)+1,2:3);
end
err = CD data(:,1:2)-same CD output(:,1:2);
SSE = sum(sum(err.2
));
Ebola fit.m
30](https://image.slidesharecdn.com/ebola-final-project-paper-160216032805/85/Ebola-final-project-paper-31-320.jpg)

![k= 0.0019;
f=.6662;
p0=[beta,k,f]; % initial guess for beta
% search for the parameters that give the minimum error to fitting our data
[p final,fits]=fminsearch(@ min ebola,p0);
beta=p final(1);
k=p final(2);
f=p final(3);
% now plot the data and model results using the fitted parameters we calculated
% use fitted parameters now
tau=0;
sigma=1/5.3;
gamma=1/5.61;
N= (1 ∗ 106
); %total population
param=[N;beta;k;tau;sigma;gamma;f];
%Specify INITIAL VALUE
S 0=(N-1); E 0=0; I 0=1; R 0=0; C 0=1; F 0=0; %proportional populations
32](https://image.slidesharecdn.com/ebola-final-project-paper-160216032805/85/Ebola-final-project-paper-33-320.jpg)
![initial SEIR=[S 0 ; E 0; I 0; R 0; C 0; F 0]; %set initial pop. for each stage, used when need
cases and fatalities
[t,SEIRCD output]=ode45(@my ebolafun,tspan,initial SEIR,[],param);
figure(1)
plot(t data, CD data(:,1),’ro’); hold on;
plot(t data, CD data(:,2),’ko’);
axis manual %keep the axis fixed now
plot(t, SEIRCD output(:,5),’r-’);
plot(t, SEIRCD output(:,6),’k–’);
xlabel(’time (days)’,’FontSize’,14)
ylabel(’Number of People in Population’,’FontSize’,14)
title(’Ebola in All 3 Countries’,’FontSize’,18)
legend(’WHO-Cases’,’WHO-Deaths’,’Predicted Case’,’Predicted Deaths’,’Location’,’Best’)
stability simulation.m clear all; close all;
%Parameters optimized from data in all three countries
beta0=0.3271; k0=0.0025; f0=0.4065;
sigma= 1/5.3; gamma= 1/5.61; tau= 0; N= (1 ∗ 106
); %set parameters
33](https://image.slidesharecdn.com/ebola-final-project-paper-160216032805/85/Ebola-final-project-paper-34-320.jpg)
![%Set max time point
Tmax=610;
%Time range where want solution
tspan=0:1:Tmax;
%Initially start with one infectious case
S 0=(N-1); E 0=0; I 0=1; R 0=0; C 0=1; D 0=0;
initial SEIR=[S 0 ; E 0; I 0; R 0; C 0; D 0];
n = 20; %number of points to range parameter over
%range beta, k and f from 1/2 parameter to 2 times parameter
beta range=linspace((beta0*0.5),(beta0*2),n);
k range=linspace((k0*0.5),(k0*2),n);
f range=linspace((f0*0.5),(f0*2),n);
CD vary=zeros(3,n); % initialize vector to store parameter, cases and deaths
%store the parameter being varied in the first row of CD vary
CD vary(1,:)=beta range;
%CD vary(1,:)=k range;
%CD vary(1,:)=f range;
34](https://image.slidesharecdn.com/ebola-final-project-paper-160216032805/85/Ebola-final-project-paper-35-320.jpg)
![for i=1:n;
%select the varied parameter
beta=beta range(i);
%k=k range(i);
%f=f range(i);
param=[N;beta;k0;tau;sigma;gamma;f0]; %store in one vector
[t,SEIRCD output]=ode45(@my ebolafun,tspan,initial SEIR,[],param);
%Get the last case and death from the SEIRCD output.
CD vary(2,i)=SEIRCD output(Tmax+1,5);
CD vary(3,i)=SEIRCD output(Tmax+1,6);
end
figure(1)
ax = gca;
plot(CD vary(1,:),CD vary(2,:),’r-’,’LineWidth’,4); hold on
plot(CD vary(1,:),CD vary(3,:),’k–’,’LineWidth’,4); hold on
xlabel(’beta’,’FontSize’,20)
ylabel(’Individuals’,’FontSize’,20)
title(’Ebola in all 3 Countries, Vary f’, ’FontSize’,20)
35](https://image.slidesharecdn.com/ebola-final-project-paper-160216032805/85/Ebola-final-project-paper-36-320.jpg)
![line([beta0,beta0],[0,max(max(CD vary))],’LineWidth’,4)
ax.LineWidth = 2;
ax.FontSize = 20;
legend(’Predicted Cases’, ’Predicted Deaths’,’beta from all 3 countries’,’Location’,’northwest’)
36](https://image.slidesharecdn.com/ebola-final-project-paper-160216032805/85/Ebola-final-project-paper-37-320.jpg)
![Bibliography
[1] Althaus CL. Estimating the Reproduction Number of Ebola Virus (EBOV) During the
2014 Outbreak in West Africa. PLOS Currents Outbreaks. 2014 Sep 2 . Edition 1. doi:
10.1371/currents.outbreaks.91afb5e0f279e7f29e7056095255b288.
[2] Bredow, Rafaela Von, and Veronika Hackenbroch. ”Interview with Ebola Discoverer
Peter Piot.” SPIEGEL ONLINE INTERNATIONAL. SPIEGEL ONLINE, 26 Sept.
2014. Web. 03 Dec. 2015. ¡http://www.spiegel.de/international/world/interview-with-
peter-piot-discoverer-of-the-ebola-virus-a-993111.html¿.
[3] Moore, Peter. ”The Little Book of Pandemics: 50 of the World’s Most Virulent Plagues
and Infectious Diseases.” Fall River Press, 2009: 29-31. Print.
[4] ”Modeling the Spread of Ebola.” Web. 09 Feb. 2015.
¡http://www.math.washington.edu/ morrow/mcm/mcm15/38725paper.pdf¿.
[5] ”Ebola Virus Disease.” World Health Organization. WHO, Aug. 2015. Web. 02 Dec.
2015. ¡http://www.who.int/mediacentre/factsheets/fs103/en/¿.
37](https://image.slidesharecdn.com/ebola-final-project-paper-160216032805/85/Ebola-final-project-paper-38-320.jpg)
![[6] ”Freqently Asked Questions on Ebola Virus Disease.” World Health Organization.
WHO, Aug. 2015. Web. 02 Dec. 2015. ¡http://www.who.int/csr/disease/ebola/faq-
ebola/en/¿.
[7] ”Previous Case Counts.” Center for Disease Control. CDC, 3 Dec. 2015. Web. 3
Dec. 2015. ¡http://www.cdc.gov/vhf/ebola/outbreaks/2014-west-africa/previous-case-
counts.html¿.
38](https://image.slidesharecdn.com/ebola-final-project-paper-160216032805/85/Ebola-final-project-paper-39-320.jpg)


