1. 1
Ebola 2014 outbreak – epidemic modelling in
Gueckedou, Macenta, and Conakry in Guinea.
Introduction
Almost 40 years after discovery, Ebola virus caused the greatest haemorrhagic fever
epidemic ever known, causing over 15 thousand disease cases and over 5 thousand deaths in three
most affected countries since March 2014 (data as for 16 November, updated 20 Nov, CDC). Number
of cases and deaths exceeded the summed number of cases and deaths from all previous Ebola
epidemics in Africa (Nowakowski et al., 2014; Althaus, Ch., 2014; Marcelo et al., 2014; Gire et al.
2014), and is supposed to rise until the end of December. Ebola haemorrhagic fever can reach 90%
fatality rate, based on previous epidemics’ cases, but usually this rate is around 50-70%. It is possible
to lower this rate and number of deaths by hospitalization of a case and isolation of suspected cases
for 21 days (maximal time for symptoms to emerge)(Legrand et al. 2007). This treatment allows to
stop the spread of the disease in the region, and that iswhy it is so vital in stopping current epidemic.
This paper focuses on three the most affected regions in Guinea – Gueckedou, Macenta and Conakry,
and tries to analyse disease’s spread, healthcare influence on the epidemic and to predict the further
spreadof the epidemicinthose regions.
Ebola virus – characterization, transmission and past cases
Ebola virus belongs to Filoviridae family, together with Marburgvirus and Cuevavirus. Ebola
and Marburg are known since 1976 and cause haemorrhagic fever in humans and other primates.
There are five known species of Ebola virus: Zaire ebolavirus (EBOV), and Sudan ebolavirus (SUDV) –
responsible for most of the outbreaks in African equatorial regions; Reston ebolavirus, which causes
Ebola disease in primates other than humans, but its range is restricted to Philippines (Feldmann, H.
and Geisbert, T. 2010; Pigott et al. 2014); Tai Forest ebolavirus, which was identified only twice in the
past outbreaks in Côte d’Ivoire; Bundibugyo ebolavirus is the most recent specimen discovered, it
causedtwooutbreaksso far(Groseth,A.,Feldmann,H.,Strong,J.2007).
2. 2
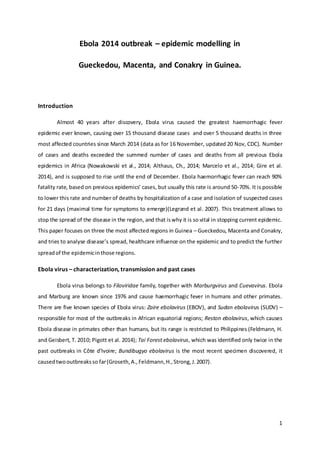
Figure 1. Ebolavirus outbreaks mapin Africa by species and size,1976-2014.
Ebola Virus Diseasedistribution map,
http://www.cdc.gov/vhf/ebola/outbreaks/history/distribution-map.html,last
accessed 25November.
2014 epidemic is caused by Zaire
ebolavirus, known for high death rates. Until this
year, this strain had caused the disease usually in
Gabon, Congo and Democratic Republic of Congo
(DRC) regions, often with an accompanying
massive extinction of gorillas in the region (Leroy
et al. 2004; Groseth, A., Feldmann, H., Strong, J.
2007; Pigottetal. 2014).
All Filoviridae are single-strained negative
RNA viruses with an envelope. Ebola virions are
tubular, with characteristic loop at one end, and
have a glycoprotein embedded in their outer
membrane. Viral genome encodes seven proteins.
Incubation period is said to be 2 to 21 days, but in
most cases symptoms start to show around 4 to 10
days since infection. Haemorrhagic disease, caused
by the virus is characterized by high fever, rash on
shoulders and torso, and impaired blood
coagulation. Massive internal bleedings are rare, and in most cases multi-organ failure and shock is
the cause of death (Feldmann, H. and Geisbert, J. 2010; Groseth, A., Feldmann, H., Strong, J. 2007).
People become infectious after the onset of symptoms and stay infectious 2 days after their death,
according to Legrand et al. (2010). Transmission of the virus occurs by the direct contact with
infected tissue or body fluid. While transmission of the Ebola virus disease (EVD) in current epidemic
is thought to be purely human-to-human transmission, people can get the disease by contact with
fruit bats (suspected to be a virus reservoirs), infected primates (gorillas) and their fluids (especially
blood and saliva), and that classifies EVD as a zoonotic disease. (Groseth, A., Feldmann, H., Strong, J.
2007; Pigottetal. 2014)
Taking into an account possible transmission routes is essential in stopping and preventing
the epidemic. In past epidemic cases itis believed that the point-zero of the disease was contact with
infected animals. Among 17 past epidemics, 9 of them was associated with bats or dead primates.
Moreover most of human EDV epidemics are accompanied with rapid decline in local wildlife, caused
by the same disease from different source (Leroy et al., 2004; Pigott et al. 2014), implying that
humansand otherprimatesare justhostsfor the virus.
3. 3
α β µ
Suspected Exposed Infected Removed
Figure 2. SEIR compartments and way of diseasetransmission between individuals.α– number of
average contacts with infected; β – diseasetransmission coefficient; µ -mortality rate/recovery rate.
There are three fruit bats species that might act as the virus reservoirs: Hypsignathus
monstrosus, Epomops franqueti and Myonycteris torquata. They are seropositive towards the virus,
but usually they are not infectious. Rapid change in their environment or physiology may be a
stimulus that cause the infection in bats, which can be further transmitted (Groseth, A., Feldmann, H.,
Strong, J. 2007; Pigott et al. 2014). Many outbreaks occur during the dry season, what may be
connected to bats’ migration (Groseth, A., Feldmann, H., Strong, J. 2007; Pigott et al. 2014). In 2014
outbreak it is prohibited to eat bat’s flesh or fruits bitten by bats to prevent possible additional
transmissionsfromanimal tohuman.
Epidemic modelling
Epidemiologists try to predict the further spread of current epidemics in various ways. One of
them is mathematical modelling. It is a theoretical model based on data and various estimates, used
to show the spread of the disease in time. One of the estimates is the contact rate between infected
individual and healthy person. The more infected individual contact with others, the further the
disease spread, causing more cases. It was Hamer (1906) who proposed this theory, which became
crucial concept in mathematical epidemiology (Becker, N. 1979). Ross (1917), Soper (1929), and
Kermack and McKendrick (1927) expanded this theory, and created a base for modern theoretical
epidemiology.
In basic epidemic theory, population is divided in compartments and transmission from one
compartment to another is based on different coefficients. Theoretical models try to mimic the
changes in population (N) during epidemic. Roughly saying population during an epidemic N equals
to number of suspected individuals (S), individuals exposed to infection (E), infected individuals (I),
and removed individuals (R). It is called SEIR model, a variation of SIR model. Modelled disease can
behave in two ways, based on its basic reproduction rate (R0). If R0 > 1, a disease spreads. If R0 < 1, a
disease dies off by itself, without a “fuel” to go on (Becker, N. 1979). It is possible to reduce R0 by
counteringthe disease byisolation of infectedandsupposedlyinfectedindividuals andhealthcare.
Epidemic modelling was used during this year Ebola outbreak to estimate possible spread of
the disease in West Africa. However the epidemic still has not ended and it is hard to correctly
4. 4
determine all coefficients as they can change over time. Still, current reports say that the number of
cases might rise two times until the end of the year, compared with the number of cases at the
beginning of November. Thanks to those predications it is possible to apply adequate
countermeasures in affected countries and hopefully model their impact on the disease’s spread. For
this research three regions in Guinea were chosen to see, how the disease spread and how it is
behavingnowtopredictfurthercases.
Materials and methods
All research was based on the data found by Emily Richards. The data provided number of
cases, suspected cases, possible cases, confirmed cases and deaths in Guinea, Liberia and Sierra
Leone since March 2014. Only three regions from Guinea – Gueckedou, Macenta, Conakry were
chosen as a research material, as they are the most affected regions in Guinea and it was the country
where the epidemic started. For the research only number cumulative cases and deaths from those
regionswere used.
Calculations done on those data included calculating fatality rate in each region (no. of
deaths divided by no. of cases, multiplied by 100%; fatality rate based on data from 4.04.2014 to
07.11.2014), case increase ratio for each month of the epidemic in the regions (no. of cases at the
beginning of the month divided by no. of cases at the end of the month), creating an epidemic model
(Becker, N. 1979; Washington, M., Atkins, Ch., Meltzer, M., 2014). Based on previous outbreaks and
current reports it was possible to define basic reproductive ratio for Ebola (1,51), maximal incubation
period (21 days), infectious period (usually 4 to 10 days, with exceptions – 2 to 21 days at maximum),
transmission of the disease between individuals (0,27 when no isolation occurs) and interval
between symptoms (9 to 16 days between symptoms in individual infected by deceased). Number of
beds available in those regions and isolation rate were based on situational report from 14
November and previous reports (Legrand et al. 2007; WHO, 14 November 2014). The data were
assignedintablesandresultsingraphs.
To do epidemic modelling and predict the future spread of epidemic we used a spreadsheet
created by CDC, especially prepared tofir the current outbreak (Washington, M., Atkins, Ch., Meltzer,
M., 2014). It was a SIIR model. To model the disease in those three regions, CDC model was copied
three times and filled with the data appropriate for each region. Spreadsheets before sensitivity
analysis and model fitting differed in population (Gueckedou 405000, Macenta 296000, Conakry
1667864), number of initially infected (86, 27 and 18, respectively). Incubation distribution by day
was set as default, and infectious days to 7. As the population was divided into three sections in the
model, the % of patients in each was changed moderately to fit better the data. All effective home
5. 5
isolation rates were turned to 0,00 as there are no specific reports or data on this kind of isolation.
Hospitalized patients rate grew in time and stopped on 0,8% rate (since 211 day of the epidemic) as
in previous outbreaks hospitalization rate did not go through that point (Legrand et al. 2007). No
additional infection transmission into the population was added. Transmission rates for hospitalized
and home isolated stayed without changes, however transmission rate for no isolated individualswas
lowered to 0,270, corresponding with transmission rate in previous outbreaks (Legrand et al. 2007).
Correctionfactorwas setat default.
After input of the data to the spreadsheets, they were checked visually and ran through
sensitivity analysis and model fitting, then checked visually once again. There were five variables
tested in sensitivity analysis: start date delay (ranged from 0 to 90 days), infectious days (1-15 days),
incubation distribution (Default modified Legrand, Elchner, Legrand), population estimates,
correctionfactor (1-4,5).
Independently from prepared EbolaResponse model, I prepared SIRD model, based on
Gueckedou cases. It included four compartments: Suspected (S), Infected (I), Recovered (R), Dead (D)
as not all casesof the disease survive.Equationswere basedon Yarus(2012) paperand simplified.
𝑑𝑆(𝑡)
𝑑𝑡
= −𝑎𝑆( 𝑡) 𝐼(𝑡)
Equation 1. Change insuspectedindividualsover time. α – transmissionrate.
𝑑𝐼(𝑡)
𝑑𝑡
= 𝑎𝑆( 𝑡) 𝐼( 𝑡) − 𝑏𝐼( 𝑡) − 𝑒𝐼(𝑡)
Equation 2. Change ininfectedindividuals over time. b – recoveryrate; e – mortalityrate.
𝑑𝑅(𝑡)
𝑑𝑡
= 𝑏𝐼( 𝑡)
Equation 3. Change inrecovered individualsover time.
𝑑𝐷(𝑡)
𝑑𝑡
= 𝑒𝐼(𝑡)
Equation 4. Change indeadpopulationover time.
There were two models, based on those equations and Geuckedou data. One presented the
spread of the disease without countermeasures, second one applied countermeasures (k coefficient,
reduced transmission of the disease thanks to countermeasures) in the halfway of the epidemic. The
difference betweenthe modelswasshownonthe graphs.
6. 6
Results
Graphs below show the course of the Ebola epidemic in Gueckedou, Macenta and Conakry
form 04.04.2012 to 07.11.2014. They consist of number of cases, number of deaths and show how
much cases rose or fell in subsequent months. The last graph summarizes cases and deaths in the
regions.
0
50
100
150
200
250
300
350
400
Cases and deaths in Gueckedou, Guinea
(04.04-07.11.2014)
Deaths
Cases
Case increase
ratio %
0
100
200
300
400
500
600
700
Cases and deaths in Macenta, Guinea
(04.04-07.11.2014)
Cases
Deaths
Case increase
ratio %
Graph 1. Number of cases and deaths in Gueckedou from April to the beginningof November. Case
increaseratio over time included.
Graph 2. Number of cases and deaths in Macenta from April to the beginning of November. Case
increaseratio over time included.
7. 7
Graph 4. Comparison of infection and death cases fromthree regions from April to early November 2014.
In Gueckedou the mortality ratio is set around 79%. In Macenta this ratio is around 63%, and
in Conakry only 43%, based on data from April to 7 November. Compared to Macenta and Conakry,
number of cases in Geuckedou region seems to stabilize because of the drop in case increase ratios
in following months, no rapid rises in months and stabilized number of cases at the end of Ocrober.
Macenta case increase ratio is not useful in describing the future spread of the epidemic as it tends
to fluctuate over time – one rise and fall at the beginning of the epidemic and recent one and
0
50
100
150
200
250
300
350
Cases and deaths in Conakry, Guinea
(04.04-07.11.2014)
Cases
Deaths
Case increase
ratio %
0
50
100
150
200
250
300
350
400
450
500
550
600
650
700
Cases and deaths in three most affected regions:
Gueckedou, Macenta, and Conakry
Gueckedou Cases
Gueckedou Deaths
Macenta Cases
Macenta Deaths
Conakry Cases
Conakry Deaths
Graph 3. Number of cases and deaths in Conakry from April to the beginningof November. Case
increaseratio over time included.
8. 8
number of cases seems to rise sharply. Conakry increase ratio seems to drop but the data are not
sufficient to determine whether the epidemic stabilizes there, as number of cases still rise at fast
pace.
Created mathematical models showed that if current ratio of care do not change in
Gueckedou it is possible for epidemic to stabilize if there is no additional transmission from the
outside until the end
Graph 5. Gueckedou cases and modeled cases based on the parameters with correction factor of 1,5 for
underreporting, model after SA (0,03) and MF. Population – 445500, number of initially infected – 86 (as for
04.04.2014),days people are infectious – 3, incubation distribution –default,start date delay – 75 days.
Model for Gueckedoudonotfitcompletelytothe data.
In cases of Conakry and Macenta it is difficult to tell if the regions will stabilize until the end
of the year.
-
100
200
300
400
500
600
CummunlativeCases
Goodness-of-Fit
Cum Cases
(modeled)
Generic cases
-
100
200
300
400
500
600
700
800
900
1,000
CummunlativeCases
Goodness-of-Fit
Generic cases (by
day)
Cum cases
(modeled)
9. 9
0
100
200
300
400
500
600
700
0 20 40 60 80
Population
Days
SIR epidemic modelling with deaths over
time and counter measures
I
R
D
introduction ofkcoefficient
Graph 6. Conakry cases and modeled cases based on the parameters with correction factor of 2,5 for
underreporting, model after SA (0,94) and MF. Population - 1667864, number of initially infected – 18 (as for
04.04.2014),days people are infectious – 7, incubation distribution –Elchner,startdate delay – 80 days.
Conakry model fits to the data. Prediction for the end of this year is around 800 cases if
correctionfactor forunderreportingistakenintoaccount.
Graph 7. Macenta cases and modeled cases based on the parameters with correction factor of 2,5 for
underreporting, model after SA (16,17) and MF. Population - 325600, number of initially infected – 27 (as for
04.04.2014),days people are infectious – 5, incubation distribution –default,start date delay – 100 days.
In Macenta case model isnot completelyfitted.
Two graphs (7 and 8) below present hypothetical case of an Ebola disease with moderate
death rate of 43%. First graph shows the epidemic spread without countermeasures. Second
introduces kcoefficient,whichlowertransmission of the disease.
-
500
1,000
1,500
2,000
2,500
3,000
CummunlativeCases
Goodness-of-Fit
Generic cases (by
day)
Cum cases
(modeled)
0
100
200
300
400
500
600
700
800
0 50 100
Population
Days
SIR epidemic modelling with deaths
over time without counter measures
I
R
D
10. 10
Discussion
It is hard to predict the spread of the disease. Models are very sensitive to parameters and
estimates. That may be why Gueckedou and Macenta models vary so much from the data. Even
thoughtthat,it ispossible topointoutsome trendsinthose models:
1. Epidemic in Gueckedou region is more or less stabilized at the moment and it is unlikely for
the disease to spread if current countermeasures stay at the level they are now. Statistical
data alsosuggestthat.
2. Epidemics in Macenta and Conakry regions might still rise in the near future and better
models are needed to fully understand how they will spread. Statistical data cannot support
the hypothesis that those regions are stabilizing, however Conakry is less affected by the
virusthan Macenta.
Gueckedou region might be the fastest stabilizing region in Guinea. Less and less new cases
are appearing in the region. It might be because the disease spread before the epidemic announced
on 22 March 2014. It is suspected that the case-zero was 2-year old child (Baize et al. 2014; WHO
report), who died in December 2013 and transmitted the EVD to her family. Just before 15 March
2014 there was a few cases of Ebola, but they were not treated accordingly to the threat (Baize et al.
2014). On 22 March, the Government of Guinea announced an epidemic situation, when 3 regions
were affected. It is highly possible that if cases from December were treated with more caution, the
epidemic could be avoided. On the other hand no one predicted that Zaire ebolavirus would emerge
in West Africa. This can rise a question about transmission of the disease in nature and control of
migrationof possible reservoirs,andstudiesabouttheirbehaviorduringwetanddryseasons.
Ebola epidemic is concerning healthcare centers around the world, and many countries
decided to help with stopping it. It seems that education about EVD and healthcare centers in
affected regions can help with preventing the further spread of disease. As was showed in graph 7
and 8, reduced transmission thanks to hospitalization and isolation stopped the spread of modeled
disease. Gueckedou and Conakry regions are provided with more beds and healthcare possibilities
(85 beds ineach region), while in Macenta exist only a transit station with 35 beds, and that might be
the cause of difference in number of cases in each region. Still, this do not explain the difference in
mortalityratesandthat shouldbe furtherinvestigated.
Worldwide agitation the epidemic caused might be also a factor that helped with dealing
with Ebola. It is possible to transmit it fairly easily to other countries if people do not know about the
11. 11
disease and its symptoms (Marcelo et al., 2014). That is why education in affected regions became
important, and possibly thanks to that we can observe rapid increase of cases as more people
decidedtoreportthe disease.
This research is not comprehensive and focuses only on three regions, rather than on a
country, so it is not possible to predict the spread of EVD in Guinea basing solely on presented data.
Moreover models (both CDC, and SIR+D) were prepared without much knowledge about
mathematical modeling, and thus can contain various errors at different stages. They also did not
include population dynamics in calculations so they might not represent reality. Still, thanks to them
it is possible to see whether statistical trends are true and rise new hypothesis about the EVD. How
isolation rates affect the spread and at what point the disease will die off? Is it possible predict next
outbreak and its size, based on the data accumulated in 2014 epidemic? And finally – how can we
preventorstop the nextEbolaepidemic,beforeitstartsto spreadat uncontrollablerate?
Bibliography
Althaus, Ch. (2014). Estimating the reproduction number of EbolaVirus (EBOV) duringthe 2014 outbreakinWest Africa.
PLOS Currents Outbreaks, 2014 Sep 2, edition1.
Baize et al. (2014). Emergence of Zaire Ebola Virus Disease inGuinea — PreliminaryReport. The New EnglandJournalof
Medicine, April.
Becker, N. (1979). The usesof epidemic models. Biometrics, 35 (1), p. 295-305
Feldmann , H., Geisbert, T. (2010). Ebola haemorrhagic fever. Lancet 2011, 377, p. 849–62.
Gire et al. (2014). Genomic surveillance elucidates Ebola virus origin and transmission during the 2014 outbreak. Science,
345 (6202), p.1369–1372.
Groseth, A., Feldmann, H., Strong, J. (2007). The ecologyof Ebolavirus. TRENDSin Microbiology, 15 (9), p. 408-416.
Legrandet al. (2007). Understanding the dynamics of Ebola epidemics. Epidemiologyand Infection, 135 (4), p. 610–621.
Leroyet al. (2004). Multiple Ebola Virus transmissionevents andrapiddecline of Central Africanwildlife. Science, 303
(5656), p. 387-390.
Marceloet al. (2014). Assessing the international spreadingriskassociatedwith the 2014 West AfricanEbola outbeak. .
PLOS Currents Outbreaks, 2014 Sep 2, edition1.
12. 12
Nowakowski et al. (2014). Ebola:tracking the outbreak. Online access at:
http://news.nationalgeographic.com/news/2014/09/140925-mapping-the-spread-of-ebola/, last accessed25 November
2014.
Pigott et al. (2014). Mappingthe zoonotic niche of Ebola virus disease inAfrica. eLife 2014;doi: 10.7554/eLife.04395
Yarus, Zach(2012). A mathematicallook at the Ebola virus. Accessed online at
http://home2.fvcc.edu/~dhicketh/DiffEqns/Spring2012Projects/Zach%20Yarus%20-
Final%20Project/Final%20Diffy%20Q%20project.pdf , last accessed:25 November.
Washington, M., Atkins, Ch., Meltzer, M., CDC(2014). Generic EbolaResponse (ER) :modeling the spread ofdisease impact
& intervention. Version2.5. Publishedat:http://stacks.cdc.gov/view/cdc/24900
WHO (2014). Ebola response roadmap - Situationreport update. 14 November 2014. Accessedonline at:
http://www.who.int/csr/disease/ebola/situation-reports/en/?m=20141114, last accessed:25 November.
WHO (2014). Ground zeroinGuinea:the outbreak smoulders – undetected – for more than3 months. Accessed online:
http://www.who.int/csr/disease/ebola/ebola-6-months/guinea/en/, last accessed:25 November.