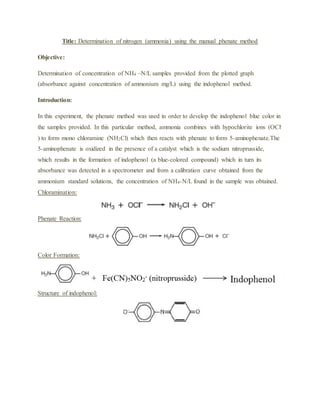
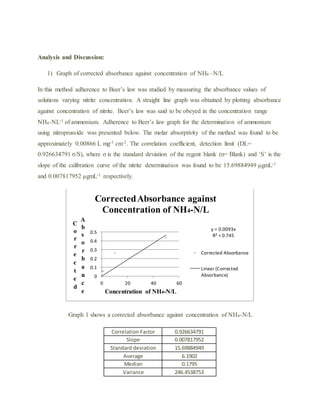
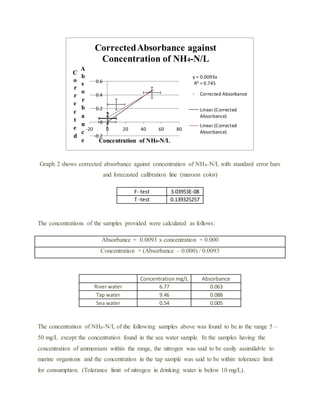
Title: Determination of nitrogen (ammonia) using the manual phenate method
Objective:
Determination of concentration of NH4 –N/L samples provided from the plotted graph
(absorbance against concentration of ammonium mg/L) using the indophenol method.
Introduction:
In this experiment, the phenate method was used in order to develop the indophenol blue color in
the samples provided. In this particular method, ammonia combines with hypochlorite ions (OCl-
) to form mono chloramine (NH2Cl) which then reacts with phenate to form 5-aminophenate.The
5-aminophenate is oxidized in the presence of a catalyst which is the sodium nitroprusside,
which results in the formation of indophenol (a blue-colored compound) which in turn its
absorbance was detected in a spectrometer and from a calibration curve obtained from the
ammonium standard solutions, the concentration of NH4-N/L found in the sample was obtained.
Chloramination:
Phenate Reaction:
Color Formation:
Structure of indophenol:
Risk Assessment
Phenol is highly corrosive and a strong irritant. Use gloves when handling. Sodium hypochlorite
also known as a bleaching agent is corrosive. The former in liquid state and gas are harmful.
Hence it must be used in fume hood. Sodium hydroxide is hygroscopic and tri-sodium citrate as
well as ammonium chloride irritates eyes and the skin. Wear appropriate gloves, goggles and lab
coats.
Glassware: 5 volumetric flasks of 100 ml, 9 conical flasks of 50 ml, pipette, burette, measuring
cylinder and beakers.
Access to: Electronic balance, fume hood, spectrophotometer
Reagents: Liquid phenol, sodium nitroprusside solid, tri-sodium citrate solid, sodium hydroxide
pellets, sodium hypochlorite, ammonium chloride solution and ethanol solution.
Procedure:
1. Preparation of Reagents
A. Phenol solutions
11.1 ml liquefied phenol was dissolved in 95% ethanol in a 100 ml volumetric flask and made up
to the mark.
B. Sodium nitroprusside
0.5 g of sodium nitroprusside was dissolved in 100 ml deionized water in a volumetric flask.
C. Alkaline citrate
100 g tri-sodium citrate was dissolved with 5 g sodium hydroxide in 500 ml of deionized water.
D. Sodium hypochlorite
It was obtained by the lab technician. It is commercially available about 5%.
E. Oxidizing solution
100 ml of alkaline citrate solution was mixed with 25 ml of sodium hypochlorite and made up to
the mark in a 500 ml of volumetric flask.
F. Stock ammonium solution
3.819 g of anhydrous ammonium chloride was dissolved in 1000 ml of distilled water. This
solution was equivalent to 1000 mg NH4- N/L.
G. Standard ammonium solution
The stock solution was used to prepare a series of standard ammonium solutions in the next step.
2. Preparation of ammonium standards and to obtain color for absorbance
i. A series of standard solutions was prepared covering then concentrations of 1000,
100, 10, 1, 0.1 mg NH4-N/L by making appropriate dilutions with deionized water.
The standards were prepared in 100 ml of volumetric flask.
Standard Name Concentration / mgL-1 Volume of stock
ammonium solution/
cm3
Volume of deionized
water needed for
dilution/ cm3
A 1000 100 0
B 100 10 90
C 10 1 99
D 1 0.1 99.9
E 0.1
Table 1 shows the preparation of different standards with different concentrations.
Note: Sample number E was not carried out since the volume was too small to be measured with
a burette.
ii. To a 25 ml sample (standard ammonium solution) in a conical flask,
a. 1ml of phenol solution,
b. 1ml of sodium nitroprusside solution and
c. 2.5ml of oxidizing solution were added, was added with constant mixing.
The sample was then covered with Para film and the color was allowed to develop for 1 hour.
Observation
A blue color was developed ranging from dark blue to pale blue. When the absorbance of these
samples was measured at 640 nm, the spectrophotometer was unable to read for standard A,B,C
and D as they had the highest concentration of nitrogen as their color was the darkest.
Dilution of A, B, C and D.
From the conical flask, 5 ml of A was taken using a pipette and transferred to its respective 100
ml volumetric flask. Deionized water was added till the mark.
10 ml of B, C and D was diluted to 100 ml water up to the mark. Then the absorbances were
measured using deionized water as reference.
Sample Name Absorbance Corrected Absorbance Concentration of
NH4–N/L
Blank 2 0.174 0 0
A 0.607 0.433 50
B 0.433 0.259 10
Blank 2 0.164 0 0
C 0.216 0.052 1
D 0.222 0.058 0.1
River water 0.227 0.063
Tap water 0.252 0.088
Sea water 0.169 0.005
Table 2 shows different concentrations and its absorbances.
Calculations:
1. Concentration of NH4-N/L in the standard ammonium solutions
Using m1V1 = m2V2
For example A: 1000 x V1 = 1000 x 100
V1 = (100 x 1000) / 1000 = 100 ml
2. Concentration of NH4-N/L in samples after dilution and color has been developed
For A: 1000 ml of solution of A = 1000 x 10-3 mol
5 ml of solution of A = 5 x 10⁻³ mol
Thus in 100 ml of solution after dilution = 5 x 10⁻³ mol
1000 ml of solution = 0.05 mol = 50 mg/L
The above calculation was then repeated for B, C and D.
Example for B:
For B: 1000 ml of solution of A = 1000 x 10-3 mol
10 ml of solution of A = 10 x 10-3 mol
Thus in 100 ml of solution after dilution = 10 x 10-3 mol
1000 ml of solution = 0.10 mol = 10 mg/L
Analysis and Discussion:
1) Graph of corrected absorbance against concentration of NH4 –N/L
In this method adherence to Beer’s law was studied by measuring the absorbance values of
solutions varying nitrite concentration. A straight line graph was obtained by plotting absorbance
against concentration of nitrite. Beer’s law was said to be obeyed in the concentration range
NH4-NL-1 of ammonium. Adherence to Beer’s law graph for the determination of ammonium
using nitroprusside was presented below. The molar absorptivity of the method was found to be
approximately 0.00866 L mg-1 cm-2. The correlation coefficient, detection limit (DL=
0.926634791 σ/S), where σ is the standard deviation of the regent blank (n= Blank) and ‘S’ is the
slope of the calibration curve of the nitrite determination was found to be 15.69884949 μgmL-1
and 0.007817952 μgmL-1 respectively.
Graph 1 shows a corrected absorbance against concentration of NH4-N/L
Correlation Factor 0.926634791
Slope 0.007817952
Standard deviation 15.69884949
Average 6.1902
Median 0.1795
Variance 246.4538753
y = 0.0093x
R² = 0.745
0
0.1
0.2
0.3
0.4
0.5
0 20 40 60
C
o
r
r
e
c
t
e
d
A
b
s
o
r
b
a
n
c
e Concentration of NH4-N/L
CorrectedAbsorbance against
Concentration of NH4-N/L
Corrected Absorbance
Linear (Corrected
Absorbance)
Graph 2 shows corrected absorbance against concentration of NH4-N/L with standard error bars
and forecasted calibration line (maroon color)
F- test 3.03953E-08
T -test 0.139325257
The concentrations of the samples provided were calculated as follows:
Absorbance = 0.0093 x concentration + 0.000
Concentration = (Absorbance – 0.000) / 0.0093
Concentration mg/L Absorbance
River water 6.77 0.063
Tap water 9.46 0.088
Sea water 0.54 0.005
The concentration of NH4-N/L of the following samples above was found to be in the range 5 –
50 mg/L except the concentration found in the sea water sample. In the samples having the
concentration of ammonium within the range, the nitrogen was said to be easily assimilable to
marine organisms and the concentration in the tap sample was said to be within tolerance limit
for consumption. (Tolerance limit of nitrogen in drinking water is below 10 mg/L).
y = 0.0093x
R² = 0.745
-0.2
0
0.2
0.4
0.6
-20 0 20 40 60 80
C
o
r
r
e
c
t
e
d
A
b
s
o
r
b
a
n
c
e Concentration of NH4-N/L
CorrectedAbsorbance against
Concentration of NH4-N/L
Corrected Absorbance
Linear (Corrected
Absorbance)
Linear (Corrected
Absorbance)
If nitrogen level is greater than 10 mg/L, it is said to cause methemoglobinemia. The tolerance
level of nitrogen in sea water is below 1 mg/L. Reverse osmosis can be done to remove excess
nitrogen where pressure is applied to water to force it through a semi permeable membrane. As
water passes through, the membrane filters out the most of the impurities. It is said that 85-95%
of ammonium was removed from this process.
Effect of Divers Ions
The effect of various non-target species on the determination of nitrite and nitrate were
determined. The studies revealed that Mg (11) and Ca (II) can show severe interference which
was overcome by adding citrate which precipitates them at high pH. Other interferences can be
Glycine, urea, glutamic acid, cyanates, and acetamide hydrolyze very slowly in solution on
standing but, of these; only urea and cyanates will hydrolyze on distillation at pH of 9.5.
Hydrolysis amounts to about 7% at this pH for urea and about 5% for cyanates.
The proposed method was applied to the quantitative determinations of ammonium in different
water samples. Statistical analyses of the results by t- and F-tests show that, there was no
significant difference in accuracy and precision of the proposed and reported method. The
precision of the proposed method was evaluated by replicate analysis of samples containing
ammonium at five different concentrations. The reagents provide a simple and sensitive method
for the spectrophotometric determination of ammonium. The proposed method has been
successfully applied to the determination of trace amounts of ammonium in different water
samples. This method was said to be applied successfully to the determination of trace amounts
of ammonia in pharmaceutical preparations.
Various instrumental methods such as Nessler can be used in the determination of ammonium
where the Nessler reagent (K2HgI4) reacts with ammonia under strong alkaline conditions to
produce a yellow-colored species where the intensity of the color is directly proportional to the
ammonia concentration.
2KsHgI4 + NH3 + 3KOH → Hg2OINH2 + 7KI + 2H2O
Another method is the Ion Selective Electrode (ISE) method.
Conclusion
The reagents provide a simple and sensitive method for the spectrophotometric determination of
ammonium. The reagents have the advantage of high sensitivity and low absorbance of reagent
blank. The developed method does not involve any stringent reaction conditions and offers the
advantages of color stability for about more than 2 hours. The proposed method has been
successfully applied to the determination of trace amounts of ammonium in different water
samples.
References:
 NICHOLS, M.S. & M.E. FOOTE. 1931. Distillation of free ammonia from buffered
solutions. Ind. Eng. Chem., Anal. Ed. 3:311.
 TARAS, M.J. 1953. Effect of free residual chlorination of nitrogen compounds in water.
J.Amer. Water Works Assoc. 45:47.
 GRASSHOFF, K., EHRHARDT, M. and KREMLING, K., Methods of Seawater
Analysis (Verlag Chemie, D-6940 Weinheirn, 1983), 363-365.
 Manualfor Oceanographic Observation (Oceanographic Society of Japan, 1985).

Phenate method of ammonia

  • 1.
    Title: Determination ofnitrogen (ammonia) using the manual phenate method Objective: Determination of concentration of NH4 –N/L samples provided from the plotted graph (absorbance against concentration of ammonium mg/L) using the indophenol method. Introduction: In this experiment, the phenate method was used in order to develop the indophenol blue color in the samples provided. In this particular method, ammonia combines with hypochlorite ions (OCl- ) to form mono chloramine (NH2Cl) which then reacts with phenate to form 5-aminophenate.The 5-aminophenate is oxidized in the presence of a catalyst which is the sodium nitroprusside, which results in the formation of indophenol (a blue-colored compound) which in turn its absorbance was detected in a spectrometer and from a calibration curve obtained from the ammonium standard solutions, the concentration of NH4-N/L found in the sample was obtained. Chloramination: Phenate Reaction: Color Formation: Structure of indophenol:
  • 2.
    Risk Assessment Phenol ishighly corrosive and a strong irritant. Use gloves when handling. Sodium hypochlorite also known as a bleaching agent is corrosive. The former in liquid state and gas are harmful. Hence it must be used in fume hood. Sodium hydroxide is hygroscopic and tri-sodium citrate as well as ammonium chloride irritates eyes and the skin. Wear appropriate gloves, goggles and lab coats. Glassware: 5 volumetric flasks of 100 ml, 9 conical flasks of 50 ml, pipette, burette, measuring cylinder and beakers. Access to: Electronic balance, fume hood, spectrophotometer Reagents: Liquid phenol, sodium nitroprusside solid, tri-sodium citrate solid, sodium hydroxide pellets, sodium hypochlorite, ammonium chloride solution and ethanol solution. Procedure: 1. Preparation of Reagents A. Phenol solutions 11.1 ml liquefied phenol was dissolved in 95% ethanol in a 100 ml volumetric flask and made up to the mark. B. Sodium nitroprusside 0.5 g of sodium nitroprusside was dissolved in 100 ml deionized water in a volumetric flask. C. Alkaline citrate 100 g tri-sodium citrate was dissolved with 5 g sodium hydroxide in 500 ml of deionized water. D. Sodium hypochlorite It was obtained by the lab technician. It is commercially available about 5%.
  • 3.
    E. Oxidizing solution 100ml of alkaline citrate solution was mixed with 25 ml of sodium hypochlorite and made up to the mark in a 500 ml of volumetric flask. F. Stock ammonium solution 3.819 g of anhydrous ammonium chloride was dissolved in 1000 ml of distilled water. This solution was equivalent to 1000 mg NH4- N/L. G. Standard ammonium solution The stock solution was used to prepare a series of standard ammonium solutions in the next step. 2. Preparation of ammonium standards and to obtain color for absorbance i. A series of standard solutions was prepared covering then concentrations of 1000, 100, 10, 1, 0.1 mg NH4-N/L by making appropriate dilutions with deionized water. The standards were prepared in 100 ml of volumetric flask. Standard Name Concentration / mgL-1 Volume of stock ammonium solution/ cm3 Volume of deionized water needed for dilution/ cm3 A 1000 100 0 B 100 10 90 C 10 1 99 D 1 0.1 99.9 E 0.1 Table 1 shows the preparation of different standards with different concentrations. Note: Sample number E was not carried out since the volume was too small to be measured with a burette. ii. To a 25 ml sample (standard ammonium solution) in a conical flask, a. 1ml of phenol solution, b. 1ml of sodium nitroprusside solution and c. 2.5ml of oxidizing solution were added, was added with constant mixing.
  • 4.
    The sample wasthen covered with Para film and the color was allowed to develop for 1 hour. Observation A blue color was developed ranging from dark blue to pale blue. When the absorbance of these samples was measured at 640 nm, the spectrophotometer was unable to read for standard A,B,C and D as they had the highest concentration of nitrogen as their color was the darkest. Dilution of A, B, C and D. From the conical flask, 5 ml of A was taken using a pipette and transferred to its respective 100 ml volumetric flask. Deionized water was added till the mark. 10 ml of B, C and D was diluted to 100 ml water up to the mark. Then the absorbances were measured using deionized water as reference. Sample Name Absorbance Corrected Absorbance Concentration of NH4–N/L Blank 2 0.174 0 0 A 0.607 0.433 50 B 0.433 0.259 10 Blank 2 0.164 0 0 C 0.216 0.052 1 D 0.222 0.058 0.1 River water 0.227 0.063 Tap water 0.252 0.088 Sea water 0.169 0.005 Table 2 shows different concentrations and its absorbances.
  • 5.
    Calculations: 1. Concentration ofNH4-N/L in the standard ammonium solutions Using m1V1 = m2V2 For example A: 1000 x V1 = 1000 x 100 V1 = (100 x 1000) / 1000 = 100 ml 2. Concentration of NH4-N/L in samples after dilution and color has been developed For A: 1000 ml of solution of A = 1000 x 10-3 mol 5 ml of solution of A = 5 x 10⁻³ mol Thus in 100 ml of solution after dilution = 5 x 10⁻³ mol 1000 ml of solution = 0.05 mol = 50 mg/L The above calculation was then repeated for B, C and D. Example for B: For B: 1000 ml of solution of A = 1000 x 10-3 mol 10 ml of solution of A = 10 x 10-3 mol Thus in 100 ml of solution after dilution = 10 x 10-3 mol 1000 ml of solution = 0.10 mol = 10 mg/L
  • 6.
    Analysis and Discussion: 1)Graph of corrected absorbance against concentration of NH4 –N/L In this method adherence to Beer’s law was studied by measuring the absorbance values of solutions varying nitrite concentration. A straight line graph was obtained by plotting absorbance against concentration of nitrite. Beer’s law was said to be obeyed in the concentration range NH4-NL-1 of ammonium. Adherence to Beer’s law graph for the determination of ammonium using nitroprusside was presented below. The molar absorptivity of the method was found to be approximately 0.00866 L mg-1 cm-2. The correlation coefficient, detection limit (DL= 0.926634791 σ/S), where σ is the standard deviation of the regent blank (n= Blank) and ‘S’ is the slope of the calibration curve of the nitrite determination was found to be 15.69884949 μgmL-1 and 0.007817952 μgmL-1 respectively. Graph 1 shows a corrected absorbance against concentration of NH4-N/L Correlation Factor 0.926634791 Slope 0.007817952 Standard deviation 15.69884949 Average 6.1902 Median 0.1795 Variance 246.4538753 y = 0.0093x R² = 0.745 0 0.1 0.2 0.3 0.4 0.5 0 20 40 60 C o r r e c t e d A b s o r b a n c e Concentration of NH4-N/L CorrectedAbsorbance against Concentration of NH4-N/L Corrected Absorbance Linear (Corrected Absorbance)
  • 7.
    Graph 2 showscorrected absorbance against concentration of NH4-N/L with standard error bars and forecasted calibration line (maroon color) F- test 3.03953E-08 T -test 0.139325257 The concentrations of the samples provided were calculated as follows: Absorbance = 0.0093 x concentration + 0.000 Concentration = (Absorbance – 0.000) / 0.0093 Concentration mg/L Absorbance River water 6.77 0.063 Tap water 9.46 0.088 Sea water 0.54 0.005 The concentration of NH4-N/L of the following samples above was found to be in the range 5 – 50 mg/L except the concentration found in the sea water sample. In the samples having the concentration of ammonium within the range, the nitrogen was said to be easily assimilable to marine organisms and the concentration in the tap sample was said to be within tolerance limit for consumption. (Tolerance limit of nitrogen in drinking water is below 10 mg/L). y = 0.0093x R² = 0.745 -0.2 0 0.2 0.4 0.6 -20 0 20 40 60 80 C o r r e c t e d A b s o r b a n c e Concentration of NH4-N/L CorrectedAbsorbance against Concentration of NH4-N/L Corrected Absorbance Linear (Corrected Absorbance) Linear (Corrected Absorbance)
  • 8.
    If nitrogen levelis greater than 10 mg/L, it is said to cause methemoglobinemia. The tolerance level of nitrogen in sea water is below 1 mg/L. Reverse osmosis can be done to remove excess nitrogen where pressure is applied to water to force it through a semi permeable membrane. As water passes through, the membrane filters out the most of the impurities. It is said that 85-95% of ammonium was removed from this process. Effect of Divers Ions The effect of various non-target species on the determination of nitrite and nitrate were determined. The studies revealed that Mg (11) and Ca (II) can show severe interference which was overcome by adding citrate which precipitates them at high pH. Other interferences can be Glycine, urea, glutamic acid, cyanates, and acetamide hydrolyze very slowly in solution on standing but, of these; only urea and cyanates will hydrolyze on distillation at pH of 9.5. Hydrolysis amounts to about 7% at this pH for urea and about 5% for cyanates. The proposed method was applied to the quantitative determinations of ammonium in different water samples. Statistical analyses of the results by t- and F-tests show that, there was no significant difference in accuracy and precision of the proposed and reported method. The precision of the proposed method was evaluated by replicate analysis of samples containing ammonium at five different concentrations. The reagents provide a simple and sensitive method for the spectrophotometric determination of ammonium. The proposed method has been successfully applied to the determination of trace amounts of ammonium in different water samples. This method was said to be applied successfully to the determination of trace amounts of ammonia in pharmaceutical preparations. Various instrumental methods such as Nessler can be used in the determination of ammonium where the Nessler reagent (K2HgI4) reacts with ammonia under strong alkaline conditions to produce a yellow-colored species where the intensity of the color is directly proportional to the ammonia concentration. 2KsHgI4 + NH3 + 3KOH → Hg2OINH2 + 7KI + 2H2O Another method is the Ion Selective Electrode (ISE) method.
  • 9.
    Conclusion The reagents providea simple and sensitive method for the spectrophotometric determination of ammonium. The reagents have the advantage of high sensitivity and low absorbance of reagent blank. The developed method does not involve any stringent reaction conditions and offers the advantages of color stability for about more than 2 hours. The proposed method has been successfully applied to the determination of trace amounts of ammonium in different water samples. References:  NICHOLS, M.S. & M.E. FOOTE. 1931. Distillation of free ammonia from buffered solutions. Ind. Eng. Chem., Anal. Ed. 3:311.  TARAS, M.J. 1953. Effect of free residual chlorination of nitrogen compounds in water. J.Amer. Water Works Assoc. 45:47.  GRASSHOFF, K., EHRHARDT, M. and KREMLING, K., Methods of Seawater Analysis (Verlag Chemie, D-6940 Weinheirn, 1983), 363-365.  Manualfor Oceanographic Observation (Oceanographic Society of Japan, 1985).