This document summarizes several published methods for sizing explosion vents for gas and dust explosions. For gases, it describes equations from NFPA 68 (1994 and 2007 editions), BS EN 14994, and other standards. For dusts, it discusses the Radandt and Simpson methods from NFPA 68 (1994), as well as equations from VDI 3673 and later NFPA 68 editions. The document aims to compare experimental explosion data with predictions from these vent sizing correlations.
![- 3 -
2 Explosion Vent Sizing
2.1 Gases
2.1.1 NFPA 68 1994 Edition
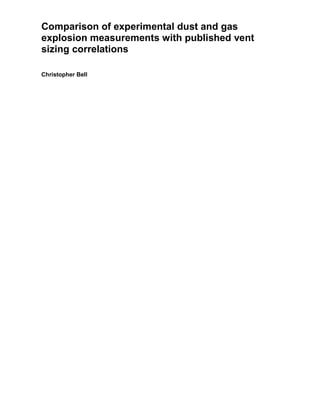
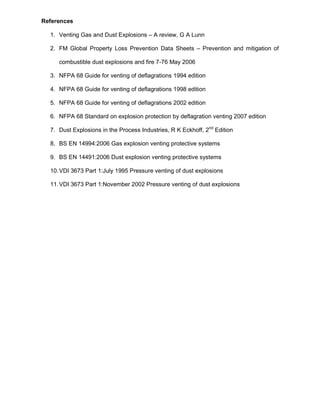
The 1994 edition of the NFPA 68 standard provided the following equation for the
estimation of explosion vent area for high strength enclosures (i.e. capable of
withstanding greater that 100 mbarg)
d
red
cPb
v PeaVA stat
=
Where V is the vessel volume, m3
e is the base of natural logarithm
Pstat is the vent opening pressure, barg
Pred is the maximum pressure developed during venting within the enclosure, or the
reduced explosion pressure, barg
a, b, and c are constants that are dependant on the fuels reactivity, and are shown
in the table below:
Table 1: Constants for use in explosion vent sizing [3]
a b c d
Methane 0.105 0.770 1.230 -0.823
Propane 0.148 0.703 0.942 -0.671
Hydrogen 0.279 0.680 0.755 -0.393
Coke Gas 0.150 0.695 1.380 -0.707
This equation was developed based on the explosion nomographs that were
published within the standard, with the use of the equation limited to enclosures
having a length to diameter ratio of less than 5. For fuels other than those listed in
the above table if the fundamental burning velocity is less than 60 cm/sec i.e. 1.3
times that of propane, then the propane constants are used. If the fundamental
burning velocity is greater than 60 cm/secs then the hydrogen equation is used.
However, it should be noted that this method is no longer considered appropriate as
it does not take sufficient account of the fuels reactivity, for example hydrogen is ten
times as reactive as methane yet use of the NFPA 68:1994 edition nomographs, on
which the above equation is based, will yield similar results.
2.1.2 NFPA 68: 2007 Edition
Subsequent revisions of the NFPA 68 standard used correlations based on VDI
guidelines [10] and [11], which also remains unaltered in the latest 2007 edition of
the standard.
For explosion vent sizing of enclosures having a length to diameter ratio of less
than 2, the vent size can be estimated from the equation:-
( ) ( ) ( )[ ]{ } ( ) ( )[ ] 3
2
572.03
2
582.0
10 1.0175.00567.0log127.0 VPPVPKA statredredGv −+−= −−
Where KG is the gas deflagration index, = (dP/dt)max V(1/3)](https://image.slidesharecdn.com/f38505f3-e9e6-4d69-9d1b-a449cf27c03d-160720055402/85/Dust-explosion-sizing-comparison-3-320.jpg)
![- 4 -
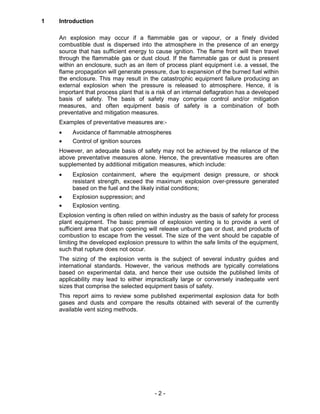
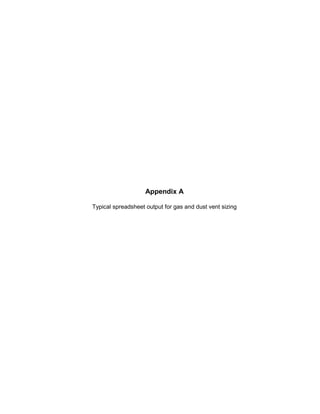
(dP/dt)max is the maximum rate of pressure rise obtained from standardised
experimental test equipment, bar/s
For enclosures having length to diameter ratios between 2 and 5 an additional vent
area should be added to the vent area estimated from the above equation.
750
2
2
−
=∆
D
L
KA
A
Gv
The limits of applicability for the above method are:-
KG ≤ 550 bar.m/sec
Pred ≤ 2 bar and at least 0.05 bar > Pstat
Pstat ≤ 0.5 bar
V ≤ 1000 m³
2.1.3 BS EN 14994:2006
The harmonised European norm standard EN 14994 also utilises the VDI
correlation
( ) ( ) ( )[ ]{ } ( ) ( )[ ] 3
2
5722.03
2
5817.0
10 1.01754.00567.0log1265.0 VPPVPKA statredredGv −+−= −−
However, this standard also provides an alternative simple vent sizing method,
which is based on the turbulent Bradley number:-
( ) ( )
( ) ( )
25.0
5.25.2
5.2
5.25.2
8.59.7:1if
65.5:1if
t
i
istat
i
red
i
istat
i
red
t
i
istat
i
red
i
istat
i
red
Br
P
PP
P
P
P
PP
P
P
Br
P
PP
P
P
P
PP
P
P
−=
+
≥
+
=
+
<
+
−
The turbulent Bradley number is subsequently used to solve the following equation:-
Where cui is the speed of sound at initial conditions of explosion, m/s
Ei is the expansion ratio of the combustion products
A is the vent area, m²
Pi is the initial enclosure pressure, bar
Sui is the burning velocity at the initial conditions, m/s
β is an empirical constant = 0.5 for hydrocarbons, and 0.8 for hydrogen](https://image.slidesharecdn.com/f38505f3-e9e6-4d69-9d1b-a449cf27c03d-160720055402/85/Dust-explosion-sizing-comparison-4-320.jpg)
![- 5 -
α is an empirical constant = 1.75 for hydrocarbons and 1 for hydrogen
γu is the ratio of specific heats of the unburned mixture
πv = (Pstat + Pi)/ Pi
π0 = 3.14
πi# is initial pressure expressed in bar i.e. (Pi/ 1, bar)
The quoted limits of applicability for the above simple method are:-
L/D ≤ 3
V ≤ 8000 m³
0.09 < A/V2/3
< 1.23
0 ≤ Pstat ≤ several bar
0 ≤ Pi ≤ 6 bar overpressure
2.2 Dusts
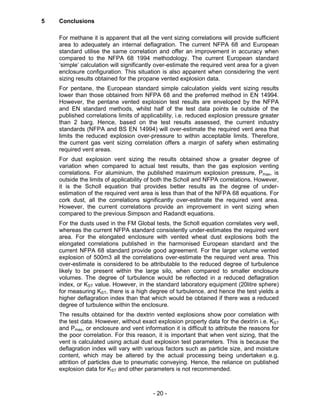
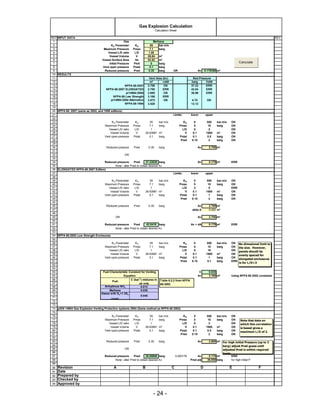
2.2.1 NFPA 68: 1994
The NFPA 68 1994 edition provided two methods for the estimation of dust
explosion vent sizes. The Radandt methodology is based on the use of
nomographs, with equations provided as an alternative. The Radandt method did
not require the use of the dust deflagration index or KST value, (KST = (dP/dt)max
V(1/3)
), but used the St grouping of the dust instead, which is a classification of the
dusts reactivity based on the KST value. The Radandt nomograph equations are:-
For St-1 dusts
Log Av = 0.77957 log V – 0.42945 log Pred – 1.24669
For St-2 dusts
For V= 1 to 10 m³
Log Av = 0.64256 log V – 0.46527 log Pred – 0.99241
For V = 10 to 1000m³
Log Av = 0.74461 log V – 0.50017 log (Pred + 0.18522) – 1.02406
In addition to the Radandt methodology NFPA provided the Simpson nomographs
and an equation developed to reproduce values obtained from their use. The
Simpson equation is:-
Av = a V2/3
KST
b
Pred
c
Where a = 0.000571 e(2 Pstat)
b = 0.978 e (-0.105 Pstat)
c = -0.687 e (0.226 Pstat)
The Radandt method will give different results to those obtained using Simpson's
correlation above. However, for all practical purposes they are sufficiently close. If
the KST value is known, then the Simpson correlation is preferable to Radandt
method.
2.2.2 VDI 3673 Part 1: 1995
The German VDI 3673:1995 [10] standard published the correlation developed by
Scholl for cubic enclosures:-](https://image.slidesharecdn.com/f38505f3-e9e6-4d69-9d1b-a449cf27c03d-160720055402/85/Dust-explosion-sizing-comparison-5-320.jpg)
![- 6 -
[ ][ ] 753.05.0
max,
569.0
max,max
5
1.027.010264.3 VPPPKPxA redstatredST
−−−
−+=
The Scholl equation is valid for:-
Vessel volumes between 0.1m³ and 10000m³
Static opening pressure, Pstat of between 0.1 and 1 barg
Maximum reduced explosion over-pressure of between 0.1 and 2 barg
Maximum explosion over-pressure, Pmax, of between 5 and 10 barg for a dust with a
deflagration index (KST) between 10 bar.m/s and 300 bar.m/s, or a Pmax of 5 to 12
barg for a KST value between 300 bar.m/s and 800 bar.m/s.
For enclosures that were elongated the VDI guideline modified the Scholl equation:-
( )( ) )/log(758.0log305.4 max, DLPAA redL +−=∆
Where the additional vent area is added to that vent area estimated for an
enclosure with an L/D ratio of below 2. The use of this equation results in a step
change in vent area for vessels with an L/D ratio of greater than 2. The above
equations were retained in the 2002 edition of the VDI 3673 guide [11].
2.2.3 NFPA 68:2002
Editions of the NFPA 68 standard after 1994 incorporated the Scholl equation from
the VDI guidelines. However, the NFPA 68 guide ceased to use the Scholl equation
in the 2002 edition, which published a vent sizing equation that removed the vent
sizing step change that was inherent in the use of the Scholl equation for elongated
vessels. The NFPA 68 2002 correlation was:-
( )( )
−
+= −
max
max75.05
1
75.1110535.8
P
P
P
P
VKPxA
red
red
STstatv
For L/D ratios greater than 2 and less than 6 the vent area estimated by the above
equation is increased by adding the incremental vent area estimated by:-
−
−=∆ 1log
11
56.1
65.0
max D
L
PP
AA
red
v
2.2.4 NFPA 68:2007
The latest edition of the NFPA 68, which has now changed from a guide to a
standard, uses the following equation for dust explosion vent sizing:-
154.11101 max4
3
5
4
4
0, −
+= −
red
STstatv
P
P
VKPxA
For enclosures with an L/D ratio greater than 2 and less than 6 the vent area is
again increased by adding an incremental area estimated by:-
( )
−
−+= 2
75.0
01 95.0exp26.01 redvv P
D
L
AA
The limits of the above equation are:-
5 ≤ Pmax ≤ 12 bar
10 bar.m/sec≤ KST ≤ 800 bar.m/sec](https://image.slidesharecdn.com/f38505f3-e9e6-4d69-9d1b-a449cf27c03d-160720055402/85/Dust-explosion-sizing-comparison-6-320.jpg)
![- 7 -
0.1 m³ ≤ V ≤ 10000 m³
Pstat ≤ 0.75 bar
2.2.5 BS EN 14491:2006
The current harmonised European standard EN 14491 retains the use of the Scholl
equation used by the VDI 3673 guidelines [10] and [11].](https://image.slidesharecdn.com/f38505f3-e9e6-4d69-9d1b-a449cf27c03d-160720055402/85/Dust-explosion-sizing-comparison-7-320.jpg)
![- 8 -
3 Experimental data
3.1 Gases
The experimental data for gas explosions have been taken from G A Lunn –
Venting Gas and Dust Explosions – A review [1].
3.1.1 Methane
The table below summarises methane vented explosion experimental results from
Buckland, taken from Table 10 [1]
Table 2: Methane vented explosion test results [1]
Enclosure
Volume
Vent
coefficient Vent area
Vent
opening
pressure
Reduced
explosion
pressure
V K Av Pstat Pred
m3
V^(2/3)/Av m2
barg barg
26.64 8.04 1.11 0.007 0.083
26.64 8.04 1.11 0.004 0.055
26.64 2.00 4.46 0.017 0.066
26.64 2.00 4.46 0.066 0.062
26.64 2.00 4.46 0.057 0.109
26.64 2.00 4.46 0.063 0.05
26.64 4.00 2.23 0.019 0.109
26.64 4.00 2.23 0.076 0.101
26.64 4.00 2.23 0.079 0.102
26.64 2.50 3.57 0.072 0.11
26.64 2.50 3.57 0.039 0.11
26.64 5.01 1.78 0.115 0.219
26.64 5.01 1.78 0.086 0.221
26.64 4.00 2.23 0.017 0.098
26.64 4.00 2.23 0.09 0.066
26.64 4.00 2.23 0.07 0.07
26.64 4.00 2.23 0.075 0.13
3.1.2 Propane
The table below summarises propane explosion data results from Bromma, taken
from Table 8 [1]
Table 3: Propane vented explosion test results [1]
Enclosure
Volume
Vent
coefficient Vent area
Vent opening
pressure
Reduced
explosion
pressure
V K Av Pstat Pred
m3
V^(2/3)/Av m2
barg barg
200 1.11 30.81 0.0549 0.0588
200 1.11 30.81 0.0294 0.0333
200 1.11 30.81 0.0098 0.0181
200 1.11 30.81 0.0289 0.0343
200 1.11 30.81 0.0549 0.0588
200 1.38 24.78 0.049 0.0637
200 1.38 24.78 0.0137 0.0299
200 1.38 24.78 0.0196 0.0295
200 1.38 24.78 0.0196 0.0348
3.1.3 Pentane
The table below summarises pentane vented explosion experimental results from
Harris and Briscoe, taken from Table 4 [1]. Note that the vent opening pressure is 0
barg.](https://image.slidesharecdn.com/f38505f3-e9e6-4d69-9d1b-a449cf27c03d-160720055402/85/Dust-explosion-sizing-comparison-8-320.jpg)
![- 3 -
2 Explosion Vent Sizing
2.1 Gases
2.1.1 NFPA 68 1994 Edition
The 1994 edition of the NFPA 68 standard provided the following equation for the
estimation of explosion vent area for high strength enclosures (i.e. capable of
withstanding greater that 100 mbarg)
d
red
cPb
v PeaVA stat
=
Where V is the vessel volume, m3
e is the base of natural logarithm
Pstat is the vent opening pressure, barg
Pred is the maximum pressure developed during venting within the enclosure, or the
reduced explosion pressure, barg
a, b, and c are constants that are dependant on the fuels reactivity, and are shown
in the table below:
Table 1: Constants for use in explosion vent sizing [3]
a b c d
Methane 0.105 0.770 1.230 -0.823
Propane 0.148 0.703 0.942 -0.671
Hydrogen 0.279 0.680 0.755 -0.393
Coke Gas 0.150 0.695 1.380 -0.707
This equation was developed based on the explosion nomographs that were
published within the standard, with the use of the equation limited to enclosures
having a length to diameter ratio of less than 5. For fuels other than those listed in
the above table if the fundamental burning velocity is less than 60 cm/sec i.e. 1.3
times that of propane, then the propane constants are used. If the fundamental
burning velocity is greater than 60 cm/secs then the hydrogen equation is used.
However, it should be noted that this method is no longer considered appropriate as
it does not take sufficient account of the fuels reactivity, for example hydrogen is ten
times as reactive as methane yet use of the NFPA 68:1994 edition nomographs, on
which the above equation is based, will yield similar results.
2.1.2 NFPA 68: 2007 Edition
Subsequent revisions of the NFPA 68 standard used correlations based on VDI
guidelines [10] and [11], which also remains unaltered in the latest 2007 edition of
the standard.
For explosion vent sizing of enclosures having a length to diameter ratio of less
than 2, the vent size can be estimated from the equation:-
( ) ( ) ( )[ ]{ } ( ) ( )[ ] 3
2
572.03
2
582.0
10 1.0175.00567.0log127.0 VPPVPKA statredredGv −+−= −−
Where KG is the gas deflagration index, = (dP/dt)max V(1/3)](https://image.slidesharecdn.com/f38505f3-e9e6-4d69-9d1b-a449cf27c03d-160720055402/85/Dust-explosion-sizing-comparison-9-320.jpg)
![- 10 -
3.3 Factory Mutual Standard 7-76
The Factory Mutual Global standard 7-76 includes the paper published by Tamanini
and Valiulis [2], and includes the experimental test results from a 10m³ vessel
containing powders with a deflagration index, KST, of 190 bar.m/s and 290 bar.m/s.
The vent opening pressure was 0.2 barg. The test results are detailed below:-
Table 6: FM Global vented explosion test results [2]
Enclosure
Volume Vent coefficient Vent area
Vent opening
pressure
Reduced
explosion
pressure
Deflagration
index
V K Av Pstat Pred KST
m
3
V^(2/3)/Av m
2
barg barg bar.m/s
10 7.25 0.64 0.2 0.45 190
12.21 0.38 0.2 1.4 190
16.58 0.28 0.2 2.1 190
12.21 0.38 1.86 3 190
7.25 0.64 0.2 0.75 290
12.21 0.38 0.2 2.2 290
16.58 0.28 0.2 3.6 290
7.25 0.64 1.4 1.65 290
7.25 0.64 2.5 3 290
3.3.1 Wheat dust
The table below summarises the wheat dust vented explosion results from vented
explosions within a 500m³ silo at Boge, Norway, and are taken from Figure 49 [1].
Additional data for vented wheat dust explosions within a 20m³ elongated silo (L/D
ratio of 6.25) obtained by Radandt, were taken from Figure 50 [1].
Table 7: Wheat grain dust vented explosion test results [1]
Enclosure
Volume
Vent
coefficient Vent area
Reduced
explosion
pressure
V K Av Pred
m
3
V^(2/3)/Av m
2
barg
500 7.87 8 0.025
7.87 8 0.03
7.87 8 0.05
7.87 8 0.06
7.87 8 0.12
4.44 14.2 0.015
4.44 14.2 0.03
12.60 5 0.3
31.50 2 0.4
20 4.91 1.5 0.3
6.41 1.15 0.4
9.82 0.75 0.7
14.74 0.5 1.1
24.56 0.3 1.8
36.84 0.2 1.9
3.3.2 Dextrin
The table below summarises the dextrin dust vented explosion results from Donat,
Figure 40 [1].](https://image.slidesharecdn.com/f38505f3-e9e6-4d69-9d1b-a449cf27c03d-160720055402/85/Dust-explosion-sizing-comparison-10-320.jpg)
![- 11 -
Table 8: Dextrin vented explosion test results [1]
Enclosure
Volume
Vent
coefficient Vent area
Reduced
explosion
pressure
V K Av Pred
m
3
V^(2/3)/Av m
2
barg
30 2.54 3.8 0.1
3.22 3 0.15
4.83 2 0.3
6.44 1.5 0.5
9.65 1 1
12.87 0.75 1.3
19.31 0.5 2
32.18 0.3 2.8
1 2.50 0.4 0.1
3.33 0.3 0.15
5.00 0.2 0.3
6.67 0.15 0.4
10.00 0.1 0.6
2.00 0.5 1.1
3.33 0.3 2](https://image.slidesharecdn.com/f38505f3-e9e6-4d69-9d1b-a449cf27c03d-160720055402/85/Dust-explosion-sizing-comparison-11-320.jpg)
![- 12 -
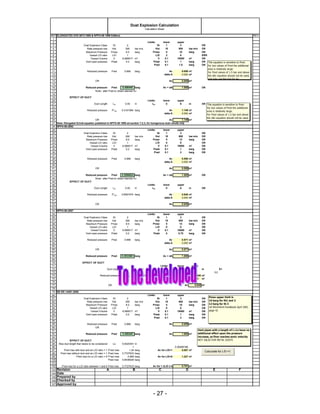
4 Comparison of experimental results with vent sizing correlations
A spreadsheet was used to calculate and compare the results obtained for the
reduced explosion pressures predicted by the various vent sizing correlation. An
example output from the spreadsheet is shown in Appendix A.
4.1 Gases
4.1.1 NFPA 68:1994 Calculation:-
For methane and propane, the constants used in the correlation are listed within the
standard. For Pentane, table C.1 of the NFPA 68:1994 [3] edition gives the
fundamental burning velocity of pentane as 46 cm/s, which is the same as the
burning velocity for propane, based on the NFPA 68 quoted data. Therefore, for
pentane the vent sizing calculation used the propane constants.
4.1.2 NFPA 68:2007 Calculation:-
To enable vent sizing using this standard it is necessary to know the deflagration
index, KG, the vent opening pressure, and the length to diameter ratio. The values
for the deflagration index, KG, where obtained from the NFPA 68 Standard 2007
edition table E.1 [6] and are 55, 100, and 104 bar.m/sec for methane, propane, and
pentane respectively. For the purpose of the calculation it is assumed that the vent
opening pressure is 0.1 barg and that the enclosure has a length to diameter ratio
of less than 2. It should be noted that for methane and propane the majority of the
test results were obtained using a vent panel that opened at pressures less than 0.1
barg, and the L/D ratio was not stated. For pentane, the vent panel had a negligible
opening pressure.
4.1.3 BS EN 14994:2006 Calculation:-
The alternative simple vent sizing method detailed in the above standard requires
knowledge of various thermodynamic, and combustion properties of the fuels. This
information was obtained from table A.1 of the above standard [8], and is detailed
below:-
Table 9:- Thermodynamic data and burning velocity for some fuel-air mixtures [8]
Ratio of
specific heats,
γu
Expansion
ratio of
combustion
products, Ei
Speed of
sound at initial
conditions, cui,
m/s
Fundamental
burning
velocity, Sui,
cm/s
Methane 1.39 7.52 353 43
Propane 1.37 7.98 339 45
Pentane 1.36 8.07 335 43](https://image.slidesharecdn.com/f38505f3-e9e6-4d69-9d1b-a449cf27c03d-160720055402/85/Dust-explosion-sizing-comparison-12-320.jpg)
![- 13 -
4.2 Dusts
To enable use of the dust explosion vent sizing correlations the following data was
used:-
Table 10: Explosion data for selected combustible dusts [2], [6], and [7]
Deflagration index, KST,
bar.m/sec
Maximum explosion
pressure, Pmax, barg
Aluminium 415 12.4
Cork dust 202 9.6
FM Global dust 1 190 8.5
FM Global dust 2 290 8.5
Wheat dust 112 9.3
Dextrin 106 8.8
The above data was taken from the NFPA 68: 2007 edition Tables E.1 (a) to (e) [6],
with the exception of the data from the Factory Mutual Global tests, which were
taken from Tamanini and Valiulis [2], and wheat grain dust data which is taken from
Table A.1 R K Eckhoff Dust explosions in the process industries, 2nd
Edition [7].
Data for the deflagration index and maximum explosion pressure is also available in
the G A Lunn Venting Gas and Explosions – A review [1]. However, this data was
not used as it was obtained on the Hartmann apparatus, which will not yield similar
results to explosion data obtained from the 20 litre sphere or 1m³ iso standard test
vessel. The published explosion correlations are based on data not obtained from
the Hartmann apparatus, and hence values published by Lunn [1] have not been
used.
For the purpose of this report all vent opening pressures, Pstat, were assumed to be
0.1 barg, and the length to diameter ratio is assumed to be less than 2, with the
exception of the wheat dust 20m³ enclosure comparison.
4.3 Results
The graphs below show the experimental test results for the reduced explosion
pressure within particular test equipment equipped with a defined vent area. In
addition, the graphs show the results of the various vent sizing correlations, using
information related to the enclosure, and data either obtained from referenced texts
or assumed as detailed above.](https://image.slidesharecdn.com/f38505f3-e9e6-4d69-9d1b-a449cf27c03d-160720055402/85/Dust-explosion-sizing-comparison-13-320.jpg)


![- 4 -
(dP/dt)max is the maximum rate of pressure rise obtained from standardised
experimental test equipment, bar/s
For enclosures having length to diameter ratios between 2 and 5 an additional vent
area should be added to the vent area estimated from the above equation.
750
2
2
−
=∆
D
L
KA
A
Gv
The limits of applicability for the above method are:-
KG ≤ 550 bar.m/sec
Pred ≤ 2 bar and at least 0.05 bar > Pstat
Pstat ≤ 0.5 bar
V ≤ 1000 m³
2.1.3 BS EN 14994:2006
The harmonised European norm standard EN 14994 also utilises the VDI
correlation
( ) ( ) ( )[ ]{ } ( ) ( )[ ] 3
2
5722.03
2
5817.0
10 1.01754.00567.0log1265.0 VPPVPKA statredredGv −+−= −−
However, this standard also provides an alternative simple vent sizing method,
which is based on the turbulent Bradley number:-
( ) ( )
( ) ( )
25.0
5.25.2
5.2
5.25.2
8.59.7:1if
65.5:1if
t
i
istat
i
red
i
istat
i
red
t
i
istat
i
red
i
istat
i
red
Br
P
PP
P
P
P
PP
P
P
Br
P
PP
P
P
P
PP
P
P
−=
+
≥
+
=
+
<
+
−
The turbulent Bradley number is subsequently used to solve the following equation:-
Where cui is the speed of sound at initial conditions of explosion, m/s
Ei is the expansion ratio of the combustion products
A is the vent area, m²
Pi is the initial enclosure pressure, bar
Sui is the burning velocity at the initial conditions, m/s
β is an empirical constant = 0.5 for hydrocarbons, and 0.8 for hydrogen](https://image.slidesharecdn.com/f38505f3-e9e6-4d69-9d1b-a449cf27c03d-160720055402/85/Dust-explosion-sizing-comparison-16-320.jpg)


![[오픈소스컨설팅]Day #1 MySQL 엔진소개, 튜닝, 백업 및 복구, 업그레이드방법](https://cdn.slidesharecdn.com/ss_thumbnails/day1mysqlintroduction-141212003401-conversion-gate02-thumbnail.jpg?width=640&height=640&fit=bounds)