Drug utilization research studies the use of drugs in populations and aims to support rational drug use. It is closely related to pharmacoepidemiology, which applies epidemiological methods to study drug use. Together they provide insights into patterns of drug use, quality of use, and determinants of use. The ultimate goal is to assess rationality of drug therapy and facilitate improved health outcomes.


![Chapter 1: What is drug utilization research
and why is it needed?
1.1. Definition and domains not. Sophisticated utilization-oriented pharma-
coepidemiology may focus on the drug (e.g.
Drug utilization; pharmacoepidemiology; dose-effect and concentration-effect relationships),
[ pharmacosurveillance; pharmacovigilance ] the prescriber (e.g. quality indices of the prescrip-
tion), or the patient (e.g. selection of drug and
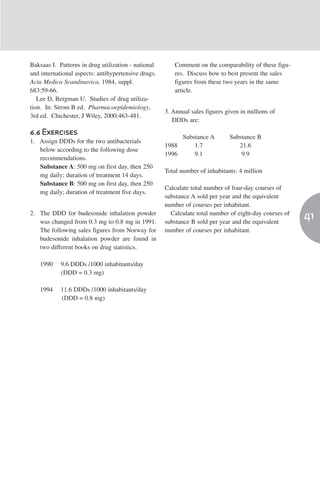
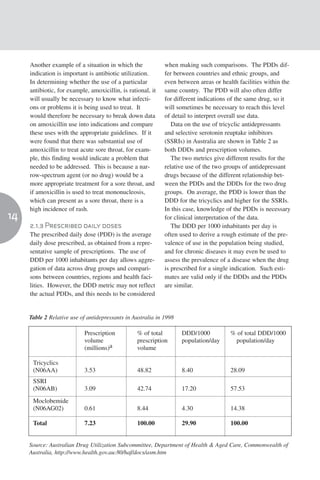
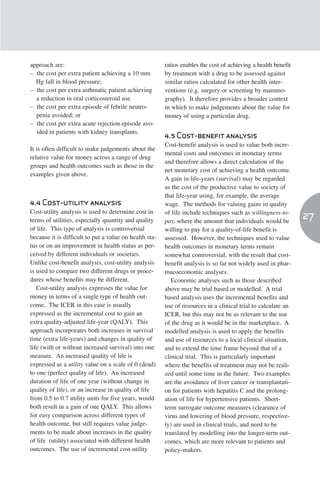
• Drug utilization research was defined by dose, and comparisons of kidney function, drug
WHO in 1977 as «the marketing, distribution, metabolic phenotype/genotype, age, etc.).
prescription, and use of drugs in a society, with Drug utilization research is thus an essential
special emphasis on the resulting medical, social part of pharmacoepidemiology as it describes the
and economic consequences». Since then, a extent, nature and determinants of drug exposure.
number of other terms have come into use and it Over time, the distinction between these two
is important to understand the interrelationships terms has become less sharp, and they are some-
of the different domains. times used interchangeably. However, while
• Epidemiology has been defined as «the study drug utilization studies often employ various
of the distribution and determinants of health- sources of information that focus on drugs (e.g.
related states and events in the population, and aggregate data from wholesale and prescription
the application of this study to control of health registers) the term epidemiology implies defined
problems». populations in which drug use can be expressed
8 • Pharmacoepidemiology applies epidemiologi- in terms of incidence and prevalence (see
cal methods to studies of the clinical use of chapter 1.2.1).
drugs in populations. A modern definition of Together, drug utilization research and pharma-
pharmacoepidemiology is: «the study of the use coepidemiology may provide insights into the fol-
and effects/side-effects of drugs in large numbers lowing aspects of drug use and drug prescribing.
of people with the purpose of supporting the
rational and cost-effective use of drugs in the • Pattern of use: This covers the extent and pro-
population thereby improving health outcomes». files of drug use and the trends in drug use and
• Pharmacosurveillance and pharmacovigi- costs over time.
lance are terms used to refer to the monitoring • Quality of use: This is determined using audits
of drug safety, for example, by means of spon- to compare actual use to national prescription
taneous adverse-effect reporting systems, case- guidelines or local drug formularies.1 Indices of
control and cohort studies. quality of drug use may include the choice of
drug (compliance with recommended assort-
Pharmacoepidemiology may be drug-oriented, ment), drug cost (compliance with budgetary
emphasizing the safety and effectiveness of indi- recommendations), drug dosage (awareness of
vidual drugs or groups of drugs, or utilization- inter-individual variations in dose requirements
oriented aiming to improve the quality of drug and age-dependence), awareness of drug inter-
therapy through pedagogic (educational) inter- actions and adverse drug reactions, and the pro-
vention. Drug utilization research may also be portion of patients who are aware of or unaware
divided into descriptive and analytical studies. of the costs and benefits of the treatment.
The emphasis of the former has been to describe • Determinants of use: These include user cha-
patterns of drug utilization and to identify pro- racteristics (e.g. sociodemographic parameters
blems deserving more detailed studies. and attitudes towards drugs), prescriber characte-
Analytical studies try to link data on drug utili- ristics (e.g. speciality, education and factors
zation to figures on morbidity, outcome of treat- influencing therapeutic decisions) and drug cha-
ment and quality of care with the ultimate goal racteristics (e.g. therapeutic properties and affor-
of assessing whether drug therapy is rational or dability).
1 An audit in drug use was defined by Crooks (1979) as an examination of the way in which drugs are used in clinical practice carried out at intervals
frequent enough to maintain a generally accepted standard of prescribing.](https://image.slidesharecdn.com/due-110310040029-phpapp01/85/Due-9-320.jpg)
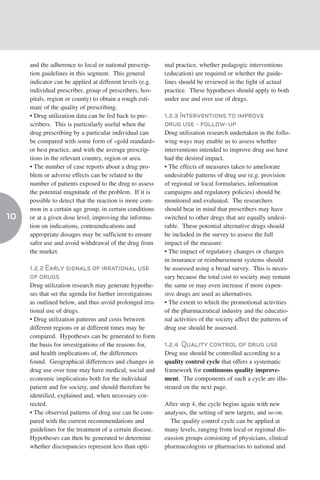
![2.2 Problem or encounter-based sistent. This consistency between data using two
information different approaches (i.e. drug and problem-
based) gives confidence in the result.
Reason for the encounter (the problem); Other questions that might be addressed using
drug treatment versus non-drug treatment; a problem-based approach include the following:
other problems managed; severity of the pro-
blem managed; new or continuing presenta- • Does the severity of hypertension influence the
tion; duration of consultation; medications choice of single or combination therapy?
prescribed for the problem; how the medica- • Is the management of newly-presenting pati-
tions were supplied; other medications pre- ents different to that of patients already receiving
scribed treatment?
• Are there likely to be any drug interactions
with co-prescribed treatments?
Rather than asking how a particular group of
• Is the choice of drug influenced by evidence-
drugs is used, it may be useful to address the
based outcome data?
question of how a particular problem (e.g. sore
throat, hypertension or gastric ulcer) is managed.
For some diseases it may be important to study
The different types of information that may be
the relative use of drug treatment and other the-
required are listed in the box above.
As an example, consider how problem-based
rapeutic approaches to map out and understand 15
pharmacotherapeutic traditions and other thera-
information about the management of hyperten-
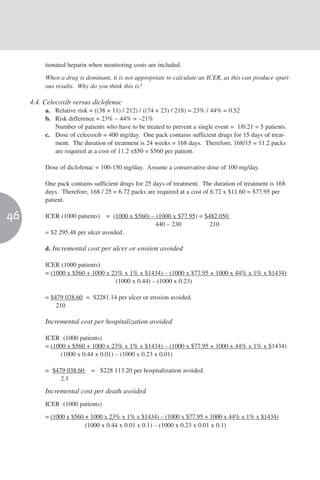
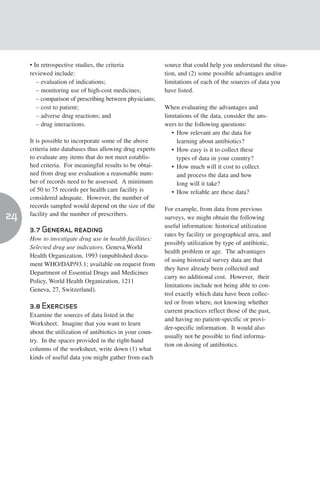
peutic approaches. As an example, drug utiliza-
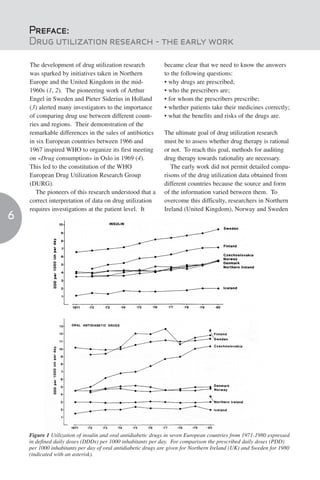
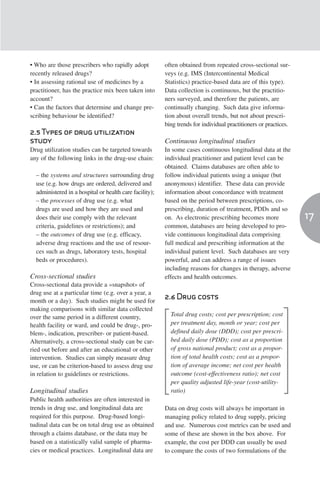
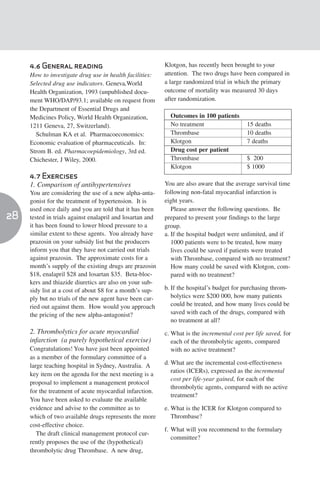
sion might be used. Initially, concordance with
tion research in Estonia has shown that there was
guidelines for drug treatment or non-drug mana-
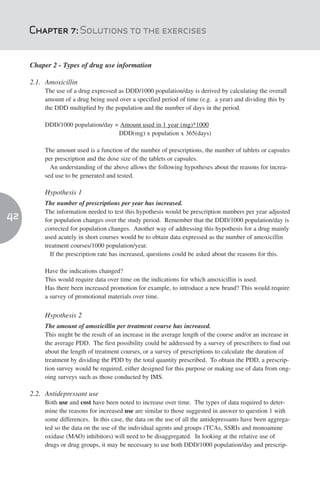
a reciprocal relationship between the use of hor-
gement of blood pressure and other risk factors
monal contraceptives and the abortion rate
might be assessed. Where drug treatment is
from1989-1997 (Fig. 2).
used, the proportion of patients treated with each
of the drug groups gives an overall picture of
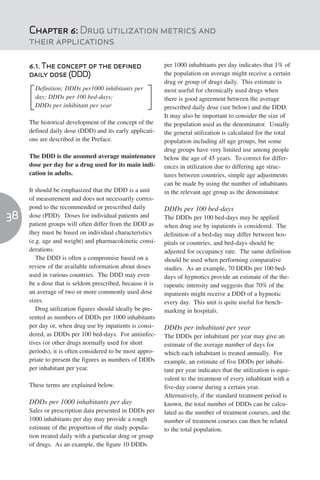
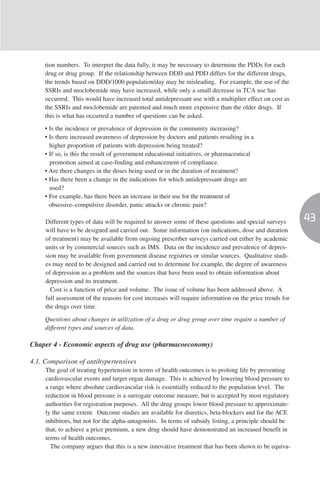
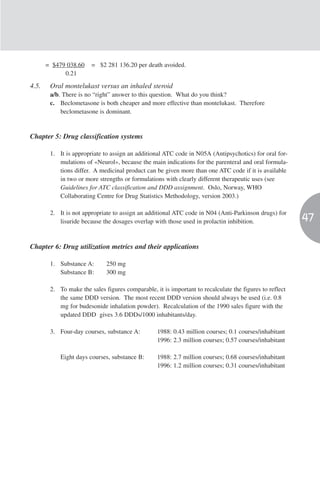
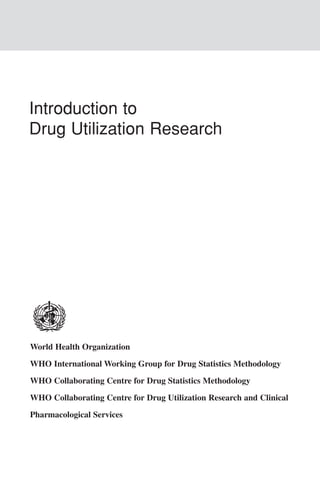
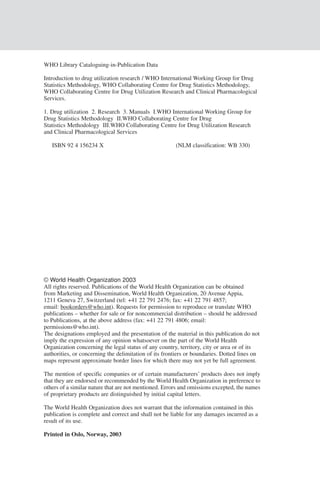
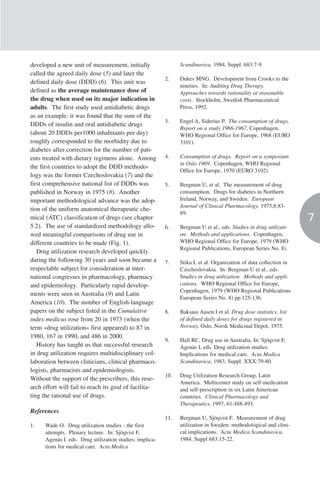
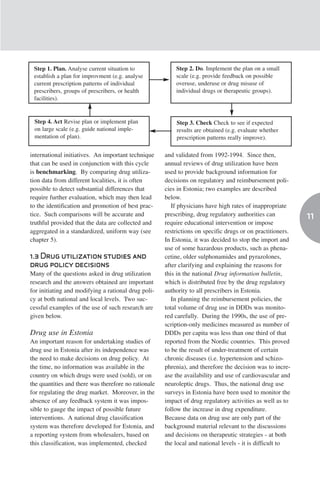
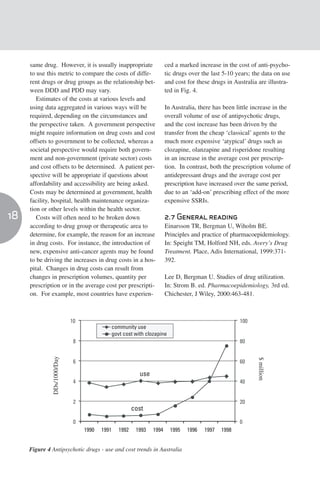
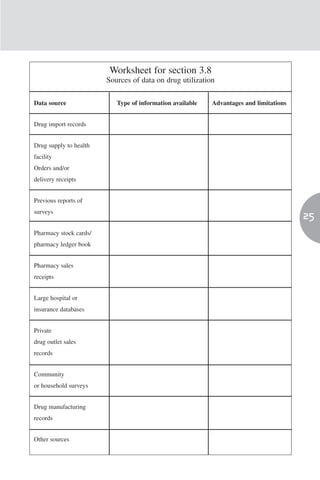
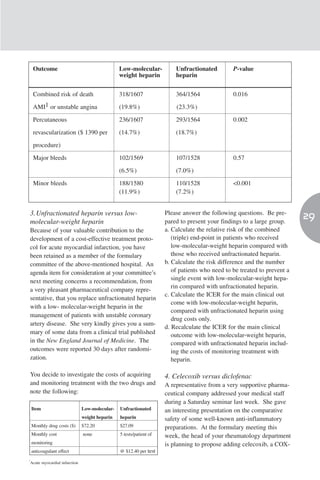
Another example was the excessive use of ulcer
management (column C of Table 1). This is
surgery in Estonia compared to Sweden during
more direct information on how hypertension is
the Soviet era. This was because of the difficul-
managed than that provided by assessing the
ties of obtaining modern anti-ulcer drugs in
overall use of the different drug groups as dis-
Estonia at that time (Fig. 3).
cussed above. In the example shown in Table 1,
the data in columns B and C are reasonably con-
(per 10 000 population
Use of hormonal
Nr of abortions
contraceptives
(DDD/1000/day
Figure 2 Abortion rate and use of hormonal contraceptives in Estonia in 1989-1997.
Source: Kiivet R. Drug utilization studies as support to decisions in drug policy in Estonia. [MD Thesis]
Stockholm, Karolinska Institutet, 1999.](https://image.slidesharecdn.com/due-110310040029-phpapp01/85/Due-16-320.jpg)
![80 20
60 16
12
40
8
20 4
0 0
1993 1995
anti-ulcer drugs, Estonia surgery, Estonia
anti-ulcer drugs, Stockholm surgery, Stockholm
Figure 3 Treatment of ulcer disease in Estonia and in Stockholm County 1993-1995.
Source: Kiivet R. Drug utilization studies as support to decisions in drug policy in Estonia.
[MD Thesis] Stockholm, Karolinska Institutet, 1999.
2.3 Patient information 2.4 Prescriber information
Age; gender; ethnicity; co-morbidities; Demographic information - age, gender,
16 [ knowledge; beliefs and perceptions ] medical school, years in practice; type of
practice (e.g. specialist or family, rural or
Information on demographic factors and other urban); practice size; patient mix; knowledge
details about the patient will often be useful. about drugs; factors driving prescribing
For example, the age distribution of patients may behaviour
be of critical importance, to assess the likelihood
of severe adverse effects with nonsteroidal anti- The prescriber plays a critical role in determi-
inflammatory drugs (NSAIDs), or whether the ning drug use. Claims have even been made that
drug is being used to treat patients in an age the differences between doctors are greater than
group different from that in which the clinical those between patients and that variations in
trials were performed. The co-morbidities of the drug prescribing behaviour often lack rational
patient group may be important in determining explanations. Dissecting the factors that deter-
the choice of treatment and predicting possible mine prescribing behaviour is therefore often
adverse effects. For instance, in the manage- central to understanding how and why drugs are
ment of hypertension, beta-blockers should not prescribed. Some questions that might be
be used to treat patients with asthma, and ACE addressed using prescriber information include
inhibitors are the preferred treatment in patients the following:
with heart failure. • Are prescribing profiles influenced by the
Qualitative information relating to the know- prescriber’s medical education?
ledge, beliefs and perceptions of patients and • Do the prescribing profiles of specialists differ
their attitudes to drugs will be important in some from those of family practitioners?
cases, for example in assessing the pressures put • Does the age or gender of the prescriber influ-
by patients on their doctors to prescribe antibio- ence the prescribing profile?
tics, or in designing consumer information and • Are there differences in prescribing behaviour
education programmes. between urban and rural practices or between
small and large practices? Do these variations
indicate a need to target education to particular
sectors?](https://image.slidesharecdn.com/due-110310040029-phpapp01/85/Due-17-320.jpg)
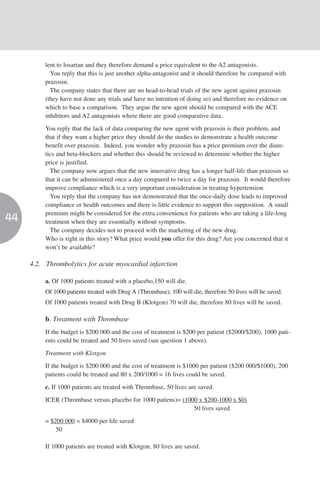
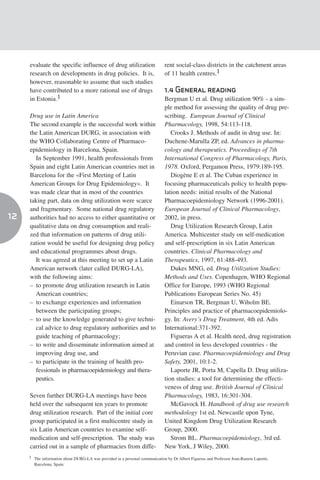
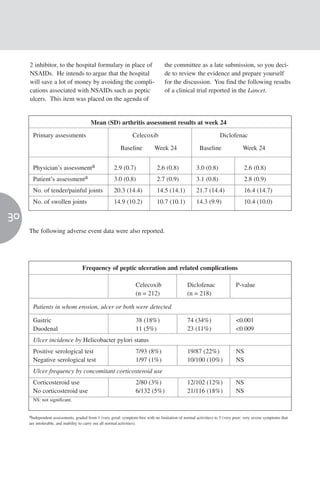
![Chapter 3: Sources of data on drug utilization
Drug-use chain; large databases; other sour- drug distribution chain, pharmaceutical and
[ ces; drug use evaluation; pharmacoeconomics ] medical billing or samples of prescriptions. The
databases may be international, national or local
The drug-use chain includes the processes of in scope. They may be diagnosis-linked or non-
drug acquisition, storage, distribution, prescri- diagnosis-linked. Diagnosis-linked data enable
bing, patient compliance and the review of out- drug use to be analysed according to patient cha-
come of treatment. Each of these events is an racteristics, therapeutic groups, diseases or con-
important aspect of drug utilization, and most ditions and, in the best of cases, clinical out-
countries have regulations to cover these aspects. come. A useful analysis requires an understand-
Data are collected, or are available, at national, ing of the sources and organization of the data.
regional and local health facility or household
level and may be derived from quantitative or 3.2 Data from drug regulatory
qualitative studies. Quantitative data may be agencies
used to describe the present situation and the
Drug registration; drug importation
trends in drug prescribing and drug use at vari- [ ]
ous levels of the health care system.
Drug regulatory agencies have the legal respon-
Quantitative data may be routinely collected data
sibility of ensuring the availability of safe, effi-
or obtained from surveys. Qualitative studies
20 assess the appropriateness of drug utilization and
cacious and good-quality drugs in their country.
They are thus the repositories of data on which
generally link prescribing data to reasons (indi-
drugs have been registered for use, withdrawn or
cations) for prescribing. Such studies have been
banned within a country. Regulatory agencies
referred to as «drug utilization review» or «drug
also have inspection and enforcement functions,
utilization evaluation». The process is one of a
and are responsible for supervising the importa-
«therapeutic audit» based on defined criteria and
tion of drugs and for the issuance of permits for
is intended to improve the quality of therapeutic
drug registration.
care. There is an increasing interest in the evalu-
It is possible, therefore, to obtain data on the
ation of the economic impact of clinical care and
number of drugs registered in a country from
medical technology. This has evolved into a dis-
such agencies. Where the agency issues import
cipline dedicated to the study of how pharma-
permits and supervises drug importation, data on
cotherapeutic methods influence resource utili-
product type (i.e. generic or branded), volume,
zation in health care known as pharmacoeco-
port of origin, country of manufacture, batch
nomics (see chapter 4).
number and expiry date may be collected.
The sources of drug utilization data vary from
Where the data reflect total national imports,
country to country depending on the level of
estimates of quantities of drugs in circulation
sophistication of record keeping, data collection,
can be obtained for defined periods and for
analysis and reporting and the operational consi-
various therapeutic groups
derations of the health care system.
It may be difficult to obtain true estimates if
documentation is incomplete and not all trans-
3.1 Large databases
actions are recorded. Information on smuggled
The increasing interest in efficient use of health
goods or goods entering the country through ille-
care resources has resulted in the establishment
gal routes will not be captured by these data.
of computer databases for studies on drug utili-
zation. Some of the databases can generate sta-
tistics for patterns of drug utilization and adverse
3.3 Supplier (distribution) data
drug reactions. Data may be collected on drug Drug importation; local manufacture; cus-
sales, drug movement at various levels of the [ toms service ]](https://image.slidesharecdn.com/due-110310040029-phpapp01/85/Due-21-320.jpg)
![Data on suppliers may be obtained from drug motivate health care providers to adhere to esta-
importers, wholesalers or local manufacturers. blished health care standards.
In countries where permits or licences are
required from drug regulatory authorities and 3.4.1 Prescribing data
ministries of health before importation of drugs, Prescribing data are usually extracted from out-
data may be available from such sources. patient and inpatient prescription forms. Such
Customs services, in the process of clearing data may be easily retrieved where records are
imports from the ports of entry, may collect data computerized and computerized data also facili-
on drugs. However, the codes used by customs tate trend analysis. In the absence of electronic
services are not detailed enough to capture all databases, prescribing data are usually extracted
relevant information. National agencies respon- from patient records or from patient intercept
sible for the collection of excise duty can also studies or retrieved at dispensing points.
provide information on the volume of production Information that may be obtained from pre-
and on distribution of drugs from local manufac- scriptions includes patient demography, drug
turers. name, dosage form, strength, dose, frequency of
Data from these sources can generally be used administration and duration of treatment. Where
to describe total quantities of specific drugs or diagnoses are noted on prescriptions, and parti-
drug groups, origins of supplies and type (i.e. cularly for inpatient prescription, it is possible to
branded or generic). link drug use to indications. Trends in utilization 21
In the absence of a national mechanism for the for specific drugs and diseases can also be esta-
direct capture of data on drug production or blished. As an example, inpatient data may pro-
importation, wholesalers become an important vide a link to empirical treatment of infections as
source of information on drug acquisition. Such opposed to treatment based on microbiological
data are reliable insofar as wholesalers are the assessment. This may be achieved by extracting
only legal entity able to import drugs. In some relevant data from the patient records, but requi-
countries, medical, dental and veterinary practiti- res that the records be of good quality.
oners, as well as pharmacists, can import phar- Prescriptions are a good source of information
maceutical products. It is usually very difficult for determining some of the indicators of drug
to collect comprehensive data from such sources use recommended by WHO including the:
even if there are regulatory requirements about
submitting reports. Public sector procurement – average number of drugs per prescription
practices, however, have reasonable documen- (encounter);
tation but provide data only on that sector. – percentage of drugs prescribed by generic
name;
Practice setting data – percentage of encounters resulting in prescrip-
tion of an antibiotic;
Prescribing data; dispensing data; drug use – percentage of encounters resulting in prescrip-
[ indicators; facility data (aggregate) ] tion of an injection;
– percentage of drugs prescribed from essential
Data from health facilities may be used to evalu- drugs list or formulary, and
ate specific aspects of health provision and drug – average drug cost per encounter.
use and to generate indicators that provide infor-
Prescribing data allow the determination of the
mation on prescribing habits and aspects of pati-
PDD which may differ from the DDD. While
ent care. These indicators can be used to deter-
the DDD is based on the dosages approved in
mine where drug use problems exist, provide a
standard product characteristics with clinical out-
mechanism for monitoring and supervision and
come data from controlled clinical trials, the](https://image.slidesharecdn.com/due-110310040029-phpapp01/85/Due-22-320.jpg)
![3.5 Community setting data Drug use evaluation can assess the actual pro-
cess of administration or dispensing of a medica-
Household survey; compliance (adherence tion (including appropriate indications, drug
[ to treatment); drug utilization ] selection, dose, route of administration, duration
of treatment and drug interactions) and also the
The drugs available in households have either outcomes of treatment (e.g. cured disease condi-
been prescribed or dispensed at health facilities, tions or decreased levels of a clinical parameter).
purchased at a pharmacy (with or without a pre- The objectives of drug use evaluation include:
scription) or are over-the-counter medications.
The drugs may be for the treatment of a current – ensuring that drug therapy meets current stan--
illness or are left over from a previous illness. It dards of care
is not uncommon for patients to adhere poorly to – controlling drug cost;
the instructions given for taking their dispensed – preventing problems related to medication;
medicines. Thus dispensing data and utilization – evaluating the effectiveness of drug therapy; and
data may not be equivalent because they have – identification of areas of practice that require
not been corrected for non-compliance. further education of practitioners.
Drug utilization by outpatients is best assessed
by performing household surveys, counting left- The problems to be addressed by drug use evalu-
ation may be identified from any of the data des-
over pills or using special devices that allow
cribed in section 3.4 (including prescription indi-
23
electronic counting of the number of times a par-
ticular drug is administered. Drug utilization by cators, dispensing data and aggregate data). The
inpatients can be determined by reviewing treat- main source of data for drug use evaluation is
ment sheets or orders. the patient records. An identifiable authoritative
For both outpatients and inpatients, the data group, such as the drugs and therapeutic com-
on the utilization of a particular drug can be mittee, usually carries out reviews of drug use in
aggregated for a defined population in DDDs. a hospital or health facility. This group has the
Using DDDs has the advantage of allowing com- responsibility for drawing up the guidelines, cri-
parison for example between inpatients and out- teria, indicators and thresholds for the evaluati-
patients. Data on various dosage forms and on. Drug use evaluation may be based on data
generic equivalents of the same medication can collected prospectively (as the drug is being dis-
also be aggregated. pensed or administered) or retrospectively (based
on chart reviews or other data sources).
3.6 Drug use evaluation
• Typical criteria reviewed in prospective studies
Drugs and therapeutic committee; prospec- include the following
tive evaluation; retrospective evaluation; – indications;
criteria setting – drug selection;
– doses prescribed;
Drug use evaluation, sometimes referred to as – dosage form and route of administration;
drug utilization review, is a system of continu- – duration of therapy;
ous, systematic, criteria-based drug evaluation – costs;
that ensures the appropriate use of drugs. It is a – therapeutic duplication;
method of obtaining information to identify pro- – quantity dispensed;
blems related to drug use and if properly develo- – contraindications;
ped, it also provides a means of correcting the – therapeutic outcome
problem and thereby contributes to rational drug – adverse drug reactions; and
therapy. – drug interactions.](https://image.slidesharecdn.com/due-110310040029-phpapp01/85/Due-24-320.jpg)
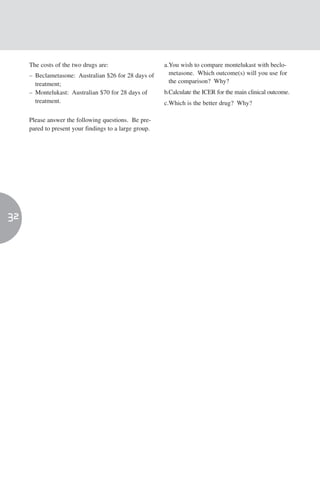
![From your research you also know that: c. Calculate the ICER for the main clinical out-
• One per cent of patients with endoscopic come with celecoxib, compared with the
damage are hospitalized with gastrointestinal NSAID, using drug costs only.
bleeding. d. Recalculate the ICER for the main clinical
outcome with celecoxib, compared with the
• The cost of hospitalization for gastrointestinal NSAID, including the costs of treatment of
bleeding is $1434/patient. gastrointestinal bleeding.
• Ten per cent of patients admitted with gastroin-
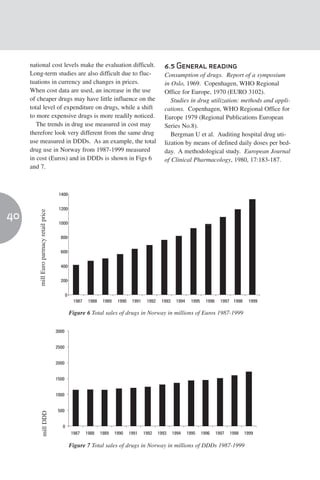
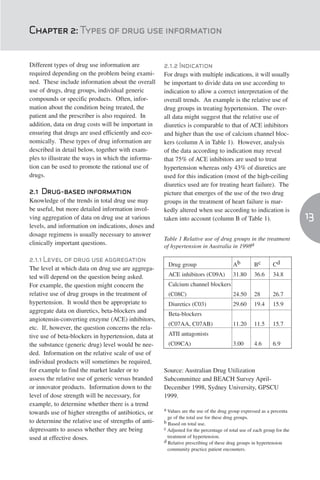
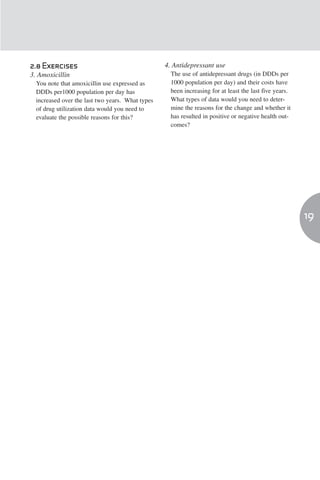
testinal bleeding die. 5. Oral montelukast versus an inhaled
• The cost of celecoxib for 60 x 100 mg tablets steroid
is $50. A community-driven asthma awareness group
has donated 10 cartons of montelukast tablets for
• The usual dose of celecoxib is 200 mg bd.
adults treated in your hospital’s asthma clinic.
• The cost of diclofenac is $11.60 for 50 x 50 They feel strongly that this product should be
mg tablets; $14.35 for 100 x 25 mg tablets. made available since, according to the medical
• The usual dose of diclofenac is 50 mg-75 mg bd. adviser of the sponsoring company, it is much
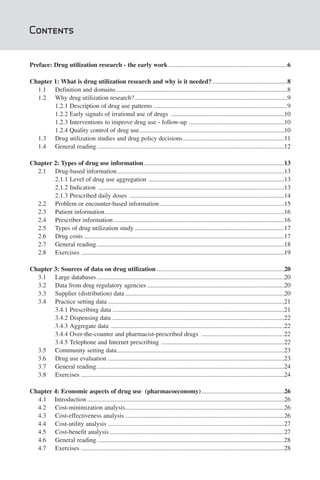
• Answer the following questions. Be prepared more effective and much easier to use than the
to present your findings to a large group. usual «puffers». As this product is fairly new,
the formulary committee has been asked to 31
a.Calculate the relative risk for peptic (i.e. gas- comment on its effectiveness. Since the asthma
tric or duodenal) ulcers in the patients who unit will prepare a submission for including it in
received celecoxib compared with those who the hospital formulary after the supply of dona-
received the NSAID diclofenac. ted drugs is exhausted, you have been asked to
b.Calculate the risk difference and the number comment on the comparative cost-effectiveness
of patients who have to be treated to prevent a of the drug. You begin your assessment by con-
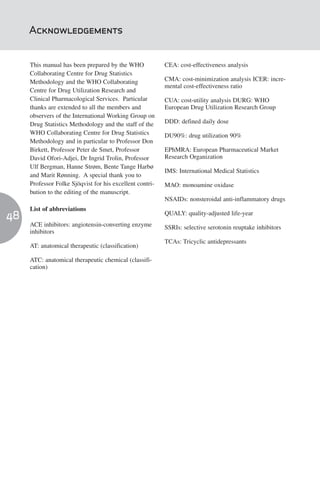
single event with celecoxib, as compared with sidering the following results at 22 weeks after
the NSAID. the baseline assessment.
End-point Placebo Beclometasone Montelukast
Percentage change *FEV1 0.7 [–2.3, 3.7] 13.1 [10.1, 16.2] 7.4 [4.6, 10.1]
Change in daytime
asthma symptom score –0.17 [–0.3, –0.05] –0.62 [–0.75, 0.49] –0.41 [–5.3, –0.29]
Percentage change in total daily
β-agonist use 0.0 [–8.3, 8.3] –40.0 [–48.5, –31.5] –23.9 [–31.4, –16.5]
Change in morning PEFR [l/min] 0.8 [–7.1, 8.6] 39.1 [31.0, 47.1] 23.8 [16.6, 30.9]
Change in evening PEFR [l/min] 0.3 [–7.3, 8.0] 32.1 [24.2, 39.9] 20.8 [13.8, 27.8]
Change in nocturnal awakenings –0.5 [–0.9, –0.1] –2.4 [–2.8, –2.0] –1.7 [–2.07, 1.3]
[nights per week]
Change in eosinophil count
[cells x 103/µl] –0.02 [–0.07, 0.03] –0.07 [–0.12, –0.02] –0.08 [–0.12, –0.03]
Percentage of patients with
asthma attacks 27.3 10.1 15.6
Values are mean [95% CI]. *FEV1 = forced expiratory volume in one second; PEFR = peak expiratory flow rate](https://image.slidesharecdn.com/due-110310040029-phpapp01/85/Due-32-320.jpg)
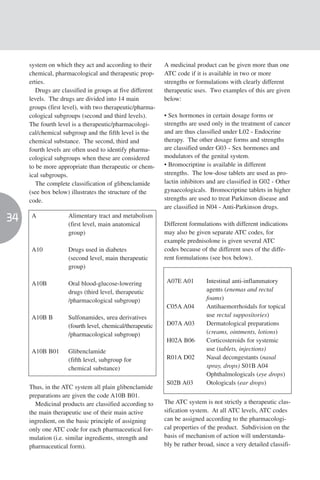
![Chapter 5: Drug classification systems
A drug classification system represents a com- were originally based on the same main princi-
mon language for describing the drug assortment ples. In the EPhMRA system, drugs are classi-
in a country or region and is a prerequisite for fied in groups at three or four different levels.
national and international comparisons of drug The ATC classification system modifies and
utilization data, which have to be collected and extends the EPhMRA system to include a thera-
aggregated in a uniform way. Access to stan- peutic/pharmacological/chemical subgroup as
dardized and validated information on drug use the fourth level and the chemical substance as
is essential to allow audits of patterns of drug the fifth level (see, for example, the classifi-
utilization, to identify problems in drug use, to cation of glibenclamide in the box below).
initiate educational or other interventions and to
monitor the outcomes of these interventions. The ATC classification is also the basis for the
The main purpose of having an international classification of adverse drug reactions used by
standard is to be able to compare data between the WHO Collaborating Centre for International
countries. A recent example is the international Drug Monitoring in Uppsala, Sweden
focus on creating comparable systems for moni- (www.who-umc.org).
toring cross-national patterns of antibacterial uti-
lization to aid work against bacterial resistance. The main purpose of the ATC classification is as
a tool for presenting drug utilization statistics
5.1 Different classification and it is recommended by WHO for use in inter- 33
systems national comparisons. The EPhMRA classification
system is used worldwide by IMS for providing
ATC classification; AT classification;
market research statistics to the pharmaceutical
EPhMRA; IMS; WHO Collaborating Centre
industry. It should be emphasized that the many
for Drug Statistics Methodology
technical differences between the EPhMRA
classification and the ATC classification mean that
Drugs can be classified in different ways accor-
data prepared using the two classification systems
ding to:
are not directly comparable.
– their mode of action;
In 1996, WHO recognized the need to develop
– their indications; or
the ATC/DDD system from a European to an
– their chemical structure.
international standard in drug utilization studies.
The European WHO Collaborating Centre for
Each classification system will have its advanta-
Drug Statistics Methodology in Oslo, Norway,
ges and limitations and its usefulness will
which is responsible for coordinating the use of
depend on the purpose, the setting used and the
the methodology, was then linked to WHO
user’s knowledge of the methodology.
Headquarters in Geneva. This was intended to
Comparisons between countries may require a
assist WHO in its efforts to ensure universal
classification system different from that needed
access to essential drugs and to stimulate ratio-
for a local comparison (e.g. between different
nal use of drugs particularly in developing coun-
wards in a hospital). Of the various systems pro-
tries.
posed over the years, only two have survived to
attain a dominant position in drug utilization
5.2The ATC classification system
research worldwide. These are the «Anatomical
Therapeutic» (AT) classification developed by the Structure; coding principles; therapeutic use;
European Pharmaceutical Market Research [ pharmaceutical formulations; strengths ]
Association (EPhMRA) and the «Anatomical
Therapeutic Chemical» (ATC) classification deve- The ATC classification system divides the drugs
loped by Norwegian researchers. These systems into different groups according to the organ or](https://image.slidesharecdn.com/due-110310040029-phpapp01/85/Due-34-320.jpg)
![possible alternatives for classification, and a national basis to secure consistent use of the
decision has to be made regarding the main use. methodology within a country. As described in
Countries using a drug in a different way from the general introduction, the same substance may
that indicated by the ATC classification may not have several different ATC codes depending on
wish to adopt the ATC classification but prefer to the application form and, to some extent, even
develop national classification systems. the strength. For combination products, specific
However, national traditions have to be weighed guidelines have been established for allocating
against the opportunity to introduce a methodo- ATC codes. Allocating DDDs to the products
logy that permits valid international comparisons necessitates many of the same considerations as
of drug utilization. Indeed, there are now many the allocation of the ATC code. However, in
examples where an enthusiastic application of order to link the drug list with sales figures or
the ATC/DDD methodology has been instrumen- prescription figures to obtain drug utilization sta-
tal in stimulating national research in drug utili- tistics, it is necessary to make appropriate calcu-
zation and in developing an efficient drug con- lations such as the number of DDDs per drug
trol system. package.
Finally, a given country will nearly always
5.4 Implementation of the have medicines and combination products for
ATC/DDD methodology which no ATC codes or DDDs exist. In these
36 cases, it is important to consult the WHO
National drug register; dynamic system;
[ different versions ] Collaborating Centre for Drug Statistics
Methodology in Oslo and request new ATC
codes and DDDs. Once ATC codes and DDDs
As soon as the decision to introduce the
have been linked to the national drug lists, it is
ATC/DDD methodology is taken, it is essential
necessary to update the drug list regularly in
to realize that its proper use inevitably includes
accordance with the annual updates of the
an important and time-consuming first step.
ATC/DDD system.
Each product has to be connected to the appro-
The publication Guidelines for ATC
priate ATC code and DDD (see chapter 6). The
Classification and DDD Assignment (see
linkage between the national drug register and
General reading) gives the information necessary
ATC/DDDs has to be ascertained by persons
for allocating ATC codes and DDDs at a national
with proper knowledge of the methodology.
or local level. All officially assigned ATC codes
Experience has shown that in many countries,
and DDDs are listed in the ATC Index with
health authorities, health policy-makers and rese-
DDDs (see General reading), a publication that
archers have not always allocated adequate
is also available in electronic format and is upda-
resources to this important initial step. Another
ted every year. Training courses in the
problem is that some users seem to be unaware
ATC/DDD methodology are arranged annually
that the ATC/DDD methodology is a dynamic
in Norway and from time to time in other coun-
system to which changes are made continually.
tries. Further information is available on the
This has resulted in several different versions of
web site of the WHO Collaborating Centre for
the ATC/DDD system being used at the same
Drug Statistics Methodology at
time, sometimes even within the same country.
http://www.whocc.no.
It is important to realize that adopting the
ATC/DDD classification of drugs requires
5.5 General reading
resources and the necessary competence to carry
Guidelines for ATC classification and DDD
out the work of allocating ATC codes to the pro-
Assignment. Oslo, Norway, WHO Collaborating
ducts. If possible, this work should be done on a
Centre for Drug Statistics Methodology, 2003.](https://image.slidesharecdn.com/due-110310040029-phpapp01/85/Due-37-320.jpg)