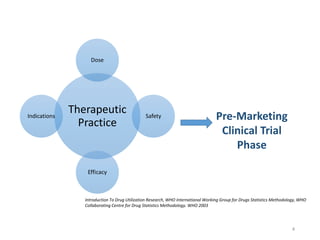
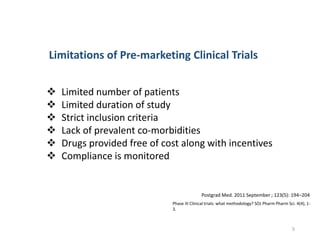
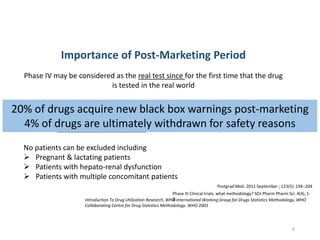
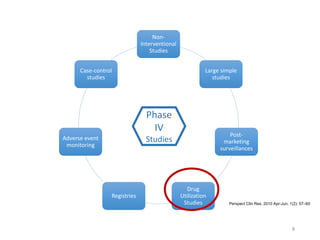
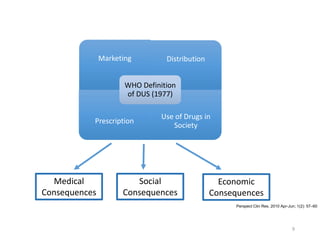
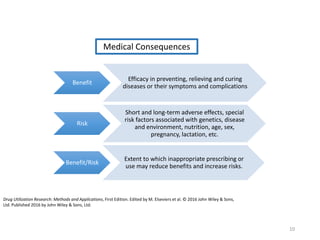
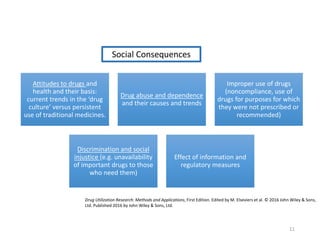
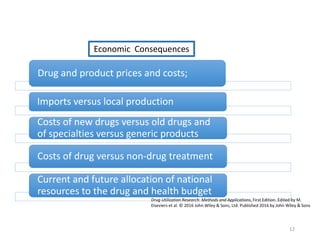
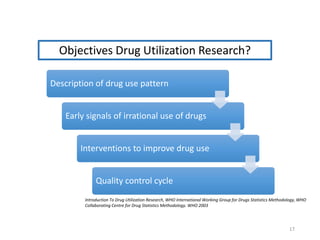
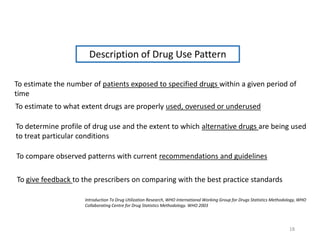
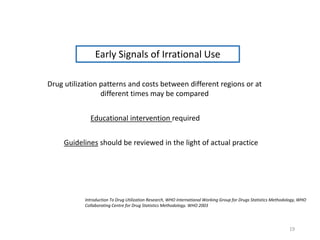
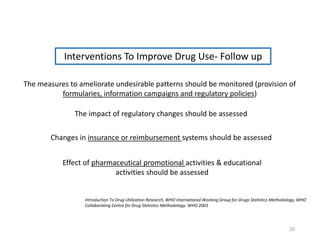
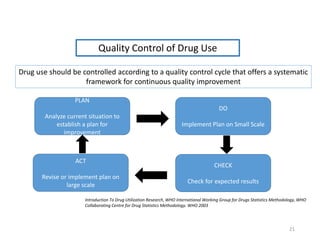
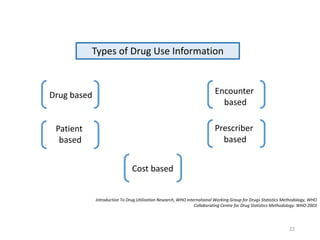
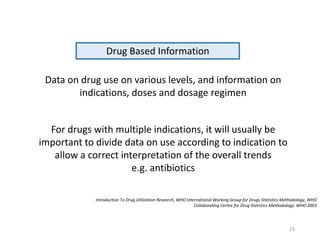
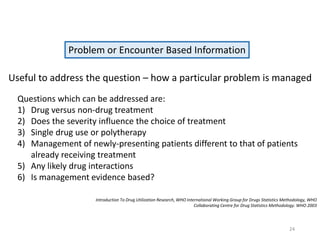
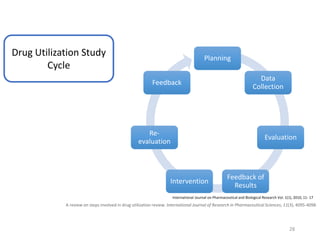
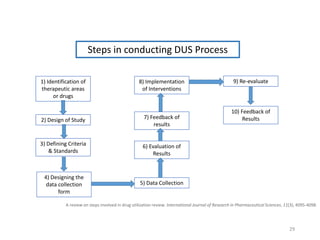
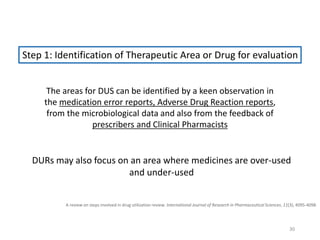
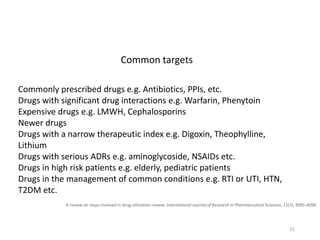
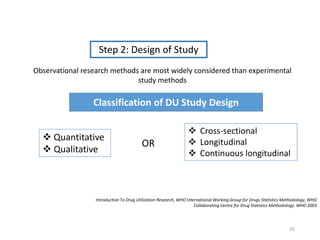
Drug Utilization Studies
(DUS)
Dr. Zarrin Ansari
First Year Resident
Department of Pharmacology
LTMMC & GH
1
2
 Introduction to Premarketing Phase
 Limitation of Premarketing Phase and Importance of Phase IV period
 Definition of DUS
 History of DUS
 Objectives of DUS
 Types of Drug Use Information
 Drug Utilization Cycle
Content
3
 Steps in conducting DUS process
• Identification of Therapeutic Area or Drug for evaluation
 Design of Study
 Defining Criteria & Standards
 Designing the data collection form
 Data Collection
 Evaluation of Results
 Feedback of results
 Implementation of Interventions
 Re-evaluate
 Feedback of Results
 Future Perspective
Content (contd..)
Therapeutic
Practice
Dose
Safety
Efficacy
Indications Pre-Marketing
Clinical Trial
Phase
Introduction To Drug Utilization Research, WHO International Working Group for Drugs Statistics Methodology, WHO
Collaborating Centre for Drug Statistics Methodology. WHO 2003
4
 Limited number of patients
 Limited duration of study
 Strict inclusion criteria
 Lack of prevalent co-morbidities
 Drugs provided free of cost along with incentives
 Compliance is monitored
Limitations of Pre-marketing Clinical Trials
Phase III Clinical trials: what methodology? SOJ Pharm Pharm Sci. 4(4), 1-
3.
Postgrad Med. 2011 September ; 123(5): 194–204
5
Complementary data from post marketing period are needed to provide an adequate
basis for improving drug therapy
Phase IV may be considered as the real test since for the first time that the drug
is tested in the real world
Importance of Post-Marketing Period
Heterogeneous population unlike the tailor made population of CTs
Introduction To Drug Utilization Research, WHO International Working Group for Drugs Statistics Methodology, WHO
Collaborating Centre for Drug Statistics Methodology. WHO 2003
No patients can be excluded including
 Pregnant & lactating patients
 Patients with hepato-renal dysfunction
 Patients with multiple concomitant patients
Postgrad Med. 2011 September ; 123(5): 194–204
Phase III Clinical trials: what methodology? SOJ Pharm Pharm Sci. 4(4), 1-
3.
20% of drugs acquire new black box warnings post-marketing
4% of drugs are ultimately withdrawn for safety reasons
6
Let’s explore the
Possibilities in the
Phase IV period
7
Non-
Interventional
Studies
Large simple
studies
Post-
marketing
surveillances
Drug
Utilization
Studies
Registries
Adverse event
monitoring
Case-control
studies
Phase
IV
Studies
Perspect Clin Res. 2010 Apr-Jun; 1(2): 57–60
8
Marketing Distribution
Prescription
Use of Drugs in
Society
WHO Definition
of DUS (1977)
Medical
Consequences
Social
Consequences
Economic
Consequences
Perspect Clin Res. 2010 Apr-Jun; 1(2): 57–60
9
Benefit
Efficacy in preventing, relieving and curing
diseases or their symptoms and complications
Risk
Short and long‐term adverse effects, special
risk factors associated with genetics, disease
and environment, nutrition, age, sex,
pregnancy, lactation, etc.
Benefit/Risk
Extent to which inappropriate prescribing or
use may reduce benefits and increase risks.
Drug Utilization Research: Methods and Applications, First Edition. Edited by M. Elseviers et al. © 2016 John Wiley & Sons,
Ltd. Published 2016 by John Wiley & Sons, Ltd.
Medical Consequences
10
Attitudes to drugs and
health and their basis:
current trends in the ‘drug
culture’ versus persistent
use of traditional medicines.
Drug abuse and dependence
and their causes and trends
Improper use of drugs
(noncompliance, use of
drugs for purposes for which
they were not prescribed or
recommended)
Discrimination and social
injustice (e.g. unavailability
of important drugs to those
who need them)
Effect of information and
regulatory measures
Social Consequences
Drug Utilization Research: Methods and Applications, First Edition. Edited by M. Elseviers et al. © 2016 John Wiley & Sons,
Ltd. Published 2016 by John Wiley & Sons, Ltd.
11
Drug and product prices and costs;
Imports versus local production
Costs of new drugs versus old drugs and
of specialties versus generic products
Costs of drug versus non‐drug treatment
Current and future allocation of national
resources to the drug and health budget
Economic Consequences
Drug Utilization Research: Methods and Applications, First Edition. Edited by M.
Elseviers et al. © 2016 John Wiley & Sons, Ltd. Published 2016 by John Wiley & Sons
12
History of DUS
Northern Europe
United Kingdom in
mid 1960s Arthur Engel in Sweden
Pieter Siderius in Holland
Initiated mainly for
Marketing purpose
Demonstrated remarkable
differences in the sales of
antibiotics in six European
countries between 1966 and
1967
WHO organize first
meeting on «Drug
consumption» in Oslo in
1969.
This led to the
constitution of the WHO
European Drug
Utilization Research
Group (DURG)
To overcome variability in
dosing, a ATC/DDD method
was devised to standardize
by researchers in UK,
Norway and Sweden
and the first
comprehensive
national list of DDDs
was published in
Norway in 1975
First country to adopt the
DDD methodology was the
former Czechoslovakia
First comprehensive
national list of DDDs
was published in
Norway in 1975
Introduction To Drug Utilization Research, WHO International Working Group for Drugs Statistics Methodology, WHO
Collaborating Centre for Drug Statistics Methodology. WHO 2003
ATC: Anatomical Therapeutic
Classification
DDD: Defined Daily Dose
13
Drug utilization research developed quickly during the
following 30 years and soon became a respectable
subject for consideration at international congresses in
pharmacology, pharmacy and epidemiology
Successful research in drug utilization requires
multidisciplinary collaboration between clinicians, clinical
pharmacologists, pharmacists and epidemiologists.
Introduction To Drug Utilization Research, WHO International Working Group for Drugs Statistics Methodology, WHO
Collaborating Centre for Drug Statistics Methodology. WHO 2003
14
Types of DUR
Descriptive Analytical
Describing patterns of drug
utilization and identifying
problems
Link data to figures of co-
morbidity, outcome of treatment,
quality of care. Finally decide
whether therapy is rational.
Introduction To Drug Utilization Research, WHO International Working Group for Drugs Statistics Methodology, WHO
Collaborating Centre for Drug Statistics Methodology. WHO 2003
15
Why Drug Utilization Research?
To Facilitate Rational Use of Drugs in Population
Rationale use of drugs defined as “Patients receive
medications appropriate to their clinical needs, in doses that
meet their own individual requirement, for adequate period of
time and at the lowest cost to them and their community”
WHO 1985
Promoting Rational Use of Medicines: Core Components-WHO Policy Perspectives on Medicines. September
2002
16
Description of drug use pattern
Early signals of irrational use of drugs
Interventions to improve drug use
Quality control cycle
Objectives Drug Utilization Research?
Introduction To Drug Utilization Research, WHO International Working Group for Drugs Statistics Methodology, WHO
Collaborating Centre for Drug Statistics Methodology. WHO 2003
17
Description of Drug Use Pattern
To estimate the number of patients exposed to specified drugs within a given period of
time
To estimate to what extent drugs are properly used, overused or underused
To compare observed patterns with current recommendations and guidelines
To give feedback to the prescribers on comparing with the best practice standards
Introduction To Drug Utilization Research, WHO International Working Group for Drugs Statistics Methodology, WHO
Collaborating Centre for Drug Statistics Methodology. WHO 2003
To determine profile of drug use and the extent to which alternative drugs are being used
to treat particular conditions
18
Early Signals of Irrational Use
Drug utilization patterns and costs between different regions or at
different times may be compared
Educational intervention required
Guidelines should be reviewed in the light of actual practice
Introduction To Drug Utilization Research, WHO International Working Group for Drugs Statistics Methodology, WHO
Collaborating Centre for Drug Statistics Methodology. WHO 2003
19
The measures to ameliorate undesirable patterns should be monitored (provision of
formularies, information campaigns and regulatory policies)
The impact of regulatory changes should be assessed
Changes in insurance or reimbursement systems should be assessed
Interventions To Improve Drug Use- Follow up
Effect of pharmaceutical promotional activities & educational
activities should be assessed
Introduction To Drug Utilization Research, WHO International Working Group for Drugs Statistics Methodology, WHO
Collaborating Centre for Drug Statistics Methodology. WHO 2003
20
Quality Control of Drug Use
PLAN
Analyze current situation to
establish a plan for
improvement
DO
Implement Plan on Small Scale
CHECK
Check for expected results
ACT
Revise or implement plan on
large scale
Introduction To Drug Utilization Research, WHO International Working Group for Drugs Statistics Methodology, WHO
Collaborating Centre for Drug Statistics Methodology. WHO 2003
Drug use should be controlled according to a quality control cycle that offers a systematic
framework for continuous quality improvement
21
Types of Drug Use Information
Drug based Encounter
based
Patient
based
Prescriber
based
Cost based
Introduction To Drug Utilization Research, WHO International Working Group for Drugs Statistics Methodology, WHO
Collaborating Centre for Drug Statistics Methodology. WHO 2003
22
Drug Based Information
Data on drug use on various levels, and information on
indications, doses and dosage regimen
For drugs with multiple indications, it will usually be
important to divide data on use according to indication to
allow a correct interpretation of the overall trends
e.g. antibiotics
Introduction To Drug Utilization Research, WHO International Working Group for Drugs Statistics Methodology, WHO
Collaborating Centre for Drug Statistics Methodology. WHO 2003
23
Problem or Encounter Based Information
Useful to address the question – how a particular problem is managed
Questions which can be addressed are:
1) Drug versus non-drug treatment
2) Does the severity influence the choice of treatment
3) Single drug use or polytherapy
4) Management of newly-presenting patients different to that of patients
already receiving treatment
5) Any likely drug interactions
6) Is management evidence based?
Introduction To Drug Utilization Research, WHO International Working Group for Drugs Statistics Methodology, WHO
Collaborating Centre for Drug Statistics Methodology. WHO 2003
24
Patient Based Information
Information on demographics and other details about patient is useful
Co-morbidities influence choice of treatment
Knowledge, beliefs and perceptions of patients and their attitudes to drugs are
important
Qualitative data useful to design consumer
information & education programs
Introduction To Drug Utilization Research, WHO International Working Group for Drugs Statistics Methodology, WHO
Collaborating Centre for Drug Statistics Methodology. WHO 2003
25
Prescriber Based Information
Are prescribing profiles influenced by prescriber’s education?
Are prescribing habits different for general practitioners and specialist?
Does age or gender of the prescriber influence the prescribing profile?
Does practice differ between urban and rural regions?
Which prescribers rapidly adopt recently released drugs?
Introduction To Drug Utilization Research, WHO International Working Group for Drugs Statistics Methodology, WHO
Collaborating Centre for Drug Statistics Methodology. WHO 2003
26
Cost Based Information
Cost based information will always be important in managing policy related
to drug supply, pricing and use
Introduction To Drug Utilization Research, WHO International Working Group for Drugs Statistics Methodology, WHO
Collaborating Centre for Drug Statistics Methodology. WHO 2003
Cost may be determined at government, health facility, hospital, health
maintenance organization or other levels within the health sector
27
A review on steps involved in drug utilization review. International Journal of Research in Pharmaceutical Sciences, 11(3), 4095-4098.
Planning
Data
Collection
Evaluation
Feedback of
Results
Intervention
Re-
evaluation
Feedback
Drug Utilization Study
Cycle
International Journal on Pharmaceutical and Biological Research Vol. 1(1), 2010, 11- 17
28
1) Identification of
therapeutic areas
or drugs
2) Design of Study
3) Defining Criteria
& Standards
4) Designing the
data collection
form
8) Implementation
of Interventions
9) Re-evaluate
7) Feedback of
results
5) Data Collection
6) Evaluation of
Results
10) Feedback of
Results
Steps in conducting DUS Process
A review on steps involved in drug utilization review. International Journal of Research in Pharmaceutical Sciences, 11(3), 4095-4098.
29
A review on steps involved in drug utilization review. International Journal of Research in Pharmaceutical Sciences, 11(3), 4095-4098.
Step 1: Identification of Therapeutic Area or Drug for evaluation
The areas for DUS can be identified by a keen observation in
the medication error reports, Adverse Drug Reaction reports,
from the microbiological data and also from the feedback of
prescribers and Clinical Pharmacists
DURs may also focus on an area where medicines are over-used
and under-used
30
A review on steps involved in drug utilization review. International Journal of Research in Pharmaceutical Sciences, 11(3), 4095-4098.
Commonly prescribed drugs e.g. Antibiotics, PPIs, etc.
Drugs with significant drug interactions e.g. Warfarin, Phenytoin
Expensive drugs e.g. LMWH, Cephalosporins
Newer drugs
Drugs with a narrow therapeutic index e.g. Digoxin, Theophylline,
Lithium
Drugs with serious ADRs e.g. aminoglycoside, NSAIDs etc.
Drugs in high risk patients e.g. elderly, pediatric patients
Drugs in the management of common conditions e.g. RTI or UTI, HTN,
T2DM etc.
Common targets
31
 Cross-sectional
 Longitudinal
 Continuous longitudinal
Step 2: Design of Study
Observational research methods are most widely considered than experimental
study methods
Classification of DU Study Design
 Quantitative
 Qualitative
Introduction To Drug Utilization Research, WHO International Working Group for Drugs Statistics Methodology, WHO
Collaborating Centre for Drug Statistics Methodology. WHO 2003
OR
32
Used to describe present situation and the trends in the drug
prescription and drug use at various levels of the health care system.
Introduction To Drug Utilization Research, WHO International Working Group for Drugs Statistics Methodology, WHO
Collaborating Centre for Drug Statistics Methodology. WHO 2003
Quantitative
Assess the appropriateness of drug utilization and link the prescribing
data to reasons for prescribing. This process is one of the
therapeutic/prescription audit.
Qualitative
33
Cross-sectional Studies
Introduction To Drug Utilization Research, WHO International Working Group for Drugs Statistics Methodology, WHO
Collaborating Centre for Drug Statistics Methodology. WHO 2003
 Provide a snapshot of drug use at a particular time like over a year, a
month or a day
 Used for making comparisons with similar data collected over the
same period in a different country, health facility or a ward
 Can be carried out before and after an intervention
 Studies can simply measure drug use, or can be utilized to assess drug
use in relation to guidelines
34
Longitudinal Studies
 Data can be on total drug use or on a statistically valid samples
from pharmacies or medical practices
 Often obtained from repeated cross sectional surveys
 Data collection is continuous but the practitioner surveyed
and therefore patients are continuously changing
 Such data gives information about overall trends
Introduction To Drug Utilization Research, WHO International Working Group for Drugs Statistics Methodology, WHO
Collaborating Centre for Drug Statistics Methodology. WHO 2003
35
Continuous Longitudinal Studies
Introduction To Drug Utilization Research, WHO International Working Group for Drugs Statistics Methodology, WHO
Collaborating Centre for Drug Statistics Methodology. WHO 2003
Continuous longitudinal data at individual
practitioner and patient levels are obtained
Database are powerful and can address a range of
issues including reasons for changes in therapy,
adverse effects and health outcomes.
36
A review on steps involved in drug utilization review. International Journal of Research in Pharmaceutical Sciences, 11(3), 4095-4098.
Criteria are always statements, which are determined earlier that can enable
oneself to provide uncompromised drug use, wherein the quality of actual
drug use can be compared.
Research literature must be used to validate the formed criteria scientifically.
The developed criteria should be scientifically based and supported by the
research literature.
This should be authentic and must have only one interpretation and also
should be readily measured.
Step 3: Define criteria and standards
37
A review on steps involved in drug utilization review. International Journal of Research in Pharmaceutical Sciences, 11(3), 4095-4098.
Step 4: Design the Data Collection Form
It is important to limit data collection to only the most important and relevant
aspects of drug use
It is important to have a good structure for a data collection form because a good
frame reflects the accuracy of the collected data
Patient demographics
Prescriber details
Indication/
Contraindications
Side/adverse effects
Dosing information
Drug or drug class
duplication
Drug interactions
Monitoring of drug
therapy
Patient
education/instructions
Cost of therapy
Aspects of drug use
commonly surveyed
International Journal on Pharmaceutical and Biological Research Vol. 1(1), 2010, 11- 17
38
A review on steps involved in drug utilization review. International Journal of Research in Pharmaceutical Sciences, 11(3), 4095-4098.
Step 5: Data Collection
Physicians, pharmacists and nurses make ideal data collectors.
Data collectors should be familiar with the collection of data
from the Patient’s case note.
39
Data from
Drug
Regulatory
agencies
Supplier
(Distribution)
Data
Large
Database
Practice
Setting Data
Community
Setting Data
A review on steps involved in drug utilization review. International Journal of Research in Pharmaceutical Sciences, 11(3), 4095-4098.
Sources of Data
40
Introduction To Drug Utilization Research, WHO International Working Group for Drugs Statistics Methodology, WHO
Collaborating Centre for Drug Statistics Methodology. WHO 2003
Large Databases
 Efficient use of health care resources – Computer databases or medical
record sections
 Data may be collected on drug sale, drug distribution chain, medical bills
or samples of prescription
 May be international, national or local- comparative studies can be
planned at various levels.
 May be diagnosis linked or non-diagnosis linked
 Diagnosis linked data enable drug use to be analyzed according to
patients characteristics, therapeutic groups, diseases or conditions and,
clinical outcome.
41
Introduction To Drug Utilization Research, WHO International Working Group for Drugs Statistics Methodology, WHO
Collaborating Centre for Drug Statistics Methodology. WHO 2003
 Are repositories of data on which drugs have been registered
for use, withdrawn or banned within a country.
 Agencies have the legal responsibility of ensuring the
availability of safe, efficacious and good quality drugs
 Possible to obtain data on the number of drugs registered in a
country from such agencies.
 Importation data like product type (i.e. generic or branded),
volume, port of origin, country of manufacture, batch number
and expiry date may be collected.
Data from Drug Regulatory Agencies
42
Introduction To Drug Utilization Research, WHO International Working Group for Drugs Statistics Methodology, WHO
Collaborating Centre for Drug Statistics Methodology. WHO 2003
Supplier (Distribution) Data
 Data on supplier can be obtained from, drug importation; local
manufacture; customs service, wholesalers
 In countries where licenses are required from drug regulatory
authorities before importation of drugs
 Generally be used to describe total quantities of specific drug or
drug group, origins of supplies and type (i.e. branded or generic)
 Distribution at different levels of supplies can be compared
43
Introduction To Drug Utilization Research, WHO International Working Group for Drugs Statistics Methodology, WHO
Collaborating Centre for Drug Statistics Methodology. WHO 2003
Practice Setting Data
Prescribing
Data
Dispensing
Data
Aggregate Data
OTC &
Pharmacist
Prescribed Data
Telephone &
Internet
Prescribed data
44
Prescribing Data
Usually extracted from outpatient and inpatient prescriptions.
Information that may be obtained from prescriptions includes
 Patient’s demography
 Drug name, dosage form, strength, dose, frequency of administration
and duration of treatment.
 Where diagnoses are noted on prescriptions, is possible to link drug
use to indications.
 Trends in utilization for specific drugs and diseases can also be
established.
Introduction To Drug Utilization Research, WHO International Working Group for Drugs Statistics Methodology, WHO
Collaborating Centre for Drug Statistics Methodology. WHO 2003
45
Dispensing Data
Drug dispensing is a process that ends with a client leaving a drug outlet
with a defined quantity of medication and instructions for using it
Information available from dispensers may include
 Drug (s) prescribed
 Dose(s) prescribed
 Average number of items per prescription
 Percentage of items prescribed that were actually supplied (an
indicator of availability)
 Percentage of drugs adequately labeled
 Quantity of medications dispensed
 Cost of each item or prescription.
Introduction To Drug Utilization Research, WHO International Working Group for Drugs Statistics Methodology, WHO
Collaborating Centre for Drug Statistics Methodology. WHO 2003
46
Aggregate Data
Source include – Hospital pharmacy stock and dispensing records,
medication error records, adverse drug reaction records and patient
medical records
Used to obtain information on
 The cost of individual drugs and classes of drug
 The most and least expensive drugs
 The consumption of specific products
 The prevalence of adverse drug reactions
 The prevalence of medication errors
 The percentage of the budget spent on specific drugs or classes of drug
Introduction To Drug Utilization Research, WHO International Working Group for Drugs Statistics Methodology, WHO
Collaborating Centre for Drug Statistics Methodology. WHO 2003
47
OTC & Pharmacist Prescribed Data
 Pharmacists and other drug outlet managers may prescribe over
the counter (OTC) preparations or pharmacist prepared drugs
that do not require prescription by physician
 When such information is available from stock or dispensing
records, it broadens the understanding of drug utilization
patterns
Introduction To Drug Utilization Research, WHO International Working Group for Drugs Statistics Methodology, WHO
Collaborating Centre for Drug Statistics Methodology. WHO 2003
48
Telephone & Internet Prescribed data
 Mostly happens in developed countries
 Innovative ways have to be devised to collect information on this
type of transaction
Introduction To Drug Utilization Research, WHO International Working Group for Drugs Statistics Methodology, WHO
Collaborating Centre for Drug Statistics Methodology. WHO 2003
49
Community Setting Data
 Drugs available in households have either been prescribed or
dispensed at health facilities, purchased at pharmacy or are over the
counter medications.
 The drugs may be for the treatment of current illness or are left over
from previous illness.
 Data can be collected by performing household surveys, counting left
over pills etc.
Introduction To Drug Utilization Research, WHO International Working Group for Drugs Statistics Methodology, WHO
Collaborating Centre for Drug Statistics Methodology. WHO 2003
50
Step 6: Evaluate Results
Summarize data into the major categories of results
Check where exactly the data shows deviation from the guideline
and usage criteria
Evaluate reasons for this deviation
Reasons for deviation may include:
•◦ Drug being used for new indication
•◦ Outdated procedures
•◦ Inadequate resources
•◦ Gaps in knowledge or misinformation / misunderstanding
Introduction To Drug Utilization Research, WHO International Working Group for Drugs Statistics Methodology, WHO
Collaborating Centre for Drug Statistics Methodology. WHO 2003
51
Introduction To Drug Utilization Research, WHO International Working Group for Drugs Statistics Methodology, WHO
Collaborating Centre for Drug Statistics Methodology. WHO 2003
A review on steps involved in drug utilization review. International Journal of Research in Pharmaceutical Sciences, 11(3), 4095-4098.
Parameters used for Evaluation of Data
Drug Utilization Metrics
Defined Daily Dosing (DDD)
Prescribed Daily Dosing (PDD)
Other Units for Presentation of
Volume
Cost
Drug Use Indicators
Prescribing Indicators
Patient Care Indicators
Facility Indicators
Drug Classification System
52
A drug classification system represents a common language
for describing the drug assortment in a country or a region
and is a prerequisite for national and international
comparison of drug utilization data
The main purpose of having an international standard is to be
able to compare data between countries
Introduction To Drug Utilization Research, WHO International Working Group for Drugs Statistics Methodology, WHO
Collaborating Centre for Drug Statistics Methodology. WHO 2003
Drug Classification System
53
Anatomical Therapeutic
Chemicals (ATC)
Anatomical Classification (AT)
Developed by the Norwegian
researchers
Developed by European
Pharmaceutical Market Research
Association (EPhMRA)
Drug Classification includes a
therapeutic/pharmacological/ch
emical subgroup as fourth level
and the chemical substance as
fifth level
Drugs classified in groups at
three or four different levels
ATC classification is also the basis
for classification of ADR used by
the WHO Collaborating Centre
for International Drug
Monitoring in Uppsala, Sweden
AT classification is used by the
International Marketing Services
for providing market research
statistics to the pharmaceutical
industry
Introduction To Drug Utilization Research, WHO International Working Group for Drugs Statistics Methodology, WHO
Collaborating Centre for Drug Statistics Methodology. WHO 2003
54
A medicinal product can be given more
than one ATC code if it is available in
two or more strengths and
formulations with clearly different
therapeutic uses.
Bromocriptine at lower strengths are
used as prolactin inhibitors (G02)
whereas at higher strengths is used for
Parkinson’s Disease (N04)
Introduction To Drug Utilization Research, WHO International Working Group for Drugs Statistics
Methodology, WHO Collaborating Centre for Drug Statistics Methodology. WHO 2003
55
56
A07EA01 Intestinal anti-inflammatory agents (enemas and
rectal foams)
C05AA04 Antihaemorrhoidals for topical use (Rectal
suppositories)
D07AA03 Dermatological preparations (creams, ointments,
lotions)
H02AD02 Corticosteroids for systemic use (Tablets,
injections)
R01AD02 Nasal decongestants (nasal sprays, drops)
S02BA03 Otologicals (ear drops)
Introduction To Drug Utilization Research, WHO International Working Group for Drugs Statistics
Methodology, WHO Collaborating Centre for Drug Statistics Methodology. WHO 2003
Different formulations of Prednisolone
57
Bone
disease/Osteoporosis
ATC group
Vitamin D and Analogues A11CC
Calcium supplements A12A
Estrogens/Tibolon/SERM G03C/G03F/G03X
Parathyroid hormones H05AA
Calcitonin H05BA
Biphosphonates M05BA/M05BB
Introduction To Drug Utilization Research, WHO International Working Group for Drugs Statistics
Methodology, WHO Collaborating Centre for Drug Statistics Methodology. WHO 2003
One Indication: Several ATC codes
Defined Daily Dosing (DDD)
It is the average maintenance dose per day for a drug used for its
main indication in adults
DDD is a unit of measurement and does not necessarily correspond to the
recommended or Prescribed Daily Dosing (PDD)
It give a rough estimate of consumption and not an exact picture of
actual use.
Introduction To Drug Utilization Research, WHO International Working Group for Drugs Statistics
Methodology, WHO Collaborating Centre for Drug Statistics Methodology. WHO 2003
Drug Utilization Metrics
58
DDDs provide a fixed unit of measurement independent of price, currency,
package size and strength enabling the researcher to assess trends in drug
consumption and to perform comparisons between population groups
Introduction To Drug Utilization Research, WHO International Working Group for Drugs Statistics
Methodology, WHO Collaborating Centre for Drug Statistics Methodology. WHO 2003
DDD per 1000 inhabitants per day-- OPD patients
DDD per 100 bed days– Inpatient patients
DDDs per inhabitant per year– Drugs used for short duration
59
Introduction To Drug Utilization Research, WHO International Working Group for Drugs Statistics
Methodology, WHO Collaborating Centre for Drug Statistics Methodology. WHO 2003
DDDs per 1000 inhabitants per day:-
Provide a rough estimate of the proportion of the study population
treated daily with a particular drug or group of drugs
Example: 10 DDDs per 1000 inhabitants per day indicates that 1% of
the population on average might receive a certain drug or group of
drugs daily
Most useful for chronically used drugs
60
DDDs per 100 bed-days:-
Applied when in-patients are considered
Example:
70 DDDs per 100 bed-days of hypnotics suggest that 70% of
inpatients might receive a DDD of a hypnotic everyday.
Introduction To Drug Utilization Research, WHO International Working Group for Drugs Statistics
Methodology, WHO Collaborating Centre for Drug Statistics Methodology. WHO 2003
61
Introduction To Drug Utilization Research, WHO International Working Group for Drugs Statistics
Methodology, WHO Collaborating Centre for Drug Statistics Methodology. WHO 2003
DDDs per inhabitants per year:-
E.g. -
5 DDDs per inhabitant per year indicates that the utilization is
equivalent to the treatment of every inhabitant with a five-day
course during a certain year.
62
Prescribed Daily Dose (PDD)
It is the average dose prescribed according to a representative
sample of prescription
It can be determined from studies of prescriptions or medical or
pharmacy records
It is important to link the PDD to the diagnosis on which the
dosage is based, especially is the dosage differs from one
indication to another
Introduction To Drug Utilization Research, WHO International Working Group for Drugs Statistics
Methodology, WHO Collaborating Centre for Drug Statistics Methodology. WHO 2003
63
Introduction To Drug Utilization Research, WHO International Working Group for Drugs Statistics
Methodology, WHO Collaborating Centre for Drug Statistics Methodology. WHO 2003
Other Units for Presentation of Volume
Physical units (gm, Kg, litres), number of packages or tablets, number
of prescriptions are also used for quantifying drug utilization.
Grams of active ingredient:
 Drugs with low potency will account for a larger fraction of the total
than drugs with high potency
 Combined products may also contain different amounts of active
ingredients from plain products
64
Introduction To Drug Utilization Research, WHO International Working Group for Drugs Statistics
Methodology, WHO Collaborating Centre for Drug Statistics Methodology. WHO 2003
Number of Tablets:
Counting numbers of tablets does not reflect the variations in strengths of tablets,
with the result that low-strength preparations contribute relatively more than high-
strength preparations to the total numbers
Number of Prescription:
Do not accurately reflect total use, unless total quantities of drugs per
prescription are also considered. ◦ Valuable in measuring the frequency
of prescriptions
65
Introduction To Drug Utilization Research, WHO International Working Group for Drugs Statistics
Methodology, WHO Collaborating Centre for Drug Statistics Methodology. WHO 2003
Cost
 Cost figures are suitable for an overall analysis of expenditure on drugs
 International comparisons based on cost parameters can be misleading
and have limited value in the evaluation of drug use.
 Difficulties in evaluation may be due to
Price differences between alternative preparations
Fluctuations in currency
Changes in price
66
Drug Use Indicators
Prescribing indicators
•Average number of drugs per encounter
•Percentage of drugs prescribed by generic name
•Percentage of encounters with an antibiotic prescribed
•Percentage of encounters with an injection prescribed
•Percentage of drugs prescribed from essential drugs list
or formulary
Patient care indicators
◦ Average consultation time
◦ Average dispensing time
◦ Percentage of drugs actually dispensed
◦ Percentage of drugs adequately labelled
◦ Patients' knowledge of correct dosage
Facility indicators
◦ Availability of copy of essential drugs list or
formulary
◦ Availability of key drugs
◦ Availability of clinical guidelines
J Pharmacol Pharmacother. 2016 Jan-Mar; 7(1): 51–54.
Introduction To Drug Utilization Research, WHO International Working Group for Drugs Statistics
Methodology, WHO Collaborating Centre for Drug Statistics Methodology. WHO 2003
67
Prescribing Indicators
Average = Total number of different drug products prescribed
--------------------------------------------------------------------
Number of encounters surveyed
Average number of drugs per encounter
This indicator is aimed at assessing the extent of poly-pharmacy. The WHO proposes that this should be <2
Percentage = Number of drugs prescribed by generic name
---------------------------------------------------------------- X 100
Total number of drugs prescribed
Percentage (%) of drugs prescribed by generic name
This indicator is aimed at measuring prescriber's tendency to prescribe medicines using generic or
international nonproprietary name
J Pharmacol Pharmacother. 2016 Jan-Mar; 7(1): 51–54.
69
Percentage = Number of patient encounters during which an antibiotic is prescribed
---------------------------------------------------------------------------------------------- X 100
Number of encounters surveyed
Percentage of encounters with an antibiotic prescribed
This indicator assesses the frequency of antibiotic prescribing among primary health care (PHC) providers.
Percentage = Number of patient encounters during which an injection is prescribed
----------------------------------------------------------------------------------------------- X 100
Number of encounters surveyed
Percentage of encounters with an injection prescribed
This indicator describes the frequency with which injectable forms of medicines are prescribed.
Investigators should be aware of immunizations that are not counted as injections.
J Pharmacol Pharmacother. 2016 Jan-Mar; 7(1): 51–54.
70
Percentage = Number of products prescribed which are listed on the essential drug list or local formulary
--------------------------------------------------------------------------------------------------------------------------- X 100
Total number of drugs prescribed
Percentage of drugs prescribed from essential drug list or formulary
The main focus of this indicator is to access whether prescribing practices conform to drug use policy as
pertaining to the use of essential medicines list (EML).
J Pharmacol Pharmacother. 2016 Jan-Mar; 7(1): 51–54.
71
Patient Care Indicators
Average = Total time for a series of consultation
---------------------------------------------------------
Number of consultations
Average consultation time
Average = Total time for dispensing drugs to a series of patients
----------------------------------------------------------------------
-
Number of encounters
Average dispensing time
BMC Health Services Research (2016) 16:144
Percentage = Number of drugs actually dispensed at the health facility
--------------------------------------------------------------------------- X 100
Total number of drug prescribed
Percentage of drugs actually
dispensed
72
Number of drug packages containing at least patient
name, drug name and when the drug should be taken
Percentage = ------------------------------------------------------------------------ X 100
Total number of drug packages dispensed
Percentage of drugs adequately labelled
Number of patients who can adequately report the dosage
schedule for all the drugs
Percentage = ----------------------------------------------------------------------------------- X 100
Total number of patients interviewed
Patient’s knowledge of correct
dosage
BMC Health Services Research (2016) 16:144
73
Facility Indicators
Availability of copy of essential drugs list or formulary
Scored as Yes or no
Availability of clinical guidelines
Scored as Yes or No
Availability of Key drugs
Percentage = Number of specified products actually in stock
--------------------------------------------------------------------------- X 100
Total number of drug on the checklist
BMC Health Services Research (2016) 16:144
74
Step 7: Feedback of Results
 Preparation of a scientific interpretation of the results.
 Success of any DUS depends on feedback of results to prescribers, other
hospital staffs involved in the study and to administrative heads.
 The results can also be circulated to hospital staff via newsletters or the
hospital’s academic meetings.
A review on steps involved in drug utilization review. International Journal of Research in Pharmaceutical Sciences, 11(3), 4095-4098.
75
Step 8: Implementation & Interventions
◦ Educational - educational meetings, development of protocols, letters
to individual physicians.
◦ Operational - modification of drug order forms, development of
stringent drug use policy, manual or computerized
reminders, prescribing restrictions, formulary
additions/deletions, extent of pharmaceutical promotion.
If a drug use problem is identified the next step is to consider how
the problem can be addressed
Interventions
A review on steps involved in drug utilization review. International Journal of Research in Pharmaceutical Sciences, 11(3), 4095-4098.
76
Step 9: Re-evaluate
 Drug use and prescribing patterns need to be monitored
to determine the success of intervention
 Re-evaluation is usually done 3-12 months after the
introduction of the intervention
 Collection of data as in original DUS
 Should be a continuous process at regular interval
A review on steps involved in drug utilization review. International Journal of Research in Pharmaceutical Sciences, 11(3), 4095-4098.
77
Step 10:Feedback of Results
 Results of the DUS is to be circulated
 Opinions about success of interventions and
improvement of drug use are to be obtained
 Analyze and act accordingly
A review on steps involved in drug utilization review. International Journal of Research in Pharmaceutical Sciences, 11(3), 4095-4098.
78
79
…..In A Nutshell
Future Perspective
 The study of drug utilization in an evolving field.
 The use of large computerized databases that allow linkage of drug
utilization data to diagnosis, subject to some inherent limitations, is
contributing to expand this area of study.
 Importance of drug utilization studies in pharmacoepidemiology
has been increasing due to their close association to other areas
like- public health, pharmacovigilance, pharmacoeconomics and
pharmacogenetics
International Journal on Pharmaceutical and Biological Research Vol. 1(1), 2010, 11-
17
80
81

Drug Utilization Studies

  • 1.
    Drug Utilization Studies (DUS) Dr.Zarrin Ansari First Year Resident Department of Pharmacology LTMMC & GH 1
  • 2.
    2  Introduction toPremarketing Phase  Limitation of Premarketing Phase and Importance of Phase IV period  Definition of DUS  History of DUS  Objectives of DUS  Types of Drug Use Information  Drug Utilization Cycle Content
  • 3.
    3  Steps inconducting DUS process • Identification of Therapeutic Area or Drug for evaluation  Design of Study  Defining Criteria & Standards  Designing the data collection form  Data Collection  Evaluation of Results  Feedback of results  Implementation of Interventions  Re-evaluate  Feedback of Results  Future Perspective Content (contd..)
  • 4.
    Therapeutic Practice Dose Safety Efficacy Indications Pre-Marketing Clinical Trial Phase IntroductionTo Drug Utilization Research, WHO International Working Group for Drugs Statistics Methodology, WHO Collaborating Centre for Drug Statistics Methodology. WHO 2003 4
  • 5.
     Limited numberof patients  Limited duration of study  Strict inclusion criteria  Lack of prevalent co-morbidities  Drugs provided free of cost along with incentives  Compliance is monitored Limitations of Pre-marketing Clinical Trials Phase III Clinical trials: what methodology? SOJ Pharm Pharm Sci. 4(4), 1- 3. Postgrad Med. 2011 September ; 123(5): 194–204 5
  • 6.
    Complementary data frompost marketing period are needed to provide an adequate basis for improving drug therapy Phase IV may be considered as the real test since for the first time that the drug is tested in the real world Importance of Post-Marketing Period Heterogeneous population unlike the tailor made population of CTs Introduction To Drug Utilization Research, WHO International Working Group for Drugs Statistics Methodology, WHO Collaborating Centre for Drug Statistics Methodology. WHO 2003 No patients can be excluded including  Pregnant & lactating patients  Patients with hepato-renal dysfunction  Patients with multiple concomitant patients Postgrad Med. 2011 September ; 123(5): 194–204 Phase III Clinical trials: what methodology? SOJ Pharm Pharm Sci. 4(4), 1- 3. 20% of drugs acquire new black box warnings post-marketing 4% of drugs are ultimately withdrawn for safety reasons 6
  • 7.
    Let’s explore the Possibilitiesin the Phase IV period 7
  • 8.
  • 9.
    Marketing Distribution Prescription Use ofDrugs in Society WHO Definition of DUS (1977) Medical Consequences Social Consequences Economic Consequences Perspect Clin Res. 2010 Apr-Jun; 1(2): 57–60 9
  • 10.
    Benefit Efficacy in preventing,relieving and curing diseases or their symptoms and complications Risk Short and long‐term adverse effects, special risk factors associated with genetics, disease and environment, nutrition, age, sex, pregnancy, lactation, etc. Benefit/Risk Extent to which inappropriate prescribing or use may reduce benefits and increase risks. Drug Utilization Research: Methods and Applications, First Edition. Edited by M. Elseviers et al. © 2016 John Wiley & Sons, Ltd. Published 2016 by John Wiley & Sons, Ltd. Medical Consequences 10
  • 11.
    Attitudes to drugsand health and their basis: current trends in the ‘drug culture’ versus persistent use of traditional medicines. Drug abuse and dependence and their causes and trends Improper use of drugs (noncompliance, use of drugs for purposes for which they were not prescribed or recommended) Discrimination and social injustice (e.g. unavailability of important drugs to those who need them) Effect of information and regulatory measures Social Consequences Drug Utilization Research: Methods and Applications, First Edition. Edited by M. Elseviers et al. © 2016 John Wiley & Sons, Ltd. Published 2016 by John Wiley & Sons, Ltd. 11
  • 12.
    Drug and productprices and costs; Imports versus local production Costs of new drugs versus old drugs and of specialties versus generic products Costs of drug versus non‐drug treatment Current and future allocation of national resources to the drug and health budget Economic Consequences Drug Utilization Research: Methods and Applications, First Edition. Edited by M. Elseviers et al. © 2016 John Wiley & Sons, Ltd. Published 2016 by John Wiley & Sons 12
  • 13.
    History of DUS NorthernEurope United Kingdom in mid 1960s Arthur Engel in Sweden Pieter Siderius in Holland Initiated mainly for Marketing purpose Demonstrated remarkable differences in the sales of antibiotics in six European countries between 1966 and 1967 WHO organize first meeting on «Drug consumption» in Oslo in 1969. This led to the constitution of the WHO European Drug Utilization Research Group (DURG) To overcome variability in dosing, a ATC/DDD method was devised to standardize by researchers in UK, Norway and Sweden and the first comprehensive national list of DDDs was published in Norway in 1975 First country to adopt the DDD methodology was the former Czechoslovakia First comprehensive national list of DDDs was published in Norway in 1975 Introduction To Drug Utilization Research, WHO International Working Group for Drugs Statistics Methodology, WHO Collaborating Centre for Drug Statistics Methodology. WHO 2003 ATC: Anatomical Therapeutic Classification DDD: Defined Daily Dose 13
  • 14.
    Drug utilization researchdeveloped quickly during the following 30 years and soon became a respectable subject for consideration at international congresses in pharmacology, pharmacy and epidemiology Successful research in drug utilization requires multidisciplinary collaboration between clinicians, clinical pharmacologists, pharmacists and epidemiologists. Introduction To Drug Utilization Research, WHO International Working Group for Drugs Statistics Methodology, WHO Collaborating Centre for Drug Statistics Methodology. WHO 2003 14
  • 15.
    Types of DUR DescriptiveAnalytical Describing patterns of drug utilization and identifying problems Link data to figures of co- morbidity, outcome of treatment, quality of care. Finally decide whether therapy is rational. Introduction To Drug Utilization Research, WHO International Working Group for Drugs Statistics Methodology, WHO Collaborating Centre for Drug Statistics Methodology. WHO 2003 15
  • 16.
    Why Drug UtilizationResearch? To Facilitate Rational Use of Drugs in Population Rationale use of drugs defined as “Patients receive medications appropriate to their clinical needs, in doses that meet their own individual requirement, for adequate period of time and at the lowest cost to them and their community” WHO 1985 Promoting Rational Use of Medicines: Core Components-WHO Policy Perspectives on Medicines. September 2002 16
  • 17.
    Description of druguse pattern Early signals of irrational use of drugs Interventions to improve drug use Quality control cycle Objectives Drug Utilization Research? Introduction To Drug Utilization Research, WHO International Working Group for Drugs Statistics Methodology, WHO Collaborating Centre for Drug Statistics Methodology. WHO 2003 17
  • 18.
    Description of DrugUse Pattern To estimate the number of patients exposed to specified drugs within a given period of time To estimate to what extent drugs are properly used, overused or underused To compare observed patterns with current recommendations and guidelines To give feedback to the prescribers on comparing with the best practice standards Introduction To Drug Utilization Research, WHO International Working Group for Drugs Statistics Methodology, WHO Collaborating Centre for Drug Statistics Methodology. WHO 2003 To determine profile of drug use and the extent to which alternative drugs are being used to treat particular conditions 18
  • 19.
    Early Signals ofIrrational Use Drug utilization patterns and costs between different regions or at different times may be compared Educational intervention required Guidelines should be reviewed in the light of actual practice Introduction To Drug Utilization Research, WHO International Working Group for Drugs Statistics Methodology, WHO Collaborating Centre for Drug Statistics Methodology. WHO 2003 19
  • 20.
    The measures toameliorate undesirable patterns should be monitored (provision of formularies, information campaigns and regulatory policies) The impact of regulatory changes should be assessed Changes in insurance or reimbursement systems should be assessed Interventions To Improve Drug Use- Follow up Effect of pharmaceutical promotional activities & educational activities should be assessed Introduction To Drug Utilization Research, WHO International Working Group for Drugs Statistics Methodology, WHO Collaborating Centre for Drug Statistics Methodology. WHO 2003 20
  • 21.
    Quality Control ofDrug Use PLAN Analyze current situation to establish a plan for improvement DO Implement Plan on Small Scale CHECK Check for expected results ACT Revise or implement plan on large scale Introduction To Drug Utilization Research, WHO International Working Group for Drugs Statistics Methodology, WHO Collaborating Centre for Drug Statistics Methodology. WHO 2003 Drug use should be controlled according to a quality control cycle that offers a systematic framework for continuous quality improvement 21
  • 22.
    Types of DrugUse Information Drug based Encounter based Patient based Prescriber based Cost based Introduction To Drug Utilization Research, WHO International Working Group for Drugs Statistics Methodology, WHO Collaborating Centre for Drug Statistics Methodology. WHO 2003 22
  • 23.
    Drug Based Information Dataon drug use on various levels, and information on indications, doses and dosage regimen For drugs with multiple indications, it will usually be important to divide data on use according to indication to allow a correct interpretation of the overall trends e.g. antibiotics Introduction To Drug Utilization Research, WHO International Working Group for Drugs Statistics Methodology, WHO Collaborating Centre for Drug Statistics Methodology. WHO 2003 23
  • 24.
    Problem or EncounterBased Information Useful to address the question – how a particular problem is managed Questions which can be addressed are: 1) Drug versus non-drug treatment 2) Does the severity influence the choice of treatment 3) Single drug use or polytherapy 4) Management of newly-presenting patients different to that of patients already receiving treatment 5) Any likely drug interactions 6) Is management evidence based? Introduction To Drug Utilization Research, WHO International Working Group for Drugs Statistics Methodology, WHO Collaborating Centre for Drug Statistics Methodology. WHO 2003 24
  • 25.
    Patient Based Information Informationon demographics and other details about patient is useful Co-morbidities influence choice of treatment Knowledge, beliefs and perceptions of patients and their attitudes to drugs are important Qualitative data useful to design consumer information & education programs Introduction To Drug Utilization Research, WHO International Working Group for Drugs Statistics Methodology, WHO Collaborating Centre for Drug Statistics Methodology. WHO 2003 25
  • 26.
    Prescriber Based Information Areprescribing profiles influenced by prescriber’s education? Are prescribing habits different for general practitioners and specialist? Does age or gender of the prescriber influence the prescribing profile? Does practice differ between urban and rural regions? Which prescribers rapidly adopt recently released drugs? Introduction To Drug Utilization Research, WHO International Working Group for Drugs Statistics Methodology, WHO Collaborating Centre for Drug Statistics Methodology. WHO 2003 26
  • 27.
    Cost Based Information Costbased information will always be important in managing policy related to drug supply, pricing and use Introduction To Drug Utilization Research, WHO International Working Group for Drugs Statistics Methodology, WHO Collaborating Centre for Drug Statistics Methodology. WHO 2003 Cost may be determined at government, health facility, hospital, health maintenance organization or other levels within the health sector 27
  • 28.
    A review onsteps involved in drug utilization review. International Journal of Research in Pharmaceutical Sciences, 11(3), 4095-4098. Planning Data Collection Evaluation Feedback of Results Intervention Re- evaluation Feedback Drug Utilization Study Cycle International Journal on Pharmaceutical and Biological Research Vol. 1(1), 2010, 11- 17 28
  • 29.
    1) Identification of therapeuticareas or drugs 2) Design of Study 3) Defining Criteria & Standards 4) Designing the data collection form 8) Implementation of Interventions 9) Re-evaluate 7) Feedback of results 5) Data Collection 6) Evaluation of Results 10) Feedback of Results Steps in conducting DUS Process A review on steps involved in drug utilization review. International Journal of Research in Pharmaceutical Sciences, 11(3), 4095-4098. 29
  • 30.
    A review onsteps involved in drug utilization review. International Journal of Research in Pharmaceutical Sciences, 11(3), 4095-4098. Step 1: Identification of Therapeutic Area or Drug for evaluation The areas for DUS can be identified by a keen observation in the medication error reports, Adverse Drug Reaction reports, from the microbiological data and also from the feedback of prescribers and Clinical Pharmacists DURs may also focus on an area where medicines are over-used and under-used 30
  • 31.
    A review onsteps involved in drug utilization review. International Journal of Research in Pharmaceutical Sciences, 11(3), 4095-4098. Commonly prescribed drugs e.g. Antibiotics, PPIs, etc. Drugs with significant drug interactions e.g. Warfarin, Phenytoin Expensive drugs e.g. LMWH, Cephalosporins Newer drugs Drugs with a narrow therapeutic index e.g. Digoxin, Theophylline, Lithium Drugs with serious ADRs e.g. aminoglycoside, NSAIDs etc. Drugs in high risk patients e.g. elderly, pediatric patients Drugs in the management of common conditions e.g. RTI or UTI, HTN, T2DM etc. Common targets 31
  • 32.
     Cross-sectional  Longitudinal Continuous longitudinal Step 2: Design of Study Observational research methods are most widely considered than experimental study methods Classification of DU Study Design  Quantitative  Qualitative Introduction To Drug Utilization Research, WHO International Working Group for Drugs Statistics Methodology, WHO Collaborating Centre for Drug Statistics Methodology. WHO 2003 OR 32
  • 33.
    Used to describepresent situation and the trends in the drug prescription and drug use at various levels of the health care system. Introduction To Drug Utilization Research, WHO International Working Group for Drugs Statistics Methodology, WHO Collaborating Centre for Drug Statistics Methodology. WHO 2003 Quantitative Assess the appropriateness of drug utilization and link the prescribing data to reasons for prescribing. This process is one of the therapeutic/prescription audit. Qualitative 33
  • 34.
    Cross-sectional Studies Introduction ToDrug Utilization Research, WHO International Working Group for Drugs Statistics Methodology, WHO Collaborating Centre for Drug Statistics Methodology. WHO 2003  Provide a snapshot of drug use at a particular time like over a year, a month or a day  Used for making comparisons with similar data collected over the same period in a different country, health facility or a ward  Can be carried out before and after an intervention  Studies can simply measure drug use, or can be utilized to assess drug use in relation to guidelines 34
  • 35.
    Longitudinal Studies  Datacan be on total drug use or on a statistically valid samples from pharmacies or medical practices  Often obtained from repeated cross sectional surveys  Data collection is continuous but the practitioner surveyed and therefore patients are continuously changing  Such data gives information about overall trends Introduction To Drug Utilization Research, WHO International Working Group for Drugs Statistics Methodology, WHO Collaborating Centre for Drug Statistics Methodology. WHO 2003 35
  • 36.
    Continuous Longitudinal Studies IntroductionTo Drug Utilization Research, WHO International Working Group for Drugs Statistics Methodology, WHO Collaborating Centre for Drug Statistics Methodology. WHO 2003 Continuous longitudinal data at individual practitioner and patient levels are obtained Database are powerful and can address a range of issues including reasons for changes in therapy, adverse effects and health outcomes. 36
  • 37.
    A review onsteps involved in drug utilization review. International Journal of Research in Pharmaceutical Sciences, 11(3), 4095-4098. Criteria are always statements, which are determined earlier that can enable oneself to provide uncompromised drug use, wherein the quality of actual drug use can be compared. Research literature must be used to validate the formed criteria scientifically. The developed criteria should be scientifically based and supported by the research literature. This should be authentic and must have only one interpretation and also should be readily measured. Step 3: Define criteria and standards 37
  • 38.
    A review onsteps involved in drug utilization review. International Journal of Research in Pharmaceutical Sciences, 11(3), 4095-4098. Step 4: Design the Data Collection Form It is important to limit data collection to only the most important and relevant aspects of drug use It is important to have a good structure for a data collection form because a good frame reflects the accuracy of the collected data Patient demographics Prescriber details Indication/ Contraindications Side/adverse effects Dosing information Drug or drug class duplication Drug interactions Monitoring of drug therapy Patient education/instructions Cost of therapy Aspects of drug use commonly surveyed International Journal on Pharmaceutical and Biological Research Vol. 1(1), 2010, 11- 17 38
  • 39.
    A review onsteps involved in drug utilization review. International Journal of Research in Pharmaceutical Sciences, 11(3), 4095-4098. Step 5: Data Collection Physicians, pharmacists and nurses make ideal data collectors. Data collectors should be familiar with the collection of data from the Patient’s case note. 39
  • 40.
    Data from Drug Regulatory agencies Supplier (Distribution) Data Large Database Practice Setting Data Community SettingData A review on steps involved in drug utilization review. International Journal of Research in Pharmaceutical Sciences, 11(3), 4095-4098. Sources of Data 40
  • 41.
    Introduction To DrugUtilization Research, WHO International Working Group for Drugs Statistics Methodology, WHO Collaborating Centre for Drug Statistics Methodology. WHO 2003 Large Databases  Efficient use of health care resources – Computer databases or medical record sections  Data may be collected on drug sale, drug distribution chain, medical bills or samples of prescription  May be international, national or local- comparative studies can be planned at various levels.  May be diagnosis linked or non-diagnosis linked  Diagnosis linked data enable drug use to be analyzed according to patients characteristics, therapeutic groups, diseases or conditions and, clinical outcome. 41
  • 42.
    Introduction To DrugUtilization Research, WHO International Working Group for Drugs Statistics Methodology, WHO Collaborating Centre for Drug Statistics Methodology. WHO 2003  Are repositories of data on which drugs have been registered for use, withdrawn or banned within a country.  Agencies have the legal responsibility of ensuring the availability of safe, efficacious and good quality drugs  Possible to obtain data on the number of drugs registered in a country from such agencies.  Importation data like product type (i.e. generic or branded), volume, port of origin, country of manufacture, batch number and expiry date may be collected. Data from Drug Regulatory Agencies 42
  • 43.
    Introduction To DrugUtilization Research, WHO International Working Group for Drugs Statistics Methodology, WHO Collaborating Centre for Drug Statistics Methodology. WHO 2003 Supplier (Distribution) Data  Data on supplier can be obtained from, drug importation; local manufacture; customs service, wholesalers  In countries where licenses are required from drug regulatory authorities before importation of drugs  Generally be used to describe total quantities of specific drug or drug group, origins of supplies and type (i.e. branded or generic)  Distribution at different levels of supplies can be compared 43
  • 44.
    Introduction To DrugUtilization Research, WHO International Working Group for Drugs Statistics Methodology, WHO Collaborating Centre for Drug Statistics Methodology. WHO 2003 Practice Setting Data Prescribing Data Dispensing Data Aggregate Data OTC & Pharmacist Prescribed Data Telephone & Internet Prescribed data 44
  • 45.
    Prescribing Data Usually extractedfrom outpatient and inpatient prescriptions. Information that may be obtained from prescriptions includes  Patient’s demography  Drug name, dosage form, strength, dose, frequency of administration and duration of treatment.  Where diagnoses are noted on prescriptions, is possible to link drug use to indications.  Trends in utilization for specific drugs and diseases can also be established. Introduction To Drug Utilization Research, WHO International Working Group for Drugs Statistics Methodology, WHO Collaborating Centre for Drug Statistics Methodology. WHO 2003 45
  • 46.
    Dispensing Data Drug dispensingis a process that ends with a client leaving a drug outlet with a defined quantity of medication and instructions for using it Information available from dispensers may include  Drug (s) prescribed  Dose(s) prescribed  Average number of items per prescription  Percentage of items prescribed that were actually supplied (an indicator of availability)  Percentage of drugs adequately labeled  Quantity of medications dispensed  Cost of each item or prescription. Introduction To Drug Utilization Research, WHO International Working Group for Drugs Statistics Methodology, WHO Collaborating Centre for Drug Statistics Methodology. WHO 2003 46
  • 47.
    Aggregate Data Source include– Hospital pharmacy stock and dispensing records, medication error records, adverse drug reaction records and patient medical records Used to obtain information on  The cost of individual drugs and classes of drug  The most and least expensive drugs  The consumption of specific products  The prevalence of adverse drug reactions  The prevalence of medication errors  The percentage of the budget spent on specific drugs or classes of drug Introduction To Drug Utilization Research, WHO International Working Group for Drugs Statistics Methodology, WHO Collaborating Centre for Drug Statistics Methodology. WHO 2003 47
  • 48.
    OTC & PharmacistPrescribed Data  Pharmacists and other drug outlet managers may prescribe over the counter (OTC) preparations or pharmacist prepared drugs that do not require prescription by physician  When such information is available from stock or dispensing records, it broadens the understanding of drug utilization patterns Introduction To Drug Utilization Research, WHO International Working Group for Drugs Statistics Methodology, WHO Collaborating Centre for Drug Statistics Methodology. WHO 2003 48
  • 49.
    Telephone & InternetPrescribed data  Mostly happens in developed countries  Innovative ways have to be devised to collect information on this type of transaction Introduction To Drug Utilization Research, WHO International Working Group for Drugs Statistics Methodology, WHO Collaborating Centre for Drug Statistics Methodology. WHO 2003 49
  • 50.
    Community Setting Data Drugs available in households have either been prescribed or dispensed at health facilities, purchased at pharmacy or are over the counter medications.  The drugs may be for the treatment of current illness or are left over from previous illness.  Data can be collected by performing household surveys, counting left over pills etc. Introduction To Drug Utilization Research, WHO International Working Group for Drugs Statistics Methodology, WHO Collaborating Centre for Drug Statistics Methodology. WHO 2003 50
  • 51.
    Step 6: EvaluateResults Summarize data into the major categories of results Check where exactly the data shows deviation from the guideline and usage criteria Evaluate reasons for this deviation Reasons for deviation may include: •◦ Drug being used for new indication •◦ Outdated procedures •◦ Inadequate resources •◦ Gaps in knowledge or misinformation / misunderstanding Introduction To Drug Utilization Research, WHO International Working Group for Drugs Statistics Methodology, WHO Collaborating Centre for Drug Statistics Methodology. WHO 2003 51
  • 52.
    Introduction To DrugUtilization Research, WHO International Working Group for Drugs Statistics Methodology, WHO Collaborating Centre for Drug Statistics Methodology. WHO 2003 A review on steps involved in drug utilization review. International Journal of Research in Pharmaceutical Sciences, 11(3), 4095-4098. Parameters used for Evaluation of Data Drug Utilization Metrics Defined Daily Dosing (DDD) Prescribed Daily Dosing (PDD) Other Units for Presentation of Volume Cost Drug Use Indicators Prescribing Indicators Patient Care Indicators Facility Indicators Drug Classification System 52
  • 53.
    A drug classificationsystem represents a common language for describing the drug assortment in a country or a region and is a prerequisite for national and international comparison of drug utilization data The main purpose of having an international standard is to be able to compare data between countries Introduction To Drug Utilization Research, WHO International Working Group for Drugs Statistics Methodology, WHO Collaborating Centre for Drug Statistics Methodology. WHO 2003 Drug Classification System 53
  • 54.
    Anatomical Therapeutic Chemicals (ATC) AnatomicalClassification (AT) Developed by the Norwegian researchers Developed by European Pharmaceutical Market Research Association (EPhMRA) Drug Classification includes a therapeutic/pharmacological/ch emical subgroup as fourth level and the chemical substance as fifth level Drugs classified in groups at three or four different levels ATC classification is also the basis for classification of ADR used by the WHO Collaborating Centre for International Drug Monitoring in Uppsala, Sweden AT classification is used by the International Marketing Services for providing market research statistics to the pharmaceutical industry Introduction To Drug Utilization Research, WHO International Working Group for Drugs Statistics Methodology, WHO Collaborating Centre for Drug Statistics Methodology. WHO 2003 54
  • 55.
    A medicinal productcan be given more than one ATC code if it is available in two or more strengths and formulations with clearly different therapeutic uses. Bromocriptine at lower strengths are used as prolactin inhibitors (G02) whereas at higher strengths is used for Parkinson’s Disease (N04) Introduction To Drug Utilization Research, WHO International Working Group for Drugs Statistics Methodology, WHO Collaborating Centre for Drug Statistics Methodology. WHO 2003 55
  • 56.
    56 A07EA01 Intestinal anti-inflammatoryagents (enemas and rectal foams) C05AA04 Antihaemorrhoidals for topical use (Rectal suppositories) D07AA03 Dermatological preparations (creams, ointments, lotions) H02AD02 Corticosteroids for systemic use (Tablets, injections) R01AD02 Nasal decongestants (nasal sprays, drops) S02BA03 Otologicals (ear drops) Introduction To Drug Utilization Research, WHO International Working Group for Drugs Statistics Methodology, WHO Collaborating Centre for Drug Statistics Methodology. WHO 2003 Different formulations of Prednisolone
  • 57.
    57 Bone disease/Osteoporosis ATC group Vitamin Dand Analogues A11CC Calcium supplements A12A Estrogens/Tibolon/SERM G03C/G03F/G03X Parathyroid hormones H05AA Calcitonin H05BA Biphosphonates M05BA/M05BB Introduction To Drug Utilization Research, WHO International Working Group for Drugs Statistics Methodology, WHO Collaborating Centre for Drug Statistics Methodology. WHO 2003 One Indication: Several ATC codes
  • 58.
    Defined Daily Dosing(DDD) It is the average maintenance dose per day for a drug used for its main indication in adults DDD is a unit of measurement and does not necessarily correspond to the recommended or Prescribed Daily Dosing (PDD) It give a rough estimate of consumption and not an exact picture of actual use. Introduction To Drug Utilization Research, WHO International Working Group for Drugs Statistics Methodology, WHO Collaborating Centre for Drug Statistics Methodology. WHO 2003 Drug Utilization Metrics 58
  • 59.
    DDDs provide afixed unit of measurement independent of price, currency, package size and strength enabling the researcher to assess trends in drug consumption and to perform comparisons between population groups Introduction To Drug Utilization Research, WHO International Working Group for Drugs Statistics Methodology, WHO Collaborating Centre for Drug Statistics Methodology. WHO 2003 DDD per 1000 inhabitants per day-- OPD patients DDD per 100 bed days– Inpatient patients DDDs per inhabitant per year– Drugs used for short duration 59
  • 60.
    Introduction To DrugUtilization Research, WHO International Working Group for Drugs Statistics Methodology, WHO Collaborating Centre for Drug Statistics Methodology. WHO 2003 DDDs per 1000 inhabitants per day:- Provide a rough estimate of the proportion of the study population treated daily with a particular drug or group of drugs Example: 10 DDDs per 1000 inhabitants per day indicates that 1% of the population on average might receive a certain drug or group of drugs daily Most useful for chronically used drugs 60
  • 61.
    DDDs per 100bed-days:- Applied when in-patients are considered Example: 70 DDDs per 100 bed-days of hypnotics suggest that 70% of inpatients might receive a DDD of a hypnotic everyday. Introduction To Drug Utilization Research, WHO International Working Group for Drugs Statistics Methodology, WHO Collaborating Centre for Drug Statistics Methodology. WHO 2003 61
  • 62.
    Introduction To DrugUtilization Research, WHO International Working Group for Drugs Statistics Methodology, WHO Collaborating Centre for Drug Statistics Methodology. WHO 2003 DDDs per inhabitants per year:- E.g. - 5 DDDs per inhabitant per year indicates that the utilization is equivalent to the treatment of every inhabitant with a five-day course during a certain year. 62
  • 63.
    Prescribed Daily Dose(PDD) It is the average dose prescribed according to a representative sample of prescription It can be determined from studies of prescriptions or medical or pharmacy records It is important to link the PDD to the diagnosis on which the dosage is based, especially is the dosage differs from one indication to another Introduction To Drug Utilization Research, WHO International Working Group for Drugs Statistics Methodology, WHO Collaborating Centre for Drug Statistics Methodology. WHO 2003 63
  • 64.
    Introduction To DrugUtilization Research, WHO International Working Group for Drugs Statistics Methodology, WHO Collaborating Centre for Drug Statistics Methodology. WHO 2003 Other Units for Presentation of Volume Physical units (gm, Kg, litres), number of packages or tablets, number of prescriptions are also used for quantifying drug utilization. Grams of active ingredient:  Drugs with low potency will account for a larger fraction of the total than drugs with high potency  Combined products may also contain different amounts of active ingredients from plain products 64
  • 65.
    Introduction To DrugUtilization Research, WHO International Working Group for Drugs Statistics Methodology, WHO Collaborating Centre for Drug Statistics Methodology. WHO 2003 Number of Tablets: Counting numbers of tablets does not reflect the variations in strengths of tablets, with the result that low-strength preparations contribute relatively more than high- strength preparations to the total numbers Number of Prescription: Do not accurately reflect total use, unless total quantities of drugs per prescription are also considered. ◦ Valuable in measuring the frequency of prescriptions 65
  • 66.
    Introduction To DrugUtilization Research, WHO International Working Group for Drugs Statistics Methodology, WHO Collaborating Centre for Drug Statistics Methodology. WHO 2003 Cost  Cost figures are suitable for an overall analysis of expenditure on drugs  International comparisons based on cost parameters can be misleading and have limited value in the evaluation of drug use.  Difficulties in evaluation may be due to Price differences between alternative preparations Fluctuations in currency Changes in price 66
  • 67.
    Drug Use Indicators Prescribingindicators •Average number of drugs per encounter •Percentage of drugs prescribed by generic name •Percentage of encounters with an antibiotic prescribed •Percentage of encounters with an injection prescribed •Percentage of drugs prescribed from essential drugs list or formulary Patient care indicators ◦ Average consultation time ◦ Average dispensing time ◦ Percentage of drugs actually dispensed ◦ Percentage of drugs adequately labelled ◦ Patients' knowledge of correct dosage Facility indicators ◦ Availability of copy of essential drugs list or formulary ◦ Availability of key drugs ◦ Availability of clinical guidelines J Pharmacol Pharmacother. 2016 Jan-Mar; 7(1): 51–54. Introduction To Drug Utilization Research, WHO International Working Group for Drugs Statistics Methodology, WHO Collaborating Centre for Drug Statistics Methodology. WHO 2003 67
  • 68.
    Prescribing Indicators Average =Total number of different drug products prescribed -------------------------------------------------------------------- Number of encounters surveyed Average number of drugs per encounter This indicator is aimed at assessing the extent of poly-pharmacy. The WHO proposes that this should be <2 Percentage = Number of drugs prescribed by generic name ---------------------------------------------------------------- X 100 Total number of drugs prescribed Percentage (%) of drugs prescribed by generic name This indicator is aimed at measuring prescriber's tendency to prescribe medicines using generic or international nonproprietary name J Pharmacol Pharmacother. 2016 Jan-Mar; 7(1): 51–54. 69
  • 69.
    Percentage = Numberof patient encounters during which an antibiotic is prescribed ---------------------------------------------------------------------------------------------- X 100 Number of encounters surveyed Percentage of encounters with an antibiotic prescribed This indicator assesses the frequency of antibiotic prescribing among primary health care (PHC) providers. Percentage = Number of patient encounters during which an injection is prescribed ----------------------------------------------------------------------------------------------- X 100 Number of encounters surveyed Percentage of encounters with an injection prescribed This indicator describes the frequency with which injectable forms of medicines are prescribed. Investigators should be aware of immunizations that are not counted as injections. J Pharmacol Pharmacother. 2016 Jan-Mar; 7(1): 51–54. 70
  • 70.
    Percentage = Numberof products prescribed which are listed on the essential drug list or local formulary --------------------------------------------------------------------------------------------------------------------------- X 100 Total number of drugs prescribed Percentage of drugs prescribed from essential drug list or formulary The main focus of this indicator is to access whether prescribing practices conform to drug use policy as pertaining to the use of essential medicines list (EML). J Pharmacol Pharmacother. 2016 Jan-Mar; 7(1): 51–54. 71
  • 71.
    Patient Care Indicators Average= Total time for a series of consultation --------------------------------------------------------- Number of consultations Average consultation time Average = Total time for dispensing drugs to a series of patients ---------------------------------------------------------------------- - Number of encounters Average dispensing time BMC Health Services Research (2016) 16:144 Percentage = Number of drugs actually dispensed at the health facility --------------------------------------------------------------------------- X 100 Total number of drug prescribed Percentage of drugs actually dispensed 72
  • 72.
    Number of drugpackages containing at least patient name, drug name and when the drug should be taken Percentage = ------------------------------------------------------------------------ X 100 Total number of drug packages dispensed Percentage of drugs adequately labelled Number of patients who can adequately report the dosage schedule for all the drugs Percentage = ----------------------------------------------------------------------------------- X 100 Total number of patients interviewed Patient’s knowledge of correct dosage BMC Health Services Research (2016) 16:144 73
  • 73.
    Facility Indicators Availability ofcopy of essential drugs list or formulary Scored as Yes or no Availability of clinical guidelines Scored as Yes or No Availability of Key drugs Percentage = Number of specified products actually in stock --------------------------------------------------------------------------- X 100 Total number of drug on the checklist BMC Health Services Research (2016) 16:144 74
  • 74.
    Step 7: Feedbackof Results  Preparation of a scientific interpretation of the results.  Success of any DUS depends on feedback of results to prescribers, other hospital staffs involved in the study and to administrative heads.  The results can also be circulated to hospital staff via newsletters or the hospital’s academic meetings. A review on steps involved in drug utilization review. International Journal of Research in Pharmaceutical Sciences, 11(3), 4095-4098. 75
  • 75.
    Step 8: Implementation& Interventions ◦ Educational - educational meetings, development of protocols, letters to individual physicians. ◦ Operational - modification of drug order forms, development of stringent drug use policy, manual or computerized reminders, prescribing restrictions, formulary additions/deletions, extent of pharmaceutical promotion. If a drug use problem is identified the next step is to consider how the problem can be addressed Interventions A review on steps involved in drug utilization review. International Journal of Research in Pharmaceutical Sciences, 11(3), 4095-4098. 76
  • 76.
    Step 9: Re-evaluate Drug use and prescribing patterns need to be monitored to determine the success of intervention  Re-evaluation is usually done 3-12 months after the introduction of the intervention  Collection of data as in original DUS  Should be a continuous process at regular interval A review on steps involved in drug utilization review. International Journal of Research in Pharmaceutical Sciences, 11(3), 4095-4098. 77
  • 77.
    Step 10:Feedback ofResults  Results of the DUS is to be circulated  Opinions about success of interventions and improvement of drug use are to be obtained  Analyze and act accordingly A review on steps involved in drug utilization review. International Journal of Research in Pharmaceutical Sciences, 11(3), 4095-4098. 78
  • 78.
  • 79.
    Future Perspective  Thestudy of drug utilization in an evolving field.  The use of large computerized databases that allow linkage of drug utilization data to diagnosis, subject to some inherent limitations, is contributing to expand this area of study.  Importance of drug utilization studies in pharmacoepidemiology has been increasing due to their close association to other areas like- public health, pharmacovigilance, pharmacoeconomics and pharmacogenetics International Journal on Pharmaceutical and Biological Research Vol. 1(1), 2010, 11- 17 80
  • 80.

Editor's Notes

  • #6 The patients are limited in number and the study duration because the studies uptill phase III are sponsored mainly by pharamaceutical companies and not by research institues. Thus, money is the limiting factor. Thus, limited number of patients and duration of study to limit the cost of trials. The more number of patients in the trial and more durartion would mean more expensive the drug and more difficult the marketing strategies. Strict inclusion and exclusion criteria ensures the ideal patients getting the drugs and thus showing ideal benefits. Drugs are provided free of cost in trials thus, ensuring adherance to the therapy. Even otherwise the complaince is monitored by various means thus giving a DIIFERENT pitcher all together to the adherence to the management.
  • #9 NIS: Observational study capturing the efficacy and safety data of drug only on on-label usage. No off-label usage is captured. Drugs are not free and has to be purchased by the patients. They don’t need regulatory approvals but it’s a good practice to register it on CTRI. LST: Hybrid between RCT and observational trails e.g. cohort studies
  • #10 Study of the marketing, distribution, prescription, and use of drugs in a society, with special emphasis on the resulting medical, social and economic consequences.
  • #14 The first work was conducted in Northeren Europe and UK. Pioneers were Arthur Engel in Sweden and Pieter Siderius in Holland. It was initaited for marketing purpose only. Findings demonstrtaed remarkable differnces in the sales of antibiotics in six European countries between 1966 and 1967. WHO got inspired and conducted the first meeting on drug consumption in 1969. This led to making of WHO European Drug Utilization Research Group (DURG). There was considerable variation in the dosing of various drugs within countries. Oin order to standardize tye doses ATC/DDD method was devised.
  • #28 Indication based: for drugs with multiple indications, it will usually be important to divide data on use according to indication to allow a correct interpretation of the overall trends Example is that of antihypertensive. The overall data might suggest that the relative use of diuretics is comparable to that of ACEIs and higher than CCBs. However, analysis of the data according to indications may reveal that 75% of ACEIs are used to treat HT whereas only 43% of diuretics are used to treat this indication. Most of high ceiling diuretics are used to treat hypertension. Another example is that of Antibiotics where breaking down the usage as per the indication is more fruitful as compared to analysis it as a whole. Prescribed Daily Dose: It is the average daily dose prescribed as obtained from a representative sample of prescription. The PDDs differ between countries and ethnic groups and even between areas or health facilities within the same country. The PDD will also also often differ for different indications of the same drug. Problem based: As an example consider how a problem-based information about the management of hypertension might be used. Initially, concordance with guidelines for drug treatment or non-drug management of BP and other risk factor might be assessed. Where drug treatment is used, the proportion of patients treated with each of the drug groups gives an overall picture of management. Other questions that can be asked are 1) Does the severity of hypertension influence the choice of single or combination therapy? 2) Is the management of newly diagnosed patients different than the patients already receiving anti-hypertensives 3) Any drug interactions 4) Drug interaction Problem based information can help understand the pharmacotherpeutic tradition and other therapeutic approaches. Example. Excessive use of ulcer surgery in Estonia because lack of antiulcer drugs. Patient Information: Info on demographic factors are important. Age group is important to co-relate the disease and drugs. The co-morbidities of the patient group may be important in determining the choice of treatment and predicting possible adverse events. Example beta blockers for treatment of HTN should be avoided in patients with asthama. KAP assessment are important pressure put by patients on doctors to prescribe antibiotics. Prescribing information: