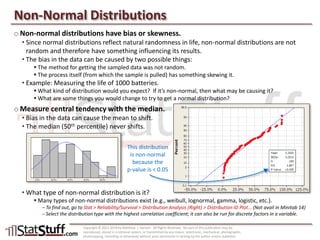
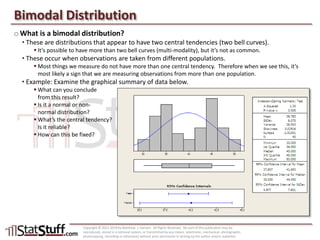
SlideShare a Scribd company logo
Section & Lesson #:
Pre-Requisite Lessons:
Complex Tools + Clear Teaching = Powerful Results
Distributions: Non-Normal
Six Sigma-Measure – Lesson 10
A review of non-normal and bi-modal distributions and how to test them
using a normality test.
Six Sigma-Measure #09 – Distributions: Normal
Copyright © 2011-2019 by Matthew J. Hansen. All Rights Reserved. No part of this publication may be reproduced, stored in a retrieval system, or transmitted by any means
(electronic, mechanical, photographic, photocopying, recording or otherwise) without prior permission in writing by the author and/or publisher.
Non-Normal Distributions
o Non-normal distributions have bias or skewness.
• Since normal distributions reflect natural randomness in life, non-normal distributions are not
random and therefore have something influencing its results.
• The bias in the data can be caused by two possible things:
 The method for getting the sampled data was not random.
 The process itself (from which the sample is pulled) has something skewing it.
• Example: Measuring the life of 1000 batteries.
 What kind of distribution would you expect? If it’s non-normal, then what may be causing it?
 What are some things you would change to try to get a normal distribution?
o Measure central tendency with the median.
• Bias in the data can cause the mean to shift.
• The median (50th percentile) never shifts.
• What type of non-normal distribution is it?
 Many types of non-normal distributions exist (e.g., weibull, lognormal, gamma, logistic, etc.).
– To find out, go to Stat > Reliability/Survival > Distribution Analysis (Right) > Distribution ID Plot… (Not avail in Minitab 14)
– Select the distribution type with the highest correlation coefficient; it can also be run for discrete factors in a variable.
Copyright © 2011-2019 by Matthew J. Hansen. All Rights Reserved. No part of this publication may be
reproduced, stored in a retrieval system, or transmitted by any means (electronic, mechanical, photographic,
photocopying, recording or otherwise) without prior permission in writing by the author and/or publisher.
This distribution
is non-normal
because the
p-value is < 0.05
Bimodal Distribution
o What is a bimodal distribution?
• These are distributions that appear to have two central tendencies (two bell curves).
 It’s possible to have more than two bell curves (multi-modality), but it’s not as common.
• These occur when observations are taken from different populations.
 Most things we measure do not have more than one central tendency. Therefore when we see this, it’s
most likely a sign that we are measuring observations from more than one population.
• Example: Examine the graphical summary of data below.
 What can you conclude
from this result?
 Is it a normal or non-
normal distribution?
 What’s the central tendency?
Is it reliable?
 How can this be fixed?
Copyright © 2011-2019 by Matthew J. Hansen. All Rights Reserved. No part of this publication may be
reproduced, stored in a retrieval system, or transmitted by any means (electronic, mechanical, photographic,
photocopying, recording or otherwise) without prior permission in writing by the author and/or publisher.
Practical Application
o Open the “Minitab Sample Data.MPJ” file and try to do the following:
• Run a normality test on each continuous metric.
• Which metrics are non-normally distributed? How can you prove it?
• Which metric (if any) has multi-modality?
o Next, pull some historical data for at least 2 continuous metrics used by your
organization and try following the same steps described above.
Copyright © 2011-2019 by Matthew J. Hansen. All Rights Reserved. No part of this publication may be
reproduced, stored in a retrieval system, or transmitted by any means (electronic, mechanical, photographic,
photocopying, recording or otherwise) without prior permission in writing by the author and/or publisher.
4

More Related Content

What's hot

Data Types with Matt Hansen at StatStuff
Data Types with Matt Hansen at StatStuffData Types with Matt Hansen at StatStuff
Data Types with Matt Hansen at StatStuff
Matt Hansen
 
MSA – Overview
MSA – OverviewMSA – Overview
MSA – Overview
Matt Hansen
 
Measure Phase Roadmap (Level 3) with Matt Hansen at StatStuff
Measure Phase Roadmap (Level 3) with Matt Hansen at StatStuffMeasure Phase Roadmap (Level 3) with Matt Hansen at StatStuff
Measure Phase Roadmap (Level 3) with Matt Hansen at StatStuff
Matt Hansen
 
Rational Sub-Grouping
Rational Sub-GroupingRational Sub-Grouping
Rational Sub-Grouping
Matt Hansen
 
MSA – Attribute ARR Test
MSA – Attribute ARR TestMSA – Attribute ARR Test
MSA – Attribute ARR Test
Matt Hansen
 
Progress in AI and its application to Asset Management.pptx
Progress in AI and its application to Asset Management.pptxProgress in AI and its application to Asset Management.pptx
Progress in AI and its application to Asset Management.pptx
Derryn Knife
 
Analysis of "A Predictive Analytics Primer" by Tom Davenport
Analysis of "A Predictive Analytics Primer" by Tom DavenportAnalysis of "A Predictive Analytics Primer" by Tom Davenport
Analysis of "A Predictive Analytics Primer" by Tom Davenport
Aloukik Aditya
 
Carma internet research module sample size considerations
Carma internet research module   sample size considerationsCarma internet research module   sample size considerations
Carma internet research module sample size considerations
Syracuse University
 
ML Drift - How to find issues before they become problems
ML Drift - How to find issues before they become problemsML Drift - How to find issues before they become problems
ML Drift - How to find issues before they become problems
Amy Hodler
 
How to calculate power in statistics
How to calculate power in statisticsHow to calculate power in statistics
How to calculate power in statistics
Stat Analytica
 
ICAR - IFPRI- Power Calculation
ICAR - IFPRI- Power CalculationICAR - IFPRI- Power Calculation
What Is a Model, Anyhow?
What Is a Model, Anyhow?What Is a Model, Anyhow?
What Is a Model, Anyhow?
Bill Cassill
 
Black Swan Risk Management - Aditya Yadav
Black Swan Risk Management - Aditya YadavBlack Swan Risk Management - Aditya Yadav
Black Swan Risk Management - Aditya Yadav
Aditya Yadav
 
1 10 everyday reasons why statistics are important
1   10 everyday reasons why statistics are important1   10 everyday reasons why statistics are important
1 10 everyday reasons why statistics are important
Jason Edington
 
AIG Seven QC Tools
AIG Seven QC ToolsAIG Seven QC Tools
AIG Seven QC Tools
advanceinnovationgroup
 
Top Five Ideas -- Statistics for Project Management
Top Five Ideas -- Statistics for Project ManagementTop Five Ideas -- Statistics for Project Management
Top Five Ideas -- Statistics for Project Management
John Goodpasture
 
#ATAGTR2018 Presentation "The Subtle Influence of Cognitive Biases on Testing...
#ATAGTR2018 Presentation "The Subtle Influence of Cognitive Biases on Testing...#ATAGTR2018 Presentation "The Subtle Influence of Cognitive Biases on Testing...
#ATAGTR2018 Presentation "The Subtle Influence of Cognitive Biases on Testing...
Agile Testing Alliance
 
East Infosheet
East InfosheetEast Infosheet
East Infosheet
Cytel
 
What people analytics can not capture.
What people analytics can not capture.What people analytics can not capture.
What people analytics can not capture.
Tanya Gupta
 
The galaxy of data analysis - School of ai Port Harcourt meetup
The galaxy of data analysis - School of ai Port Harcourt meetupThe galaxy of data analysis - School of ai Port Harcourt meetup
The galaxy of data analysis - School of ai Port Harcourt meetup
halifaxchester
 

What's hot (20)

Data Types with Matt Hansen at StatStuff
Data Types with Matt Hansen at StatStuffData Types with Matt Hansen at StatStuff
Data Types with Matt Hansen at StatStuff
 
MSA – Overview
MSA – OverviewMSA – Overview
MSA – Overview
 
Measure Phase Roadmap (Level 3) with Matt Hansen at StatStuff
Measure Phase Roadmap (Level 3) with Matt Hansen at StatStuffMeasure Phase Roadmap (Level 3) with Matt Hansen at StatStuff
Measure Phase Roadmap (Level 3) with Matt Hansen at StatStuff
 
Rational Sub-Grouping
Rational Sub-GroupingRational Sub-Grouping
Rational Sub-Grouping
 
MSA – Attribute ARR Test
MSA – Attribute ARR TestMSA – Attribute ARR Test
MSA – Attribute ARR Test
 
Progress in AI and its application to Asset Management.pptx
Progress in AI and its application to Asset Management.pptxProgress in AI and its application to Asset Management.pptx
Progress in AI and its application to Asset Management.pptx
 
Analysis of "A Predictive Analytics Primer" by Tom Davenport
Analysis of "A Predictive Analytics Primer" by Tom DavenportAnalysis of "A Predictive Analytics Primer" by Tom Davenport
Analysis of "A Predictive Analytics Primer" by Tom Davenport
 
Carma internet research module sample size considerations
Carma internet research module   sample size considerationsCarma internet research module   sample size considerations
Carma internet research module sample size considerations
 
ML Drift - How to find issues before they become problems
ML Drift - How to find issues before they become problemsML Drift - How to find issues before they become problems
ML Drift - How to find issues before they become problems
 
How to calculate power in statistics
How to calculate power in statisticsHow to calculate power in statistics
How to calculate power in statistics
 
ICAR - IFPRI- Power Calculation
ICAR - IFPRI- Power CalculationICAR - IFPRI- Power Calculation
ICAR - IFPRI- Power Calculation
 
What Is a Model, Anyhow?
What Is a Model, Anyhow?What Is a Model, Anyhow?
What Is a Model, Anyhow?
 
Black Swan Risk Management - Aditya Yadav
Black Swan Risk Management - Aditya YadavBlack Swan Risk Management - Aditya Yadav
Black Swan Risk Management - Aditya Yadav
 
1 10 everyday reasons why statistics are important
1   10 everyday reasons why statistics are important1   10 everyday reasons why statistics are important
1 10 everyday reasons why statistics are important
 
AIG Seven QC Tools
AIG Seven QC ToolsAIG Seven QC Tools
AIG Seven QC Tools
 
Top Five Ideas -- Statistics for Project Management
Top Five Ideas -- Statistics for Project ManagementTop Five Ideas -- Statistics for Project Management
Top Five Ideas -- Statistics for Project Management
 
#ATAGTR2018 Presentation "The Subtle Influence of Cognitive Biases on Testing...
#ATAGTR2018 Presentation "The Subtle Influence of Cognitive Biases on Testing...#ATAGTR2018 Presentation "The Subtle Influence of Cognitive Biases on Testing...
#ATAGTR2018 Presentation "The Subtle Influence of Cognitive Biases on Testing...
 
East Infosheet
East InfosheetEast Infosheet
East Infosheet
 
What people analytics can not capture.
What people analytics can not capture.What people analytics can not capture.
What people analytics can not capture.
 
The galaxy of data analysis - School of ai Port Harcourt meetup
The galaxy of data analysis - School of ai Port Harcourt meetupThe galaxy of data analysis - School of ai Port Harcourt meetup
The galaxy of data analysis - School of ai Port Harcourt meetup
 

Similar to Distributions: Non-Normal with Matt Hansen at StatStuff

Statistical Process Control (SPC)
Statistical Process Control (SPC)Statistical Process Control (SPC)
Statistical Process Control (SPC)
Matt Hansen
 
Overview of Statistical Terms and Concepts with Matt Hansen at StatStuff
Overview of Statistical Terms and Concepts with Matt Hansen at StatStuffOverview of Statistical Terms and Concepts with Matt Hansen at StatStuff
Overview of Statistical Terms and Concepts with Matt Hansen at StatStuff
Matt Hansen
 
Hypothesis Testing: Central Tendency – Non-Normal (Nonparametric Overview)
Hypothesis Testing: Central Tendency – Non-Normal (Nonparametric Overview)Hypothesis Testing: Central Tendency – Non-Normal (Nonparametric Overview)
Hypothesis Testing: Central Tendency – Non-Normal (Nonparametric Overview)
Matt Hansen
 
Descriptive Statistics
Descriptive StatisticsDescriptive Statistics
Descriptive Statistics
Matt Hansen
 
Comparing Distributions and Using the Graphical Summary
Comparing Distributions and Using the Graphical SummaryComparing Distributions and Using the Graphical Summary
Comparing Distributions and Using the Graphical Summary
Matt Hansen
 
Control Charts: Finding the Right Control Chart
Control Charts: Finding the Right Control ChartControl Charts: Finding the Right Control Chart
Control Charts: Finding the Right Control Chart
Matt Hansen
 
Testing for Multicollinearity
Testing for MulticollinearityTesting for Multicollinearity
Testing for Multicollinearity
Matt Hansen
 
Hypothesis Testing: Central Tendency – Non-Normal (Compare 1:Standard)
Hypothesis Testing: Central Tendency – Non-Normal (Compare 1:Standard)Hypothesis Testing: Central Tendency – Non-Normal (Compare 1:Standard)
Hypothesis Testing: Central Tendency – Non-Normal (Compare 1:Standard)
Matt Hansen
 
Hypothesis Testing: Spread (Compare 1:1)
Hypothesis Testing: Spread (Compare 1:1)Hypothesis Testing: Spread (Compare 1:1)
Hypothesis Testing: Spread (Compare 1:1)
Matt Hansen
 
Hypothesis Testing: Relationships (Overview)
Hypothesis Testing: Relationships (Overview)Hypothesis Testing: Relationships (Overview)
Hypothesis Testing: Relationships (Overview)
Matt Hansen
 
Control Charts: P Chart
Control Charts: P ChartControl Charts: P Chart
Control Charts: P Chart
Matt Hansen
 
Control Charts: U Chart
Control Charts: U ChartControl Charts: U Chart
Control Charts: U Chart
Matt Hansen
 
Hypothesis Testing: Spread (Compare 1:Standard)
Hypothesis Testing: Spread (Compare 1:Standard)Hypothesis Testing: Spread (Compare 1:Standard)
Hypothesis Testing: Spread (Compare 1:Standard)
Matt Hansen
 
Hypothesis Testing: Central Tendency – Non-Normal (Compare 1:1)
Hypothesis Testing: Central Tendency – Non-Normal (Compare 1:1)Hypothesis Testing: Central Tendency – Non-Normal (Compare 1:1)
Hypothesis Testing: Central Tendency – Non-Normal (Compare 1:1)
Matt Hansen
 
Hypothesis Testing: Central Tendency – Non-Normal (Compare 2+ Factors)
Hypothesis Testing: Central Tendency – Non-Normal (Compare 2+ Factors)Hypothesis Testing: Central Tendency – Non-Normal (Compare 2+ Factors)
Hypothesis Testing: Central Tendency – Non-Normal (Compare 2+ Factors)
Matt Hansen
 
Hypothesis Testing: Proportions (Compare 2+ Factors)
Hypothesis Testing: Proportions (Compare 2+ Factors)Hypothesis Testing: Proportions (Compare 2+ Factors)
Hypothesis Testing: Proportions (Compare 2+ Factors)
Matt Hansen
 
Hypothesis Testing: Central Tendency – Normal (Compare 1:Standard)
Hypothesis Testing: Central Tendency – Normal (Compare 1:Standard)Hypothesis Testing: Central Tendency – Normal (Compare 1:Standard)
Hypothesis Testing: Central Tendency – Normal (Compare 1:Standard)
Matt Hansen
 
Hypothesis Testing: Spread (Compare 2+ Factors)
Hypothesis Testing: Spread (Compare 2+ Factors)Hypothesis Testing: Spread (Compare 2+ Factors)
Hypothesis Testing: Spread (Compare 2+ Factors)
Matt Hansen
 
Hypothesis Testing: Relationships (Compare 2+ Factors)
Hypothesis Testing: Relationships (Compare 2+ Factors)Hypothesis Testing: Relationships (Compare 2+ Factors)
Hypothesis Testing: Relationships (Compare 2+ Factors)
Matt Hansen
 
Calculating a Sample Size
Calculating a Sample SizeCalculating a Sample Size
Calculating a Sample Size
Matt Hansen
 

Similar to Distributions: Non-Normal with Matt Hansen at StatStuff (20)

Statistical Process Control (SPC)
Statistical Process Control (SPC)Statistical Process Control (SPC)
Statistical Process Control (SPC)
 
Overview of Statistical Terms and Concepts with Matt Hansen at StatStuff
Overview of Statistical Terms and Concepts with Matt Hansen at StatStuffOverview of Statistical Terms and Concepts with Matt Hansen at StatStuff
Overview of Statistical Terms and Concepts with Matt Hansen at StatStuff
 
Hypothesis Testing: Central Tendency – Non-Normal (Nonparametric Overview)
Hypothesis Testing: Central Tendency – Non-Normal (Nonparametric Overview)Hypothesis Testing: Central Tendency – Non-Normal (Nonparametric Overview)
Hypothesis Testing: Central Tendency – Non-Normal (Nonparametric Overview)
 
Descriptive Statistics
Descriptive StatisticsDescriptive Statistics
Descriptive Statistics
 
Comparing Distributions and Using the Graphical Summary
Comparing Distributions and Using the Graphical SummaryComparing Distributions and Using the Graphical Summary
Comparing Distributions and Using the Graphical Summary
 
Control Charts: Finding the Right Control Chart
Control Charts: Finding the Right Control ChartControl Charts: Finding the Right Control Chart
Control Charts: Finding the Right Control Chart
 
Testing for Multicollinearity
Testing for MulticollinearityTesting for Multicollinearity
Testing for Multicollinearity
 
Hypothesis Testing: Central Tendency – Non-Normal (Compare 1:Standard)
Hypothesis Testing: Central Tendency – Non-Normal (Compare 1:Standard)Hypothesis Testing: Central Tendency – Non-Normal (Compare 1:Standard)
Hypothesis Testing: Central Tendency – Non-Normal (Compare 1:Standard)
 
Hypothesis Testing: Spread (Compare 1:1)
Hypothesis Testing: Spread (Compare 1:1)Hypothesis Testing: Spread (Compare 1:1)
Hypothesis Testing: Spread (Compare 1:1)
 
Hypothesis Testing: Relationships (Overview)
Hypothesis Testing: Relationships (Overview)Hypothesis Testing: Relationships (Overview)
Hypothesis Testing: Relationships (Overview)
 
Control Charts: P Chart
Control Charts: P ChartControl Charts: P Chart
Control Charts: P Chart
 
Control Charts: U Chart
Control Charts: U ChartControl Charts: U Chart
Control Charts: U Chart
 
Hypothesis Testing: Spread (Compare 1:Standard)
Hypothesis Testing: Spread (Compare 1:Standard)Hypothesis Testing: Spread (Compare 1:Standard)
Hypothesis Testing: Spread (Compare 1:Standard)
 
Hypothesis Testing: Central Tendency – Non-Normal (Compare 1:1)
Hypothesis Testing: Central Tendency – Non-Normal (Compare 1:1)Hypothesis Testing: Central Tendency – Non-Normal (Compare 1:1)
Hypothesis Testing: Central Tendency – Non-Normal (Compare 1:1)
 
Hypothesis Testing: Central Tendency – Non-Normal (Compare 2+ Factors)
Hypothesis Testing: Central Tendency – Non-Normal (Compare 2+ Factors)Hypothesis Testing: Central Tendency – Non-Normal (Compare 2+ Factors)
Hypothesis Testing: Central Tendency – Non-Normal (Compare 2+ Factors)
 
Hypothesis Testing: Proportions (Compare 2+ Factors)
Hypothesis Testing: Proportions (Compare 2+ Factors)Hypothesis Testing: Proportions (Compare 2+ Factors)
Hypothesis Testing: Proportions (Compare 2+ Factors)
 
Hypothesis Testing: Central Tendency – Normal (Compare 1:Standard)
Hypothesis Testing: Central Tendency – Normal (Compare 1:Standard)Hypothesis Testing: Central Tendency – Normal (Compare 1:Standard)
Hypothesis Testing: Central Tendency – Normal (Compare 1:Standard)
 
Hypothesis Testing: Spread (Compare 2+ Factors)
Hypothesis Testing: Spread (Compare 2+ Factors)Hypothesis Testing: Spread (Compare 2+ Factors)
Hypothesis Testing: Spread (Compare 2+ Factors)
 
Hypothesis Testing: Relationships (Compare 2+ Factors)
Hypothesis Testing: Relationships (Compare 2+ Factors)Hypothesis Testing: Relationships (Compare 2+ Factors)
Hypothesis Testing: Relationships (Compare 2+ Factors)
 
Calculating a Sample Size
Calculating a Sample SizeCalculating a Sample Size
Calculating a Sample Size
 

More from Matt Hansen

Getting Feedback with a Plus/Delta Tool
Getting Feedback with a Plus/Delta ToolGetting Feedback with a Plus/Delta Tool
Getting Feedback with a Plus/Delta Tool
Matt Hansen
 
Closing a Project
Closing a ProjectClosing a Project
Closing a Project
Matt Hansen
 
Documenting a New Process with SOPs
Documenting a New Process with SOPsDocumenting a New Process with SOPs
Documenting a New Process with SOPs
Matt Hansen
 
Building a Control Plan
Building a Control PlanBuilding a Control Plan
Building a Control Plan
Matt Hansen
 
Control Charts: Recalculating Control Limits
Control Charts: Recalculating Control LimitsControl Charts: Recalculating Control Limits
Control Charts: Recalculating Control Limits
Matt Hansen
 
Control Charts: Xbar-S Chart
Control Charts: Xbar-S ChartControl Charts: Xbar-S Chart
Control Charts: Xbar-S Chart
Matt Hansen
 
Control Charts: I-MR Chart
Control Charts: I-MR ChartControl Charts: I-MR Chart
Control Charts: I-MR Chart
Matt Hansen
 
Building a Scorecard
Building a ScorecardBuilding a Scorecard
Building a Scorecard
Matt Hansen
 
Control Phase Roadmap (Level 3)
Control Phase Roadmap (Level 3)Control Phase Roadmap (Level 3)
Control Phase Roadmap (Level 3)
Matt Hansen
 
Piloting Solutions: Build the Pilot Plan
Piloting Solutions: Build the Pilot PlanPiloting Solutions: Build the Pilot Plan
Piloting Solutions: Build the Pilot Plan
Matt Hansen
 
Piloting Solutions: The Process
Piloting Solutions: The ProcessPiloting Solutions: The Process
Piloting Solutions: The Process
Matt Hansen
 
Risk Assessment with a FMEA Tool
Risk Assessment with a FMEA ToolRisk Assessment with a FMEA Tool
Risk Assessment with a FMEA Tool
Matt Hansen
 
Prioritize Solutions with an Impact Matrix
Prioritize Solutions with an Impact MatrixPrioritize Solutions with an Impact Matrix
Prioritize Solutions with an Impact Matrix
Matt Hansen
 
Brainstorm Solutions with an Affinity Diagram
Brainstorm Solutions with an Affinity DiagramBrainstorm Solutions with an Affinity Diagram
Brainstorm Solutions with an Affinity Diagram
Matt Hansen
 
Brainstorm & Prioritize Solutions with a Workout
Brainstorm & Prioritize Solutions with a WorkoutBrainstorm & Prioritize Solutions with a Workout
Brainstorm & Prioritize Solutions with a Workout
Matt Hansen
 
Compiling Analysis Results
Compiling Analysis ResultsCompiling Analysis Results
Compiling Analysis Results
Matt Hansen
 
Improve Phase Roadmap (Level 3)
Improve Phase Roadmap (Level 3)Improve Phase Roadmap (Level 3)
Improve Phase Roadmap (Level 3)
Matt Hansen
 
Hypothesis Testing: Relationships (Compare 1:1)
Hypothesis Testing: Relationships (Compare 1:1)Hypothesis Testing: Relationships (Compare 1:1)
Hypothesis Testing: Relationships (Compare 1:1)
Matt Hansen
 

More from Matt Hansen (18)

Getting Feedback with a Plus/Delta Tool
Getting Feedback with a Plus/Delta ToolGetting Feedback with a Plus/Delta Tool
Getting Feedback with a Plus/Delta Tool
 
Closing a Project
Closing a ProjectClosing a Project
Closing a Project
 
Documenting a New Process with SOPs
Documenting a New Process with SOPsDocumenting a New Process with SOPs
Documenting a New Process with SOPs
 
Building a Control Plan
Building a Control PlanBuilding a Control Plan
Building a Control Plan
 
Control Charts: Recalculating Control Limits
Control Charts: Recalculating Control LimitsControl Charts: Recalculating Control Limits
Control Charts: Recalculating Control Limits
 
Control Charts: Xbar-S Chart
Control Charts: Xbar-S ChartControl Charts: Xbar-S Chart
Control Charts: Xbar-S Chart
 
Control Charts: I-MR Chart
Control Charts: I-MR ChartControl Charts: I-MR Chart
Control Charts: I-MR Chart
 
Building a Scorecard
Building a ScorecardBuilding a Scorecard
Building a Scorecard
 
Control Phase Roadmap (Level 3)
Control Phase Roadmap (Level 3)Control Phase Roadmap (Level 3)
Control Phase Roadmap (Level 3)
 
Piloting Solutions: Build the Pilot Plan
Piloting Solutions: Build the Pilot PlanPiloting Solutions: Build the Pilot Plan
Piloting Solutions: Build the Pilot Plan
 
Piloting Solutions: The Process
Piloting Solutions: The ProcessPiloting Solutions: The Process
Piloting Solutions: The Process
 
Risk Assessment with a FMEA Tool
Risk Assessment with a FMEA ToolRisk Assessment with a FMEA Tool
Risk Assessment with a FMEA Tool
 
Prioritize Solutions with an Impact Matrix
Prioritize Solutions with an Impact MatrixPrioritize Solutions with an Impact Matrix
Prioritize Solutions with an Impact Matrix
 
Brainstorm Solutions with an Affinity Diagram
Brainstorm Solutions with an Affinity DiagramBrainstorm Solutions with an Affinity Diagram
Brainstorm Solutions with an Affinity Diagram
 
Brainstorm & Prioritize Solutions with a Workout
Brainstorm & Prioritize Solutions with a WorkoutBrainstorm & Prioritize Solutions with a Workout
Brainstorm & Prioritize Solutions with a Workout
 
Compiling Analysis Results
Compiling Analysis ResultsCompiling Analysis Results
Compiling Analysis Results
 
Improve Phase Roadmap (Level 3)
Improve Phase Roadmap (Level 3)Improve Phase Roadmap (Level 3)
Improve Phase Roadmap (Level 3)
 
Hypothesis Testing: Relationships (Compare 1:1)
Hypothesis Testing: Relationships (Compare 1:1)Hypothesis Testing: Relationships (Compare 1:1)
Hypothesis Testing: Relationships (Compare 1:1)
 

Recently uploaded

Hamster Kombat' Telegram Game Surpasses 100 Million Players—Token Release Sch...
Hamster Kombat' Telegram Game Surpasses 100 Million Players—Token Release Sch...Hamster Kombat' Telegram Game Surpasses 100 Million Players—Token Release Sch...
Hamster Kombat' Telegram Game Surpasses 100 Million Players—Token Release Sch...
SOFTTECHHUB
 
Best Forex Brokers Comparison in INDIA 2024
Best Forex Brokers Comparison in INDIA 2024Best Forex Brokers Comparison in INDIA 2024
Best Forex Brokers Comparison in INDIA 2024
Top Forex Brokers Review
 
2022 Vintage Roman Numerals Men Rings
2022 Vintage Roman  Numerals  Men  Rings2022 Vintage Roman  Numerals  Men  Rings
2022 Vintage Roman Numerals Men Rings
aragme
 
Digital Marketing with a Focus on Sustainability
Digital Marketing with a Focus on SustainabilityDigital Marketing with a Focus on Sustainability
Digital Marketing with a Focus on Sustainability
sssourabhsharma
 
How are Lilac French Bulldogs Beauty Charming the World and Capturing Hearts....
How are Lilac French Bulldogs Beauty Charming the World and Capturing Hearts....How are Lilac French Bulldogs Beauty Charming the World and Capturing Hearts....
How are Lilac French Bulldogs Beauty Charming the World and Capturing Hearts....
Lacey Max
 
Authentically Social by Corey Perlman - EO Puerto Rico
Authentically Social by Corey Perlman - EO Puerto RicoAuthentically Social by Corey Perlman - EO Puerto Rico
Authentically Social by Corey Perlman - EO Puerto Rico
Corey Perlman, Social Media Speaker and Consultant
 
2024-6-01-IMPACTSilver-Corp-Presentation.pdf
2024-6-01-IMPACTSilver-Corp-Presentation.pdf2024-6-01-IMPACTSilver-Corp-Presentation.pdf
2024-6-01-IMPACTSilver-Corp-Presentation.pdf
hartfordclub1
 
3 Simple Steps To Buy Verified Payoneer Account In 2024
3 Simple Steps To Buy Verified Payoneer Account In 20243 Simple Steps To Buy Verified Payoneer Account In 2024
3 Simple Steps To Buy Verified Payoneer Account In 2024
SEOSMMEARTH
 
GKohler - Retail Scavenger Hunt Presentation
GKohler - Retail Scavenger Hunt PresentationGKohler - Retail Scavenger Hunt Presentation
GKohler - Retail Scavenger Hunt Presentation
GraceKohler1
 
Understanding User Needs and Satisfying Them
Understanding User Needs and Satisfying ThemUnderstanding User Needs and Satisfying Them
Understanding User Needs and Satisfying Them
Aggregage
 
Call8328958814 satta matka Kalyan result satta guessing
Call8328958814 satta matka Kalyan result satta guessingCall8328958814 satta matka Kalyan result satta guessing
Call8328958814 satta matka Kalyan result satta guessing
➑➌➋➑➒➎➑➑➊➍
 
The 10 Most Influential Leaders Guiding Corporate Evolution, 2024.pdf
The 10 Most Influential Leaders Guiding Corporate Evolution, 2024.pdfThe 10 Most Influential Leaders Guiding Corporate Evolution, 2024.pdf
The 10 Most Influential Leaders Guiding Corporate Evolution, 2024.pdf
thesiliconleaders
 
Taurus Zodiac Sign: Unveiling the Traits, Dates, and Horoscope Insights of th...
Taurus Zodiac Sign: Unveiling the Traits, Dates, and Horoscope Insights of th...Taurus Zodiac Sign: Unveiling the Traits, Dates, and Horoscope Insights of th...
Taurus Zodiac Sign: Unveiling the Traits, Dates, and Horoscope Insights of th...
my Pandit
 
Best practices for project execution and delivery
Best practices for project execution and deliveryBest practices for project execution and delivery
Best practices for project execution and delivery
CLIVE MINCHIN
 
Anny Serafina Love - Letter of Recommendation by Kellen Harkins, MS.
Anny Serafina Love - Letter of Recommendation by Kellen Harkins, MS.Anny Serafina Love - Letter of Recommendation by Kellen Harkins, MS.
Anny Serafina Love - Letter of Recommendation by Kellen Harkins, MS.
AnnySerafinaLove
 
Call 8867766396 Satta Matka Dpboss Matka Guessing Satta batta Matka 420 Satta...
Call 8867766396 Satta Matka Dpboss Matka Guessing Satta batta Matka 420 Satta...Call 8867766396 Satta Matka Dpboss Matka Guessing Satta batta Matka 420 Satta...
Call 8867766396 Satta Matka Dpboss Matka Guessing Satta batta Matka 420 Satta...
bosssp10
 
Unveiling the Dynamic Personalities, Key Dates, and Horoscope Insights: Gemin...
Unveiling the Dynamic Personalities, Key Dates, and Horoscope Insights: Gemin...Unveiling the Dynamic Personalities, Key Dates, and Horoscope Insights: Gemin...
Unveiling the Dynamic Personalities, Key Dates, and Horoscope Insights: Gemin...
my Pandit
 
❼❷⓿❺❻❷❽❷❼❽ Dpboss Matka Result Satta Matka Guessing Satta Fix jodi Kalyan Fin...
❼❷⓿❺❻❷❽❷❼❽ Dpboss Matka Result Satta Matka Guessing Satta Fix jodi Kalyan Fin...❼❷⓿❺❻❷❽❷❼❽ Dpboss Matka Result Satta Matka Guessing Satta Fix jodi Kalyan Fin...
❼❷⓿❺❻❷❽❷❼❽ Dpboss Matka Result Satta Matka Guessing Satta Fix jodi Kalyan Fin...
❼❷⓿❺❻❷❽❷❼❽ Dpboss Kalyan Satta Matka Guessing Matka Result Main Bazar chart
 
Easily Verify Compliance and Security with Binance KYC
Easily Verify Compliance and Security with Binance KYCEasily Verify Compliance and Security with Binance KYC
Easily Verify Compliance and Security with Binance KYC
Any kyc Account
 
Best Competitive Marble Pricing in Dubai - ☎ 9928909666
Best Competitive Marble Pricing in Dubai - ☎ 9928909666Best Competitive Marble Pricing in Dubai - ☎ 9928909666
Best Competitive Marble Pricing in Dubai - ☎ 9928909666
Stone Art Hub
 

Recently uploaded (20)

Hamster Kombat' Telegram Game Surpasses 100 Million Players—Token Release Sch...
Hamster Kombat' Telegram Game Surpasses 100 Million Players—Token Release Sch...Hamster Kombat' Telegram Game Surpasses 100 Million Players—Token Release Sch...
Hamster Kombat' Telegram Game Surpasses 100 Million Players—Token Release Sch...
 
Best Forex Brokers Comparison in INDIA 2024
Best Forex Brokers Comparison in INDIA 2024Best Forex Brokers Comparison in INDIA 2024
Best Forex Brokers Comparison in INDIA 2024
 
2022 Vintage Roman Numerals Men Rings
2022 Vintage Roman  Numerals  Men  Rings2022 Vintage Roman  Numerals  Men  Rings
2022 Vintage Roman Numerals Men Rings
 
Digital Marketing with a Focus on Sustainability
Digital Marketing with a Focus on SustainabilityDigital Marketing with a Focus on Sustainability
Digital Marketing with a Focus on Sustainability
 
How are Lilac French Bulldogs Beauty Charming the World and Capturing Hearts....
How are Lilac French Bulldogs Beauty Charming the World and Capturing Hearts....How are Lilac French Bulldogs Beauty Charming the World and Capturing Hearts....
How are Lilac French Bulldogs Beauty Charming the World and Capturing Hearts....
 
Authentically Social by Corey Perlman - EO Puerto Rico
Authentically Social by Corey Perlman - EO Puerto RicoAuthentically Social by Corey Perlman - EO Puerto Rico
Authentically Social by Corey Perlman - EO Puerto Rico
 
2024-6-01-IMPACTSilver-Corp-Presentation.pdf
2024-6-01-IMPACTSilver-Corp-Presentation.pdf2024-6-01-IMPACTSilver-Corp-Presentation.pdf
2024-6-01-IMPACTSilver-Corp-Presentation.pdf
 
3 Simple Steps To Buy Verified Payoneer Account In 2024
3 Simple Steps To Buy Verified Payoneer Account In 20243 Simple Steps To Buy Verified Payoneer Account In 2024
3 Simple Steps To Buy Verified Payoneer Account In 2024
 
GKohler - Retail Scavenger Hunt Presentation
GKohler - Retail Scavenger Hunt PresentationGKohler - Retail Scavenger Hunt Presentation
GKohler - Retail Scavenger Hunt Presentation
 
Understanding User Needs and Satisfying Them
Understanding User Needs and Satisfying ThemUnderstanding User Needs and Satisfying Them
Understanding User Needs and Satisfying Them
 
Call8328958814 satta matka Kalyan result satta guessing
Call8328958814 satta matka Kalyan result satta guessingCall8328958814 satta matka Kalyan result satta guessing
Call8328958814 satta matka Kalyan result satta guessing
 
The 10 Most Influential Leaders Guiding Corporate Evolution, 2024.pdf
The 10 Most Influential Leaders Guiding Corporate Evolution, 2024.pdfThe 10 Most Influential Leaders Guiding Corporate Evolution, 2024.pdf
The 10 Most Influential Leaders Guiding Corporate Evolution, 2024.pdf
 
Taurus Zodiac Sign: Unveiling the Traits, Dates, and Horoscope Insights of th...
Taurus Zodiac Sign: Unveiling the Traits, Dates, and Horoscope Insights of th...Taurus Zodiac Sign: Unveiling the Traits, Dates, and Horoscope Insights of th...
Taurus Zodiac Sign: Unveiling the Traits, Dates, and Horoscope Insights of th...
 
Best practices for project execution and delivery
Best practices for project execution and deliveryBest practices for project execution and delivery
Best practices for project execution and delivery
 
Anny Serafina Love - Letter of Recommendation by Kellen Harkins, MS.
Anny Serafina Love - Letter of Recommendation by Kellen Harkins, MS.Anny Serafina Love - Letter of Recommendation by Kellen Harkins, MS.
Anny Serafina Love - Letter of Recommendation by Kellen Harkins, MS.
 
Call 8867766396 Satta Matka Dpboss Matka Guessing Satta batta Matka 420 Satta...
Call 8867766396 Satta Matka Dpboss Matka Guessing Satta batta Matka 420 Satta...Call 8867766396 Satta Matka Dpboss Matka Guessing Satta batta Matka 420 Satta...
Call 8867766396 Satta Matka Dpboss Matka Guessing Satta batta Matka 420 Satta...
 
Unveiling the Dynamic Personalities, Key Dates, and Horoscope Insights: Gemin...
Unveiling the Dynamic Personalities, Key Dates, and Horoscope Insights: Gemin...Unveiling the Dynamic Personalities, Key Dates, and Horoscope Insights: Gemin...
Unveiling the Dynamic Personalities, Key Dates, and Horoscope Insights: Gemin...
 
❼❷⓿❺❻❷❽❷❼❽ Dpboss Matka Result Satta Matka Guessing Satta Fix jodi Kalyan Fin...
❼❷⓿❺❻❷❽❷❼❽ Dpboss Matka Result Satta Matka Guessing Satta Fix jodi Kalyan Fin...❼❷⓿❺❻❷❽❷❼❽ Dpboss Matka Result Satta Matka Guessing Satta Fix jodi Kalyan Fin...
❼❷⓿❺❻❷❽❷❼❽ Dpboss Matka Result Satta Matka Guessing Satta Fix jodi Kalyan Fin...
 
Easily Verify Compliance and Security with Binance KYC
Easily Verify Compliance and Security with Binance KYCEasily Verify Compliance and Security with Binance KYC
Easily Verify Compliance and Security with Binance KYC
 
Best Competitive Marble Pricing in Dubai - ☎ 9928909666
Best Competitive Marble Pricing in Dubai - ☎ 9928909666Best Competitive Marble Pricing in Dubai - ☎ 9928909666
Best Competitive Marble Pricing in Dubai - ☎ 9928909666
 

Distributions: Non-Normal with Matt Hansen at StatStuff

  • 1. Section & Lesson #: Pre-Requisite Lessons: Complex Tools + Clear Teaching = Powerful Results Distributions: Non-Normal Six Sigma-Measure – Lesson 10 A review of non-normal and bi-modal distributions and how to test them using a normality test. Six Sigma-Measure #09 – Distributions: Normal Copyright © 2011-2019 by Matthew J. Hansen. All Rights Reserved. No part of this publication may be reproduced, stored in a retrieval system, or transmitted by any means (electronic, mechanical, photographic, photocopying, recording or otherwise) without prior permission in writing by the author and/or publisher.
  • 2. Non-Normal Distributions o Non-normal distributions have bias or skewness. • Since normal distributions reflect natural randomness in life, non-normal distributions are not random and therefore have something influencing its results. • The bias in the data can be caused by two possible things:  The method for getting the sampled data was not random.  The process itself (from which the sample is pulled) has something skewing it. • Example: Measuring the life of 1000 batteries.  What kind of distribution would you expect? If it’s non-normal, then what may be causing it?  What are some things you would change to try to get a normal distribution? o Measure central tendency with the median. • Bias in the data can cause the mean to shift. • The median (50th percentile) never shifts. • What type of non-normal distribution is it?  Many types of non-normal distributions exist (e.g., weibull, lognormal, gamma, logistic, etc.). – To find out, go to Stat > Reliability/Survival > Distribution Analysis (Right) > Distribution ID Plot… (Not avail in Minitab 14) – Select the distribution type with the highest correlation coefficient; it can also be run for discrete factors in a variable. Copyright © 2011-2019 by Matthew J. Hansen. All Rights Reserved. No part of this publication may be reproduced, stored in a retrieval system, or transmitted by any means (electronic, mechanical, photographic, photocopying, recording or otherwise) without prior permission in writing by the author and/or publisher. This distribution is non-normal because the p-value is < 0.05
  • 3. Bimodal Distribution o What is a bimodal distribution? • These are distributions that appear to have two central tendencies (two bell curves).  It’s possible to have more than two bell curves (multi-modality), but it’s not as common. • These occur when observations are taken from different populations.  Most things we measure do not have more than one central tendency. Therefore when we see this, it’s most likely a sign that we are measuring observations from more than one population. • Example: Examine the graphical summary of data below.  What can you conclude from this result?  Is it a normal or non- normal distribution?  What’s the central tendency? Is it reliable?  How can this be fixed? Copyright © 2011-2019 by Matthew J. Hansen. All Rights Reserved. No part of this publication may be reproduced, stored in a retrieval system, or transmitted by any means (electronic, mechanical, photographic, photocopying, recording or otherwise) without prior permission in writing by the author and/or publisher.
  • 4. Practical Application o Open the “Minitab Sample Data.MPJ” file and try to do the following: • Run a normality test on each continuous metric. • Which metrics are non-normally distributed? How can you prove it? • Which metric (if any) has multi-modality? o Next, pull some historical data for at least 2 continuous metrics used by your organization and try following the same steps described above. Copyright © 2011-2019 by Matthew J. Hansen. All Rights Reserved. No part of this publication may be reproduced, stored in a retrieval system, or transmitted by any means (electronic, mechanical, photographic, photocopying, recording or otherwise) without prior permission in writing by the author and/or publisher. 4