SlideShare a Scribd company logo
1 of 4
Section & Lesson #:
Pre-Requisite Lessons:
Complex Tools + Clear Teaching = Powerful Results
Distributions: Normal
Six Sigma-Measure – Lesson 9
A review of normal distributions and how to test their normality using a
normality test.
Six Sigma-Measure #08 – Distributions: Overview
Copyright © 2011-2019 by Matthew J. Hansen. All Rights Reserved. No part of this publication may be reproduced, stored in a retrieval system, or transmitted by any means
(electronic, mechanical, photographic, photocopying, recording or otherwise) without prior permission in writing by the author and/or publisher.
Normal Distributions (bell curve)
o Why is it called a “normal” distribution?
• “Normal” implies the typical randomness that we expect to occur in life.
• If there was no randomness, then we can presume there is some influence (bias or skewness).
• We want the data that we analyze to be unbiased, therefore we need to ensure it reflects the
“normal” randomness we would expect.
 Otherwise if the data is biased, then why analyze it if we can’t be confident we’ll find the right root cause?
o A normal distribution is bell-shaped.
• The bell shape is created because most
of the data points fall in the middle.
• The shape of the bell is influenced by
the mean and standard deviation.
o Characteristics of a normal distribution.
• Completely described by its mean and standard deviation.
• The tails on either end of the curve extend +/- infinity.
• The area under the curve represents 100% of possible observations.
• The curve is symmetrical where 50% of the data points fall on either side of the mean.
• The mean (average) will be relatively equal to the median (50th percentile).
Copyright © 2011-2019 by Matthew J. Hansen. All Rights Reserved. No part of this publication may be
reproduced, stored in a retrieval system, or transmitted by any means (electronic, mechanical, photographic,
photocopying, recording or otherwise) without prior permission in writing by the author and/or publisher.
Normality Testing
o A distribution with a bell curve doesn’t necessarily mean it’s “normal”.
• It’s not uncommon for a distribution to appear normal, but it really isn’t.
• The normality of the distribution should be statistically tested.
o Use the Anderson-Darling test of a Normality Test or Probability Plot.
• A normality test or probability plot will plot the data on a logarithmic scale.
 In Minitab, go to Stat > Basic Statistics > Normality Test or go to Graph > Probability Plot
• Normal data will appear like a straight line; Minitab will try to fit a line along the data points.
 A “fat pencil” test is if a fat pencil can lay
across and cover all the data points, then
it’s probably a normal distribution.
• A better test is to examine the p-value
of the Anderson-Darling (AD) test.
 If p-value > 0.05, then it’s normal.
 If p-value < 0.05, then it’s not normal.
– In these examples, 0.05 is referring to the
alpha risk which is the % chance of being
right when concluding the data is normal.
5% is a commonly acceptable threshold.
Copyright © 2011-2019 by Matthew J. Hansen. All Rights Reserved. No part of this publication may be
reproduced, stored in a retrieval system, or transmitted by any means (electronic, mechanical, photographic,
photocopying, recording or otherwise) without prior permission in writing by the author and/or publisher.
3
This p-value is > 0.05
which means it’s a
normal distribution
Practical Application
o Open the “Minitab Sample Data.MPJ” file and try to do the following:
• Run a normality test on each continuous metric.
• Which metrics are normally distributed? How can you prove it?
o Next, pull some historical data for at least 2 continuous metrics used by your
organization and try following the same steps described above.
Copyright © 2011-2019 by Matthew J. Hansen. All Rights Reserved. No part of this publication may be
reproduced, stored in a retrieval system, or transmitted by any means (electronic, mechanical, photographic,
photocopying, recording or otherwise) without prior permission in writing by the author and/or publisher.
4

More Related Content

What's hot

MSA – Overview
MSA – OverviewMSA – Overview
MSA – OverviewMatt Hansen
 
The Necessity of the Measure Phase with Matt Hansen at StatStuff
The Necessity of the Measure Phase with Matt Hansen at StatStuffThe Necessity of the Measure Phase with Matt Hansen at StatStuff
The Necessity of the Measure Phase with Matt Hansen at StatStuffMatt Hansen
 
Statistical Process Control (SPC)
Statistical Process Control (SPC)Statistical Process Control (SPC)
Statistical Process Control (SPC)Matt Hansen
 
Measure Phase Roadmap (Level 3) with Matt Hansen at StatStuff
Measure Phase Roadmap (Level 3) with Matt Hansen at StatStuffMeasure Phase Roadmap (Level 3) with Matt Hansen at StatStuff
Measure Phase Roadmap (Level 3) with Matt Hansen at StatStuffMatt Hansen
 
Variation Over Time (Short/Long Term Data)
Variation Over Time (Short/Long Term Data)Variation Over Time (Short/Long Term Data)
Variation Over Time (Short/Long Term Data)Matt Hansen
 
MSA – Improving the Measurement System
MSA – Improving the Measurement SystemMSA – Improving the Measurement System
MSA – Improving the Measurement SystemMatt Hansen
 
Identify Root Causes – Building the DCP
Identify Root Causes – Building the DCPIdentify Root Causes – Building the DCP
Identify Root Causes – Building the DCPMatt Hansen
 
Rational Sub-Grouping
Rational Sub-GroupingRational Sub-Grouping
Rational Sub-GroupingMatt Hansen
 
Process Capability: Steps 1 to 3
Process Capability: Steps 1 to 3Process Capability: Steps 1 to 3
Process Capability: Steps 1 to 3Matt Hansen
 
MSA – Attribute ARR Test
MSA – Attribute ARR TestMSA – Attribute ARR Test
MSA – Attribute ARR TestMatt Hansen
 
Data drift and machine learning
Data drift and machine learningData drift and machine learning
Data drift and machine learningSmita Agrawal
 
ML Drift - How to find issues before they become problems
ML Drift - How to find issues before they become problemsML Drift - How to find issues before they become problems
ML Drift - How to find issues before they become problemsAmy Hodler
 
Carma internet research module sample size considerations
Carma internet research module   sample size considerationsCarma internet research module   sample size considerations
Carma internet research module sample size considerationsSyracuse University
 
How to calculate power in statistics
How to calculate power in statisticsHow to calculate power in statistics
How to calculate power in statisticsStat Analytica
 
A predictive analytics primer
A predictive analytics primerA predictive analytics primer
A predictive analytics primerRaminder Singh
 
Top Five Ideas -- Statistics for Project Management
Top Five Ideas -- Statistics for Project ManagementTop Five Ideas -- Statistics for Project Management
Top Five Ideas -- Statistics for Project ManagementJohn Goodpasture
 
What Is a Model, Anyhow?
What Is a Model, Anyhow?What Is a Model, Anyhow?
What Is a Model, Anyhow?Bill Cassill
 
Process Capability: Step 4 (Normal Distributions)
Process Capability: Step 4 (Normal Distributions)Process Capability: Step 4 (Normal Distributions)
Process Capability: Step 4 (Normal Distributions)Matt Hansen
 
East Infosheet
East InfosheetEast Infosheet
East InfosheetCytel
 

What's hot (20)

MSA – Overview
MSA – OverviewMSA – Overview
MSA – Overview
 
The Necessity of the Measure Phase with Matt Hansen at StatStuff
The Necessity of the Measure Phase with Matt Hansen at StatStuffThe Necessity of the Measure Phase with Matt Hansen at StatStuff
The Necessity of the Measure Phase with Matt Hansen at StatStuff
 
Statistical Process Control (SPC)
Statistical Process Control (SPC)Statistical Process Control (SPC)
Statistical Process Control (SPC)
 
Measure Phase Roadmap (Level 3) with Matt Hansen at StatStuff
Measure Phase Roadmap (Level 3) with Matt Hansen at StatStuffMeasure Phase Roadmap (Level 3) with Matt Hansen at StatStuff
Measure Phase Roadmap (Level 3) with Matt Hansen at StatStuff
 
Variation Over Time (Short/Long Term Data)
Variation Over Time (Short/Long Term Data)Variation Over Time (Short/Long Term Data)
Variation Over Time (Short/Long Term Data)
 
MSA – Improving the Measurement System
MSA – Improving the Measurement SystemMSA – Improving the Measurement System
MSA – Improving the Measurement System
 
Identify Root Causes – Building the DCP
Identify Root Causes – Building the DCPIdentify Root Causes – Building the DCP
Identify Root Causes – Building the DCP
 
Rational Sub-Grouping
Rational Sub-GroupingRational Sub-Grouping
Rational Sub-Grouping
 
Process Capability: Steps 1 to 3
Process Capability: Steps 1 to 3Process Capability: Steps 1 to 3
Process Capability: Steps 1 to 3
 
MSA – Attribute ARR Test
MSA – Attribute ARR TestMSA – Attribute ARR Test
MSA – Attribute ARR Test
 
Data drift and machine learning
Data drift and machine learningData drift and machine learning
Data drift and machine learning
 
ML Drift - How to find issues before they become problems
ML Drift - How to find issues before they become problemsML Drift - How to find issues before they become problems
ML Drift - How to find issues before they become problems
 
Carma internet research module sample size considerations
Carma internet research module   sample size considerationsCarma internet research module   sample size considerations
Carma internet research module sample size considerations
 
How to calculate power in statistics
How to calculate power in statisticsHow to calculate power in statistics
How to calculate power in statistics
 
A predictive analytics primer
A predictive analytics primerA predictive analytics primer
A predictive analytics primer
 
Top Five Ideas -- Statistics for Project Management
Top Five Ideas -- Statistics for Project ManagementTop Five Ideas -- Statistics for Project Management
Top Five Ideas -- Statistics for Project Management
 
ICAR - IFPRI- Power Calculation
ICAR - IFPRI- Power CalculationICAR - IFPRI- Power Calculation
ICAR - IFPRI- Power Calculation
 
What Is a Model, Anyhow?
What Is a Model, Anyhow?What Is a Model, Anyhow?
What Is a Model, Anyhow?
 
Process Capability: Step 4 (Normal Distributions)
Process Capability: Step 4 (Normal Distributions)Process Capability: Step 4 (Normal Distributions)
Process Capability: Step 4 (Normal Distributions)
 
East Infosheet
East InfosheetEast Infosheet
East Infosheet
 

Similar to Distributions: Normal with Matt Hansen at StatStuff

Descriptive Statistics
Descriptive StatisticsDescriptive Statistics
Descriptive StatisticsMatt Hansen
 
Overview of Statistical Terms and Concepts with Matt Hansen at StatStuff
Overview of Statistical Terms and Concepts with Matt Hansen at StatStuffOverview of Statistical Terms and Concepts with Matt Hansen at StatStuff
Overview of Statistical Terms and Concepts with Matt Hansen at StatStuffMatt Hansen
 
Hypothesis Testing: Central Tendency – Non-Normal (Nonparametric Overview)
Hypothesis Testing: Central Tendency – Non-Normal (Nonparametric Overview)Hypothesis Testing: Central Tendency – Non-Normal (Nonparametric Overview)
Hypothesis Testing: Central Tendency – Non-Normal (Nonparametric Overview)Matt Hansen
 
Hypothesis Testing: Spread (Compare 1:Standard)
Hypothesis Testing: Spread (Compare 1:Standard)Hypothesis Testing: Spread (Compare 1:Standard)
Hypothesis Testing: Spread (Compare 1:Standard)Matt Hansen
 
Hypothesis Testing: Statistical Laws and Confidence Intervals
Hypothesis Testing: Statistical Laws and Confidence IntervalsHypothesis Testing: Statistical Laws and Confidence Intervals
Hypothesis Testing: Statistical Laws and Confidence IntervalsMatt Hansen
 
Hypothesis Testing: Central Tendency – Normal (Compare 1:Standard)
Hypothesis Testing: Central Tendency – Normal (Compare 1:Standard)Hypothesis Testing: Central Tendency – Normal (Compare 1:Standard)
Hypothesis Testing: Central Tendency – Normal (Compare 1:Standard)Matt Hansen
 
Hypothesis Testing: Central Tendency – Non-Normal (Compare 1:Standard)
Hypothesis Testing: Central Tendency – Non-Normal (Compare 1:Standard)Hypothesis Testing: Central Tendency – Non-Normal (Compare 1:Standard)
Hypothesis Testing: Central Tendency – Non-Normal (Compare 1:Standard)Matt Hansen
 
Hypothesis Testing: Proportions (Compare 1:Standard)
Hypothesis Testing: Proportions (Compare 1:Standard)Hypothesis Testing: Proportions (Compare 1:Standard)
Hypothesis Testing: Proportions (Compare 1:Standard)Matt Hansen
 
Hypothesis Testing: Relationships (Overview)
Hypothesis Testing: Relationships (Overview)Hypothesis Testing: Relationships (Overview)
Hypothesis Testing: Relationships (Overview)Matt Hansen
 
Hypothesis Testing: Spread (Compare 1:1)
Hypothesis Testing: Spread (Compare 1:1)Hypothesis Testing: Spread (Compare 1:1)
Hypothesis Testing: Spread (Compare 1:1)Matt Hansen
 
Hypothesis Testing: Central Tendency – Normal (Compare 2+ Factors)
Hypothesis Testing: Central Tendency – Normal (Compare 2+ Factors)Hypothesis Testing: Central Tendency – Normal (Compare 2+ Factors)
Hypothesis Testing: Central Tendency – Normal (Compare 2+ Factors)Matt Hansen
 
Hypothesis Testing: Formal and Informal Sub-Processes
Hypothesis Testing: Formal and Informal Sub-ProcessesHypothesis Testing: Formal and Informal Sub-Processes
Hypothesis Testing: Formal and Informal Sub-ProcessesMatt Hansen
 
Hypothesis Testing: Proportions (Compare 2+ Factors)
Hypothesis Testing: Proportions (Compare 2+ Factors)Hypothesis Testing: Proportions (Compare 2+ Factors)
Hypothesis Testing: Proportions (Compare 2+ Factors)Matt Hansen
 
Lec 5 - Normality Testing.pptx
Lec 5 - Normality Testing.pptxLec 5 - Normality Testing.pptx
Lec 5 - Normality Testing.pptxFarah Amir
 
Hypothesis Testing: Central Tendency – Normal (Compare 1:1)
Hypothesis Testing: Central Tendency – Normal (Compare 1:1)Hypothesis Testing: Central Tendency – Normal (Compare 1:1)
Hypothesis Testing: Central Tendency – Normal (Compare 1:1)Matt Hansen
 
Testing for Multicollinearity
Testing for MulticollinearityTesting for Multicollinearity
Testing for MulticollinearityMatt Hansen
 
Hypothesis Testing: Overview
Hypothesis Testing: OverviewHypothesis Testing: Overview
Hypothesis Testing: OverviewMatt Hansen
 
Hypothesis Testing: Central Tendency – Non-Normal (Compare 2+ Factors)
Hypothesis Testing: Central Tendency – Non-Normal (Compare 2+ Factors)Hypothesis Testing: Central Tendency – Non-Normal (Compare 2+ Factors)
Hypothesis Testing: Central Tendency – Non-Normal (Compare 2+ Factors)Matt Hansen
 
Hypothesis Testing: Central Tendency – Non-Normal (Compare 1:1)
Hypothesis Testing: Central Tendency – Non-Normal (Compare 1:1)Hypothesis Testing: Central Tendency – Non-Normal (Compare 1:1)
Hypothesis Testing: Central Tendency – Non-Normal (Compare 1:1)Matt Hansen
 

Similar to Distributions: Normal with Matt Hansen at StatStuff (20)

Descriptive Statistics
Descriptive StatisticsDescriptive Statistics
Descriptive Statistics
 
Overview of Statistical Terms and Concepts with Matt Hansen at StatStuff
Overview of Statistical Terms and Concepts with Matt Hansen at StatStuffOverview of Statistical Terms and Concepts with Matt Hansen at StatStuff
Overview of Statistical Terms and Concepts with Matt Hansen at StatStuff
 
Hypothesis Testing: Central Tendency – Non-Normal (Nonparametric Overview)
Hypothesis Testing: Central Tendency – Non-Normal (Nonparametric Overview)Hypothesis Testing: Central Tendency – Non-Normal (Nonparametric Overview)
Hypothesis Testing: Central Tendency – Non-Normal (Nonparametric Overview)
 
Hypothesis Testing: Spread (Compare 1:Standard)
Hypothesis Testing: Spread (Compare 1:Standard)Hypothesis Testing: Spread (Compare 1:Standard)
Hypothesis Testing: Spread (Compare 1:Standard)
 
Hypothesis Testing: Statistical Laws and Confidence Intervals
Hypothesis Testing: Statistical Laws and Confidence IntervalsHypothesis Testing: Statistical Laws and Confidence Intervals
Hypothesis Testing: Statistical Laws and Confidence Intervals
 
Hypothesis Testing: Central Tendency – Normal (Compare 1:Standard)
Hypothesis Testing: Central Tendency – Normal (Compare 1:Standard)Hypothesis Testing: Central Tendency – Normal (Compare 1:Standard)
Hypothesis Testing: Central Tendency – Normal (Compare 1:Standard)
 
Hypothesis Testing: Central Tendency – Non-Normal (Compare 1:Standard)
Hypothesis Testing: Central Tendency – Non-Normal (Compare 1:Standard)Hypothesis Testing: Central Tendency – Non-Normal (Compare 1:Standard)
Hypothesis Testing: Central Tendency – Non-Normal (Compare 1:Standard)
 
Hypothesis Testing: Proportions (Compare 1:Standard)
Hypothesis Testing: Proportions (Compare 1:Standard)Hypothesis Testing: Proportions (Compare 1:Standard)
Hypothesis Testing: Proportions (Compare 1:Standard)
 
Hypothesis Testing: Relationships (Overview)
Hypothesis Testing: Relationships (Overview)Hypothesis Testing: Relationships (Overview)
Hypothesis Testing: Relationships (Overview)
 
Hypothesis Testing: Spread (Compare 1:1)
Hypothesis Testing: Spread (Compare 1:1)Hypothesis Testing: Spread (Compare 1:1)
Hypothesis Testing: Spread (Compare 1:1)
 
Hypothesis Testing: Central Tendency – Normal (Compare 2+ Factors)
Hypothesis Testing: Central Tendency – Normal (Compare 2+ Factors)Hypothesis Testing: Central Tendency – Normal (Compare 2+ Factors)
Hypothesis Testing: Central Tendency – Normal (Compare 2+ Factors)
 
Hypothesis Testing: Formal and Informal Sub-Processes
Hypothesis Testing: Formal and Informal Sub-ProcessesHypothesis Testing: Formal and Informal Sub-Processes
Hypothesis Testing: Formal and Informal Sub-Processes
 
Hypothesis Testing: Proportions (Compare 2+ Factors)
Hypothesis Testing: Proportions (Compare 2+ Factors)Hypothesis Testing: Proportions (Compare 2+ Factors)
Hypothesis Testing: Proportions (Compare 2+ Factors)
 
Lec 5 - Normality Testing.pptx
Lec 5 - Normality Testing.pptxLec 5 - Normality Testing.pptx
Lec 5 - Normality Testing.pptx
 
Hypothesis Testing: Central Tendency – Normal (Compare 1:1)
Hypothesis Testing: Central Tendency – Normal (Compare 1:1)Hypothesis Testing: Central Tendency – Normal (Compare 1:1)
Hypothesis Testing: Central Tendency – Normal (Compare 1:1)
 
Testing for Multicollinearity
Testing for MulticollinearityTesting for Multicollinearity
Testing for Multicollinearity
 
Hypothesis Testing: Overview
Hypothesis Testing: OverviewHypothesis Testing: Overview
Hypothesis Testing: Overview
 
Hypothesis Testing: Central Tendency – Non-Normal (Compare 2+ Factors)
Hypothesis Testing: Central Tendency – Non-Normal (Compare 2+ Factors)Hypothesis Testing: Central Tendency – Non-Normal (Compare 2+ Factors)
Hypothesis Testing: Central Tendency – Non-Normal (Compare 2+ Factors)
 
Hypothesis testing 1.0
Hypothesis testing 1.0Hypothesis testing 1.0
Hypothesis testing 1.0
 
Hypothesis Testing: Central Tendency – Non-Normal (Compare 1:1)
Hypothesis Testing: Central Tendency – Non-Normal (Compare 1:1)Hypothesis Testing: Central Tendency – Non-Normal (Compare 1:1)
Hypothesis Testing: Central Tendency – Non-Normal (Compare 1:1)
 

More from Matt Hansen

Getting Feedback with a Plus/Delta Tool
Getting Feedback with a Plus/Delta ToolGetting Feedback with a Plus/Delta Tool
Getting Feedback with a Plus/Delta ToolMatt Hansen
 
Closing a Project
Closing a ProjectClosing a Project
Closing a ProjectMatt Hansen
 
Documenting a New Process with SOPs
Documenting a New Process with SOPsDocumenting a New Process with SOPs
Documenting a New Process with SOPsMatt Hansen
 
Building a Control Plan
Building a Control PlanBuilding a Control Plan
Building a Control PlanMatt Hansen
 
Control Charts: Recalculating Control Limits
Control Charts: Recalculating Control LimitsControl Charts: Recalculating Control Limits
Control Charts: Recalculating Control LimitsMatt Hansen
 
Control Charts: U Chart
Control Charts: U ChartControl Charts: U Chart
Control Charts: U ChartMatt Hansen
 
Control Charts: P Chart
Control Charts: P ChartControl Charts: P Chart
Control Charts: P ChartMatt Hansen
 
Control Charts: Xbar-S Chart
Control Charts: Xbar-S ChartControl Charts: Xbar-S Chart
Control Charts: Xbar-S ChartMatt Hansen
 
Control Charts: I-MR Chart
Control Charts: I-MR ChartControl Charts: I-MR Chart
Control Charts: I-MR ChartMatt Hansen
 
Control Charts: Finding the Right Control Chart
Control Charts: Finding the Right Control ChartControl Charts: Finding the Right Control Chart
Control Charts: Finding the Right Control ChartMatt Hansen
 
Building a Scorecard
Building a ScorecardBuilding a Scorecard
Building a ScorecardMatt Hansen
 
Control Phase Roadmap (Level 3)
Control Phase Roadmap (Level 3)Control Phase Roadmap (Level 3)
Control Phase Roadmap (Level 3)Matt Hansen
 
Piloting Solutions: Build the Pilot Plan
Piloting Solutions: Build the Pilot PlanPiloting Solutions: Build the Pilot Plan
Piloting Solutions: Build the Pilot PlanMatt Hansen
 
Piloting Solutions: The Process
Piloting Solutions: The ProcessPiloting Solutions: The Process
Piloting Solutions: The ProcessMatt Hansen
 
Risk Assessment with a FMEA Tool
Risk Assessment with a FMEA ToolRisk Assessment with a FMEA Tool
Risk Assessment with a FMEA ToolMatt Hansen
 
Prioritize Solutions with an Impact Matrix
Prioritize Solutions with an Impact MatrixPrioritize Solutions with an Impact Matrix
Prioritize Solutions with an Impact MatrixMatt Hansen
 
Brainstorm Solutions with an Affinity Diagram
Brainstorm Solutions with an Affinity DiagramBrainstorm Solutions with an Affinity Diagram
Brainstorm Solutions with an Affinity DiagramMatt Hansen
 
Brainstorm & Prioritize Solutions with a Workout
Brainstorm & Prioritize Solutions with a WorkoutBrainstorm & Prioritize Solutions with a Workout
Brainstorm & Prioritize Solutions with a WorkoutMatt Hansen
 
Compiling Analysis Results
Compiling Analysis ResultsCompiling Analysis Results
Compiling Analysis ResultsMatt Hansen
 
Improve Phase Roadmap (Level 3)
Improve Phase Roadmap (Level 3)Improve Phase Roadmap (Level 3)
Improve Phase Roadmap (Level 3)Matt Hansen
 

More from Matt Hansen (20)

Getting Feedback with a Plus/Delta Tool
Getting Feedback with a Plus/Delta ToolGetting Feedback with a Plus/Delta Tool
Getting Feedback with a Plus/Delta Tool
 
Closing a Project
Closing a ProjectClosing a Project
Closing a Project
 
Documenting a New Process with SOPs
Documenting a New Process with SOPsDocumenting a New Process with SOPs
Documenting a New Process with SOPs
 
Building a Control Plan
Building a Control PlanBuilding a Control Plan
Building a Control Plan
 
Control Charts: Recalculating Control Limits
Control Charts: Recalculating Control LimitsControl Charts: Recalculating Control Limits
Control Charts: Recalculating Control Limits
 
Control Charts: U Chart
Control Charts: U ChartControl Charts: U Chart
Control Charts: U Chart
 
Control Charts: P Chart
Control Charts: P ChartControl Charts: P Chart
Control Charts: P Chart
 
Control Charts: Xbar-S Chart
Control Charts: Xbar-S ChartControl Charts: Xbar-S Chart
Control Charts: Xbar-S Chart
 
Control Charts: I-MR Chart
Control Charts: I-MR ChartControl Charts: I-MR Chart
Control Charts: I-MR Chart
 
Control Charts: Finding the Right Control Chart
Control Charts: Finding the Right Control ChartControl Charts: Finding the Right Control Chart
Control Charts: Finding the Right Control Chart
 
Building a Scorecard
Building a ScorecardBuilding a Scorecard
Building a Scorecard
 
Control Phase Roadmap (Level 3)
Control Phase Roadmap (Level 3)Control Phase Roadmap (Level 3)
Control Phase Roadmap (Level 3)
 
Piloting Solutions: Build the Pilot Plan
Piloting Solutions: Build the Pilot PlanPiloting Solutions: Build the Pilot Plan
Piloting Solutions: Build the Pilot Plan
 
Piloting Solutions: The Process
Piloting Solutions: The ProcessPiloting Solutions: The Process
Piloting Solutions: The Process
 
Risk Assessment with a FMEA Tool
Risk Assessment with a FMEA ToolRisk Assessment with a FMEA Tool
Risk Assessment with a FMEA Tool
 
Prioritize Solutions with an Impact Matrix
Prioritize Solutions with an Impact MatrixPrioritize Solutions with an Impact Matrix
Prioritize Solutions with an Impact Matrix
 
Brainstorm Solutions with an Affinity Diagram
Brainstorm Solutions with an Affinity DiagramBrainstorm Solutions with an Affinity Diagram
Brainstorm Solutions with an Affinity Diagram
 
Brainstorm & Prioritize Solutions with a Workout
Brainstorm & Prioritize Solutions with a WorkoutBrainstorm & Prioritize Solutions with a Workout
Brainstorm & Prioritize Solutions with a Workout
 
Compiling Analysis Results
Compiling Analysis ResultsCompiling Analysis Results
Compiling Analysis Results
 
Improve Phase Roadmap (Level 3)
Improve Phase Roadmap (Level 3)Improve Phase Roadmap (Level 3)
Improve Phase Roadmap (Level 3)
 

Recently uploaded

8447779800, Low rate Call girls in Uttam Nagar Delhi NCR
8447779800, Low rate Call girls in Uttam Nagar Delhi NCR8447779800, Low rate Call girls in Uttam Nagar Delhi NCR
8447779800, Low rate Call girls in Uttam Nagar Delhi NCRashishs7044
 
8447779800, Low rate Call girls in New Ashok Nagar Delhi NCR
8447779800, Low rate Call girls in New Ashok Nagar Delhi NCR8447779800, Low rate Call girls in New Ashok Nagar Delhi NCR
8447779800, Low rate Call girls in New Ashok Nagar Delhi NCRashishs7044
 
8447779800, Low rate Call girls in Saket Delhi NCR
8447779800, Low rate Call girls in Saket Delhi NCR8447779800, Low rate Call girls in Saket Delhi NCR
8447779800, Low rate Call girls in Saket Delhi NCRashishs7044
 
Annual General Meeting Presentation Slides
Annual General Meeting Presentation SlidesAnnual General Meeting Presentation Slides
Annual General Meeting Presentation SlidesKeppelCorporation
 
Pitch Deck Teardown: Geodesic.Life's $500k Pre-seed deck
Pitch Deck Teardown: Geodesic.Life's $500k Pre-seed deckPitch Deck Teardown: Geodesic.Life's $500k Pre-seed deck
Pitch Deck Teardown: Geodesic.Life's $500k Pre-seed deckHajeJanKamps
 
APRIL2024_UKRAINE_xml_0000000000000 .pdf
APRIL2024_UKRAINE_xml_0000000000000 .pdfAPRIL2024_UKRAINE_xml_0000000000000 .pdf
APRIL2024_UKRAINE_xml_0000000000000 .pdfRbc Rbcua
 
International Business Environments and Operations 16th Global Edition test b...
International Business Environments and Operations 16th Global Edition test b...International Business Environments and Operations 16th Global Edition test b...
International Business Environments and Operations 16th Global Edition test b...ssuserf63bd7
 
Marketplace and Quality Assurance Presentation - Vincent Chirchir
Marketplace and Quality Assurance Presentation - Vincent ChirchirMarketplace and Quality Assurance Presentation - Vincent Chirchir
Marketplace and Quality Assurance Presentation - Vincent Chirchirictsugar
 
Independent Call Girls Andheri Nightlaila 9967584737
Independent Call Girls Andheri Nightlaila 9967584737Independent Call Girls Andheri Nightlaila 9967584737
Independent Call Girls Andheri Nightlaila 9967584737Riya Pathan
 
/:Call Girls In Indirapuram Ghaziabad ➥9990211544 Independent Best Escorts In...
/:Call Girls In Indirapuram Ghaziabad ➥9990211544 Independent Best Escorts In.../:Call Girls In Indirapuram Ghaziabad ➥9990211544 Independent Best Escorts In...
/:Call Girls In Indirapuram Ghaziabad ➥9990211544 Independent Best Escorts In...lizamodels9
 
Lowrate Call Girls In Sector 18 Noida ❤️8860477959 Escorts 100% Genuine Servi...
Lowrate Call Girls In Sector 18 Noida ❤️8860477959 Escorts 100% Genuine Servi...Lowrate Call Girls In Sector 18 Noida ❤️8860477959 Escorts 100% Genuine Servi...
Lowrate Call Girls In Sector 18 Noida ❤️8860477959 Escorts 100% Genuine Servi...lizamodels9
 
BEST Call Girls In Greater Noida ✨ 9773824855 ✨ Escorts Service In Delhi Ncr,
BEST Call Girls In Greater Noida ✨ 9773824855 ✨ Escorts Service In Delhi Ncr,BEST Call Girls In Greater Noida ✨ 9773824855 ✨ Escorts Service In Delhi Ncr,
BEST Call Girls In Greater Noida ✨ 9773824855 ✨ Escorts Service In Delhi Ncr,noida100girls
 
Call Girls In Radisson Blu Hotel New Delhi Paschim Vihar ❤️8860477959 Escorts...
Call Girls In Radisson Blu Hotel New Delhi Paschim Vihar ❤️8860477959 Escorts...Call Girls In Radisson Blu Hotel New Delhi Paschim Vihar ❤️8860477959 Escorts...
Call Girls In Radisson Blu Hotel New Delhi Paschim Vihar ❤️8860477959 Escorts...lizamodels9
 
Call Girls In Connaught Place Delhi ❤️88604**77959_Russian 100% Genuine Escor...
Call Girls In Connaught Place Delhi ❤️88604**77959_Russian 100% Genuine Escor...Call Girls In Connaught Place Delhi ❤️88604**77959_Russian 100% Genuine Escor...
Call Girls In Connaught Place Delhi ❤️88604**77959_Russian 100% Genuine Escor...lizamodels9
 
Islamabad Escorts | Call 03070433345 | Escort Service in Islamabad
Islamabad Escorts | Call 03070433345 | Escort Service in IslamabadIslamabad Escorts | Call 03070433345 | Escort Service in Islamabad
Islamabad Escorts | Call 03070433345 | Escort Service in IslamabadAyesha Khan
 
8447779800, Low rate Call girls in Tughlakabad Delhi NCR
8447779800, Low rate Call girls in Tughlakabad Delhi NCR8447779800, Low rate Call girls in Tughlakabad Delhi NCR
8447779800, Low rate Call girls in Tughlakabad Delhi NCRashishs7044
 
Contemporary Economic Issues Facing the Filipino Entrepreneur (1).pptx
Contemporary Economic Issues Facing the Filipino Entrepreneur (1).pptxContemporary Economic Issues Facing the Filipino Entrepreneur (1).pptx
Contemporary Economic Issues Facing the Filipino Entrepreneur (1).pptxMarkAnthonyAurellano
 
Digital Transformation in the PLM domain - distrib.pdf
Digital Transformation in the PLM domain - distrib.pdfDigital Transformation in the PLM domain - distrib.pdf
Digital Transformation in the PLM domain - distrib.pdfJos Voskuil
 

Recently uploaded (20)

8447779800, Low rate Call girls in Uttam Nagar Delhi NCR
8447779800, Low rate Call girls in Uttam Nagar Delhi NCR8447779800, Low rate Call girls in Uttam Nagar Delhi NCR
8447779800, Low rate Call girls in Uttam Nagar Delhi NCR
 
8447779800, Low rate Call girls in New Ashok Nagar Delhi NCR
8447779800, Low rate Call girls in New Ashok Nagar Delhi NCR8447779800, Low rate Call girls in New Ashok Nagar Delhi NCR
8447779800, Low rate Call girls in New Ashok Nagar Delhi NCR
 
8447779800, Low rate Call girls in Saket Delhi NCR
8447779800, Low rate Call girls in Saket Delhi NCR8447779800, Low rate Call girls in Saket Delhi NCR
8447779800, Low rate Call girls in Saket Delhi NCR
 
Annual General Meeting Presentation Slides
Annual General Meeting Presentation SlidesAnnual General Meeting Presentation Slides
Annual General Meeting Presentation Slides
 
Pitch Deck Teardown: Geodesic.Life's $500k Pre-seed deck
Pitch Deck Teardown: Geodesic.Life's $500k Pre-seed deckPitch Deck Teardown: Geodesic.Life's $500k Pre-seed deck
Pitch Deck Teardown: Geodesic.Life's $500k Pre-seed deck
 
APRIL2024_UKRAINE_xml_0000000000000 .pdf
APRIL2024_UKRAINE_xml_0000000000000 .pdfAPRIL2024_UKRAINE_xml_0000000000000 .pdf
APRIL2024_UKRAINE_xml_0000000000000 .pdf
 
International Business Environments and Operations 16th Global Edition test b...
International Business Environments and Operations 16th Global Edition test b...International Business Environments and Operations 16th Global Edition test b...
International Business Environments and Operations 16th Global Edition test b...
 
Corporate Profile 47Billion Information Technology
Corporate Profile 47Billion Information TechnologyCorporate Profile 47Billion Information Technology
Corporate Profile 47Billion Information Technology
 
Marketplace and Quality Assurance Presentation - Vincent Chirchir
Marketplace and Quality Assurance Presentation - Vincent ChirchirMarketplace and Quality Assurance Presentation - Vincent Chirchir
Marketplace and Quality Assurance Presentation - Vincent Chirchir
 
Independent Call Girls Andheri Nightlaila 9967584737
Independent Call Girls Andheri Nightlaila 9967584737Independent Call Girls Andheri Nightlaila 9967584737
Independent Call Girls Andheri Nightlaila 9967584737
 
/:Call Girls In Indirapuram Ghaziabad ➥9990211544 Independent Best Escorts In...
/:Call Girls In Indirapuram Ghaziabad ➥9990211544 Independent Best Escorts In.../:Call Girls In Indirapuram Ghaziabad ➥9990211544 Independent Best Escorts In...
/:Call Girls In Indirapuram Ghaziabad ➥9990211544 Independent Best Escorts In...
 
Lowrate Call Girls In Sector 18 Noida ❤️8860477959 Escorts 100% Genuine Servi...
Lowrate Call Girls In Sector 18 Noida ❤️8860477959 Escorts 100% Genuine Servi...Lowrate Call Girls In Sector 18 Noida ❤️8860477959 Escorts 100% Genuine Servi...
Lowrate Call Girls In Sector 18 Noida ❤️8860477959 Escorts 100% Genuine Servi...
 
BEST Call Girls In Greater Noida ✨ 9773824855 ✨ Escorts Service In Delhi Ncr,
BEST Call Girls In Greater Noida ✨ 9773824855 ✨ Escorts Service In Delhi Ncr,BEST Call Girls In Greater Noida ✨ 9773824855 ✨ Escorts Service In Delhi Ncr,
BEST Call Girls In Greater Noida ✨ 9773824855 ✨ Escorts Service In Delhi Ncr,
 
Call Girls In Radisson Blu Hotel New Delhi Paschim Vihar ❤️8860477959 Escorts...
Call Girls In Radisson Blu Hotel New Delhi Paschim Vihar ❤️8860477959 Escorts...Call Girls In Radisson Blu Hotel New Delhi Paschim Vihar ❤️8860477959 Escorts...
Call Girls In Radisson Blu Hotel New Delhi Paschim Vihar ❤️8860477959 Escorts...
 
Call Girls In Connaught Place Delhi ❤️88604**77959_Russian 100% Genuine Escor...
Call Girls In Connaught Place Delhi ❤️88604**77959_Russian 100% Genuine Escor...Call Girls In Connaught Place Delhi ❤️88604**77959_Russian 100% Genuine Escor...
Call Girls In Connaught Place Delhi ❤️88604**77959_Russian 100% Genuine Escor...
 
Islamabad Escorts | Call 03070433345 | Escort Service in Islamabad
Islamabad Escorts | Call 03070433345 | Escort Service in IslamabadIslamabad Escorts | Call 03070433345 | Escort Service in Islamabad
Islamabad Escorts | Call 03070433345 | Escort Service in Islamabad
 
8447779800, Low rate Call girls in Tughlakabad Delhi NCR
8447779800, Low rate Call girls in Tughlakabad Delhi NCR8447779800, Low rate Call girls in Tughlakabad Delhi NCR
8447779800, Low rate Call girls in Tughlakabad Delhi NCR
 
Contemporary Economic Issues Facing the Filipino Entrepreneur (1).pptx
Contemporary Economic Issues Facing the Filipino Entrepreneur (1).pptxContemporary Economic Issues Facing the Filipino Entrepreneur (1).pptx
Contemporary Economic Issues Facing the Filipino Entrepreneur (1).pptx
 
Digital Transformation in the PLM domain - distrib.pdf
Digital Transformation in the PLM domain - distrib.pdfDigital Transformation in the PLM domain - distrib.pdf
Digital Transformation in the PLM domain - distrib.pdf
 
Japan IT Week 2024 Brochure by 47Billion (English)
Japan IT Week 2024 Brochure by 47Billion (English)Japan IT Week 2024 Brochure by 47Billion (English)
Japan IT Week 2024 Brochure by 47Billion (English)
 

Distributions: Normal with Matt Hansen at StatStuff

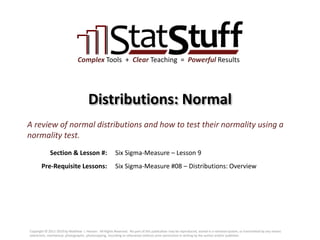
  • 1. Section & Lesson #: Pre-Requisite Lessons: Complex Tools + Clear Teaching = Powerful Results Distributions: Normal Six Sigma-Measure – Lesson 9 A review of normal distributions and how to test their normality using a normality test. Six Sigma-Measure #08 – Distributions: Overview Copyright © 2011-2019 by Matthew J. Hansen. All Rights Reserved. No part of this publication may be reproduced, stored in a retrieval system, or transmitted by any means (electronic, mechanical, photographic, photocopying, recording or otherwise) without prior permission in writing by the author and/or publisher.
  • 2. Normal Distributions (bell curve) o Why is it called a “normal” distribution? • “Normal” implies the typical randomness that we expect to occur in life. • If there was no randomness, then we can presume there is some influence (bias or skewness). • We want the data that we analyze to be unbiased, therefore we need to ensure it reflects the “normal” randomness we would expect.  Otherwise if the data is biased, then why analyze it if we can’t be confident we’ll find the right root cause? o A normal distribution is bell-shaped. • The bell shape is created because most of the data points fall in the middle. • The shape of the bell is influenced by the mean and standard deviation. o Characteristics of a normal distribution. • Completely described by its mean and standard deviation. • The tails on either end of the curve extend +/- infinity. • The area under the curve represents 100% of possible observations. • The curve is symmetrical where 50% of the data points fall on either side of the mean. • The mean (average) will be relatively equal to the median (50th percentile). Copyright © 2011-2019 by Matthew J. Hansen. All Rights Reserved. No part of this publication may be reproduced, stored in a retrieval system, or transmitted by any means (electronic, mechanical, photographic, photocopying, recording or otherwise) without prior permission in writing by the author and/or publisher.
  • 3. Normality Testing o A distribution with a bell curve doesn’t necessarily mean it’s “normal”. • It’s not uncommon for a distribution to appear normal, but it really isn’t. • The normality of the distribution should be statistically tested. o Use the Anderson-Darling test of a Normality Test or Probability Plot. • A normality test or probability plot will plot the data on a logarithmic scale.  In Minitab, go to Stat > Basic Statistics > Normality Test or go to Graph > Probability Plot • Normal data will appear like a straight line; Minitab will try to fit a line along the data points.  A “fat pencil” test is if a fat pencil can lay across and cover all the data points, then it’s probably a normal distribution. • A better test is to examine the p-value of the Anderson-Darling (AD) test.  If p-value > 0.05, then it’s normal.  If p-value < 0.05, then it’s not normal. – In these examples, 0.05 is referring to the alpha risk which is the % chance of being right when concluding the data is normal. 5% is a commonly acceptable threshold. Copyright © 2011-2019 by Matthew J. Hansen. All Rights Reserved. No part of this publication may be reproduced, stored in a retrieval system, or transmitted by any means (electronic, mechanical, photographic, photocopying, recording or otherwise) without prior permission in writing by the author and/or publisher. 3 This p-value is > 0.05 which means it’s a normal distribution
  • 4. Practical Application o Open the “Minitab Sample Data.MPJ” file and try to do the following: • Run a normality test on each continuous metric. • Which metrics are normally distributed? How can you prove it? o Next, pull some historical data for at least 2 continuous metrics used by your organization and try following the same steps described above. Copyright © 2011-2019 by Matthew J. Hansen. All Rights Reserved. No part of this publication may be reproduced, stored in a retrieval system, or transmitted by any means (electronic, mechanical, photographic, photocopying, recording or otherwise) without prior permission in writing by the author and/or publisher. 4