Download to read offline
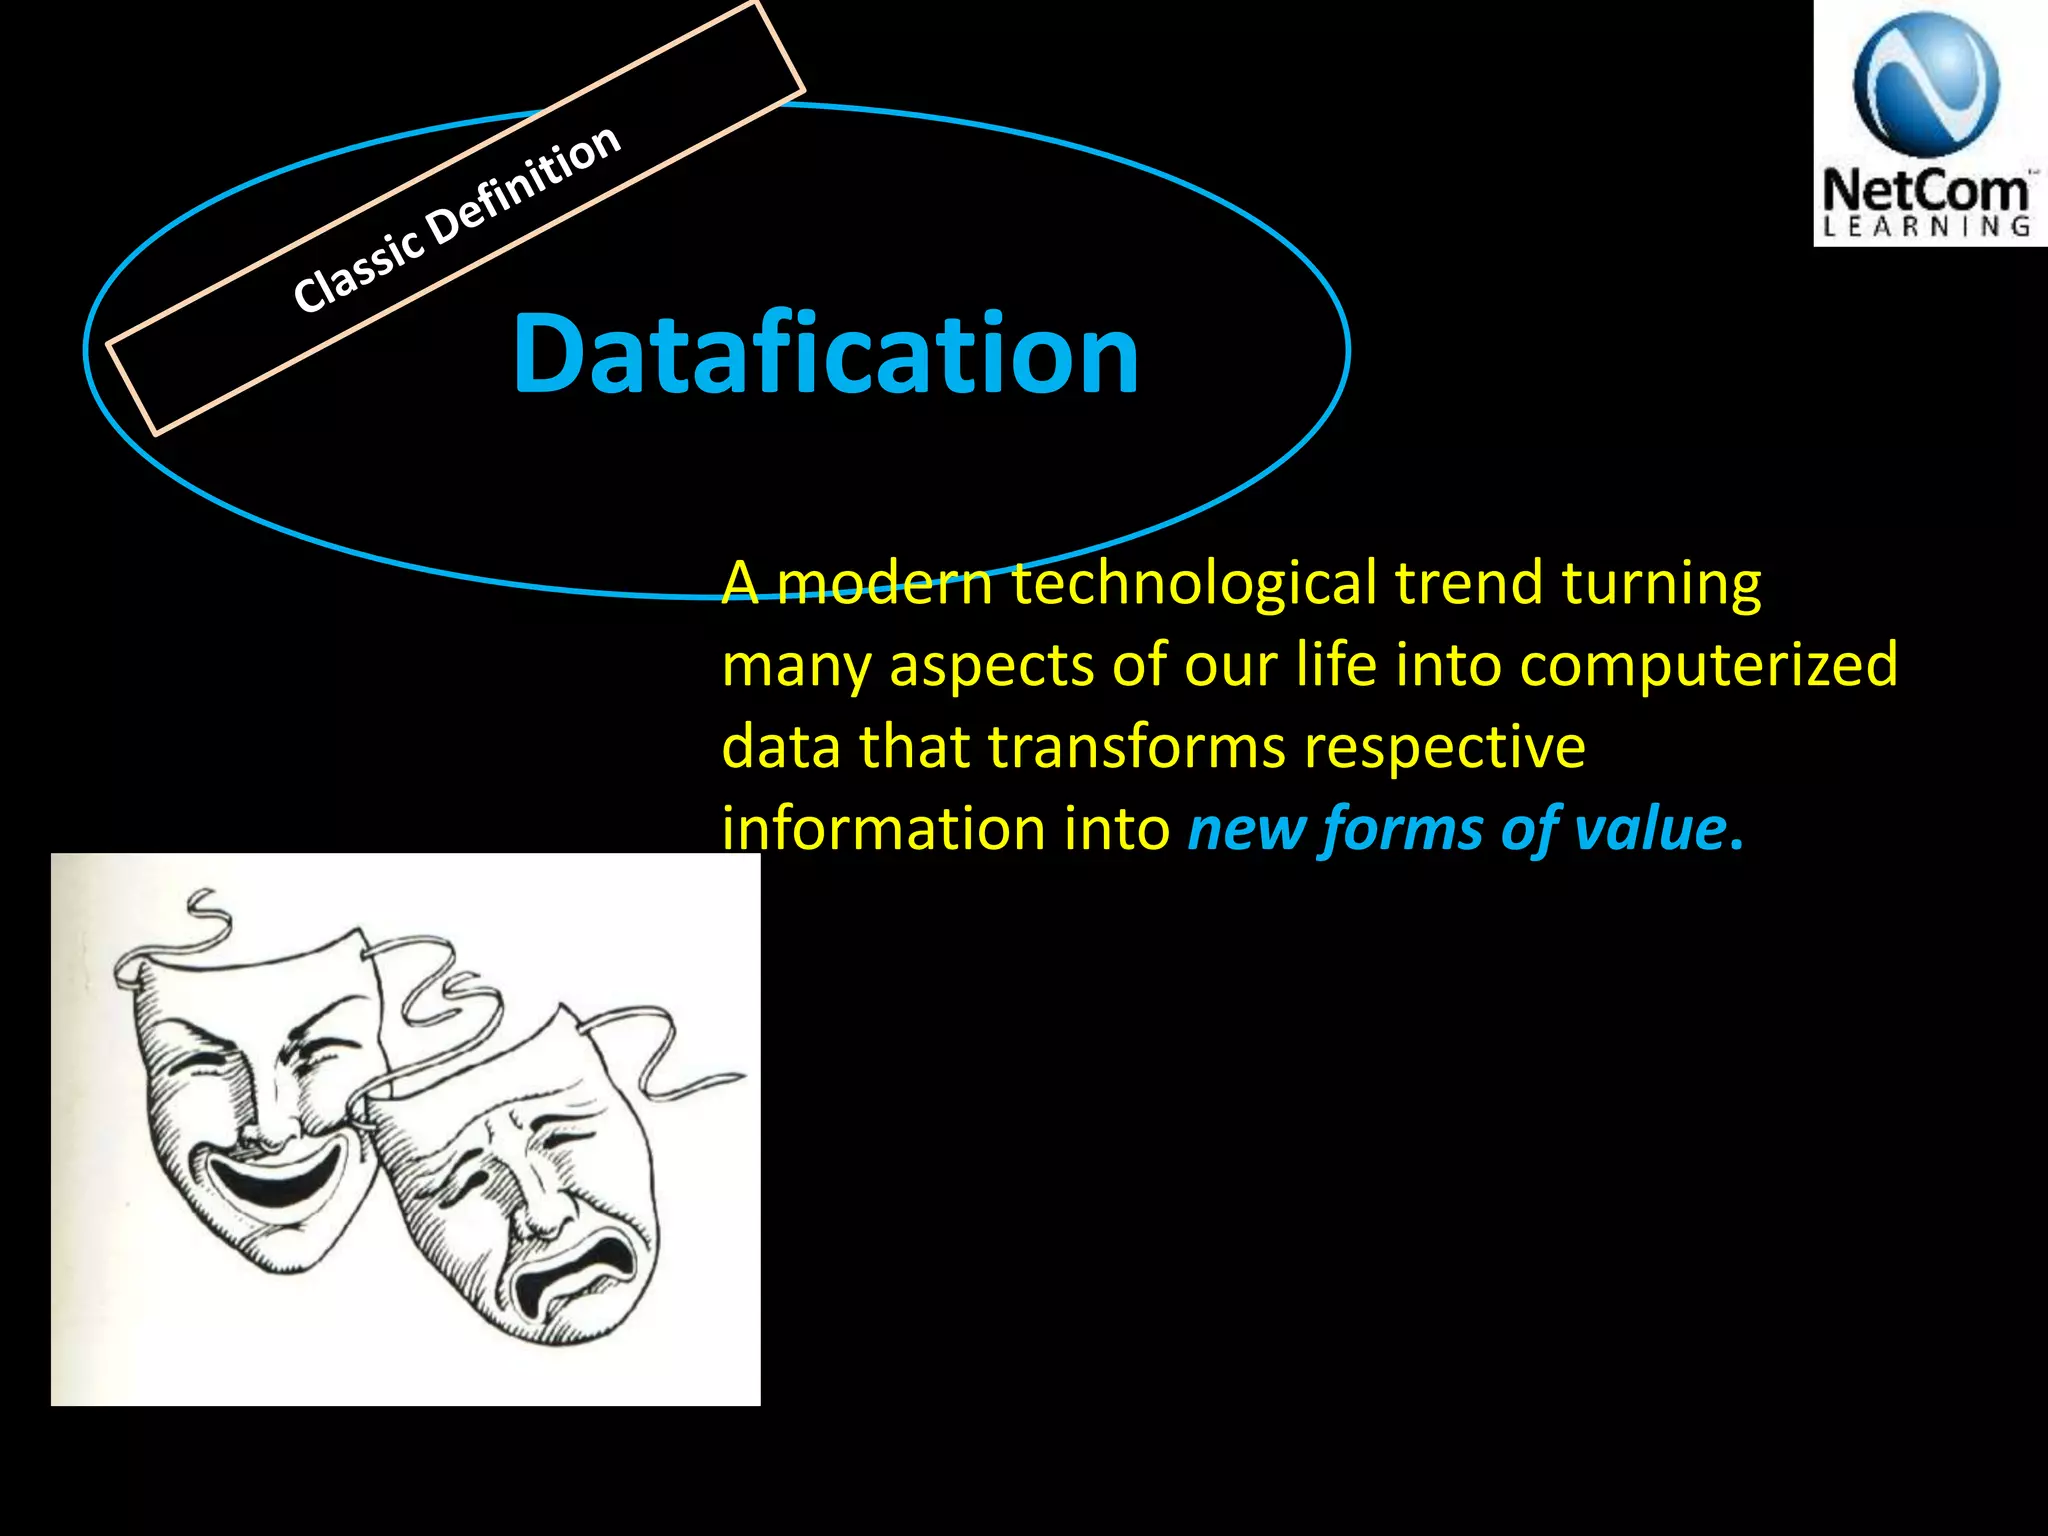
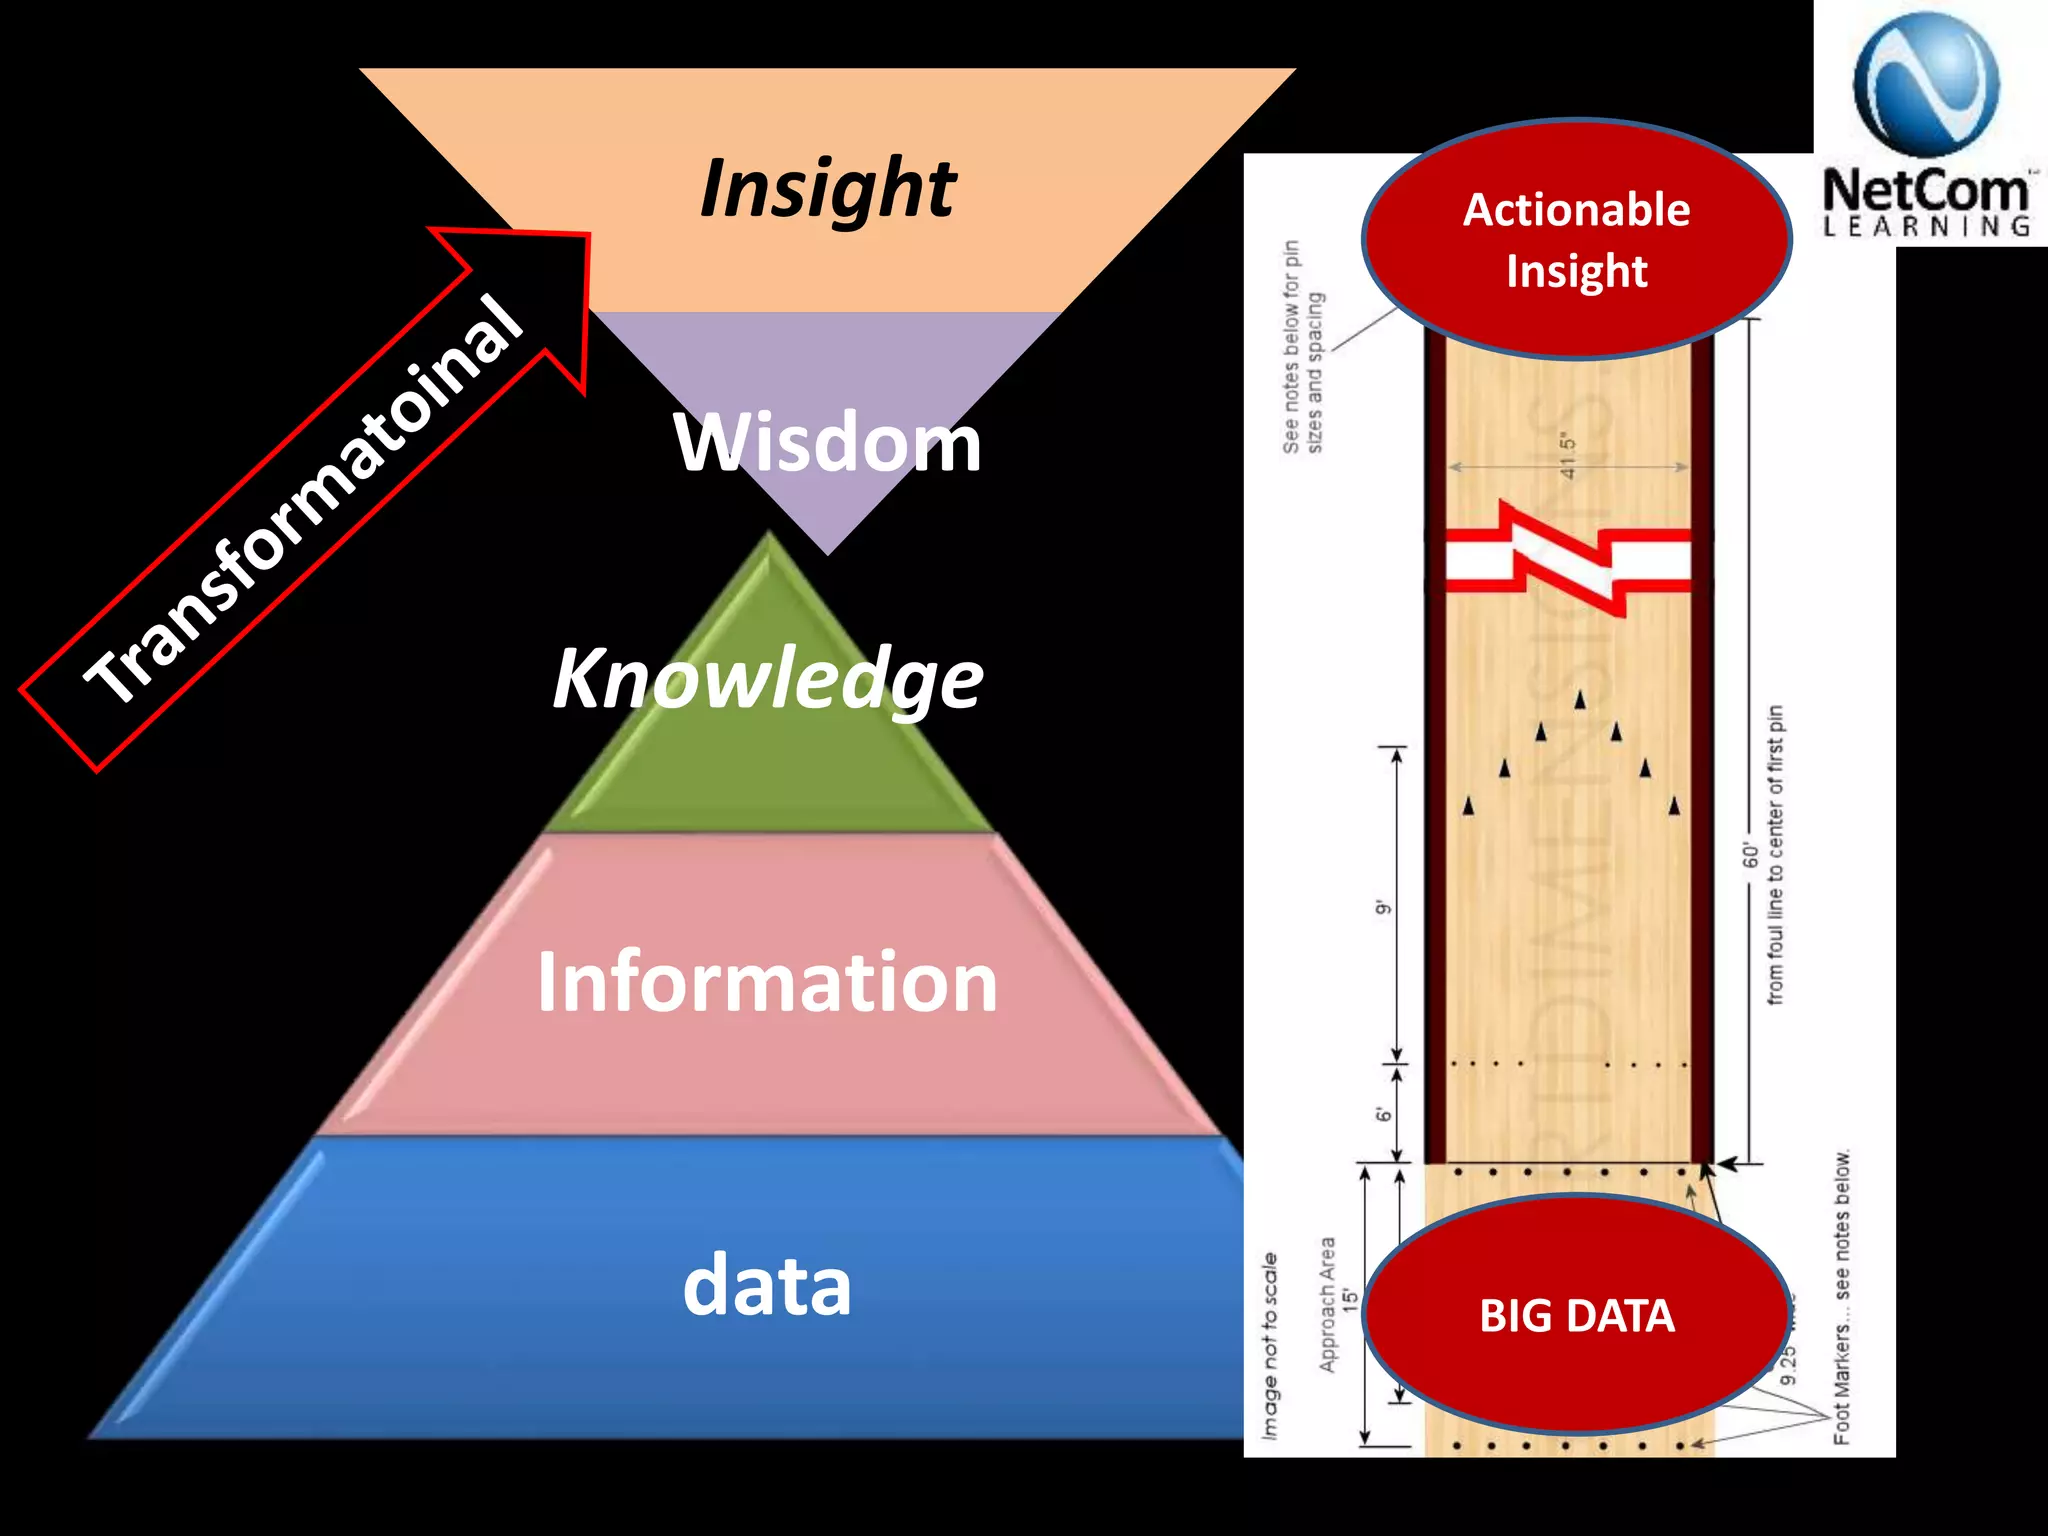
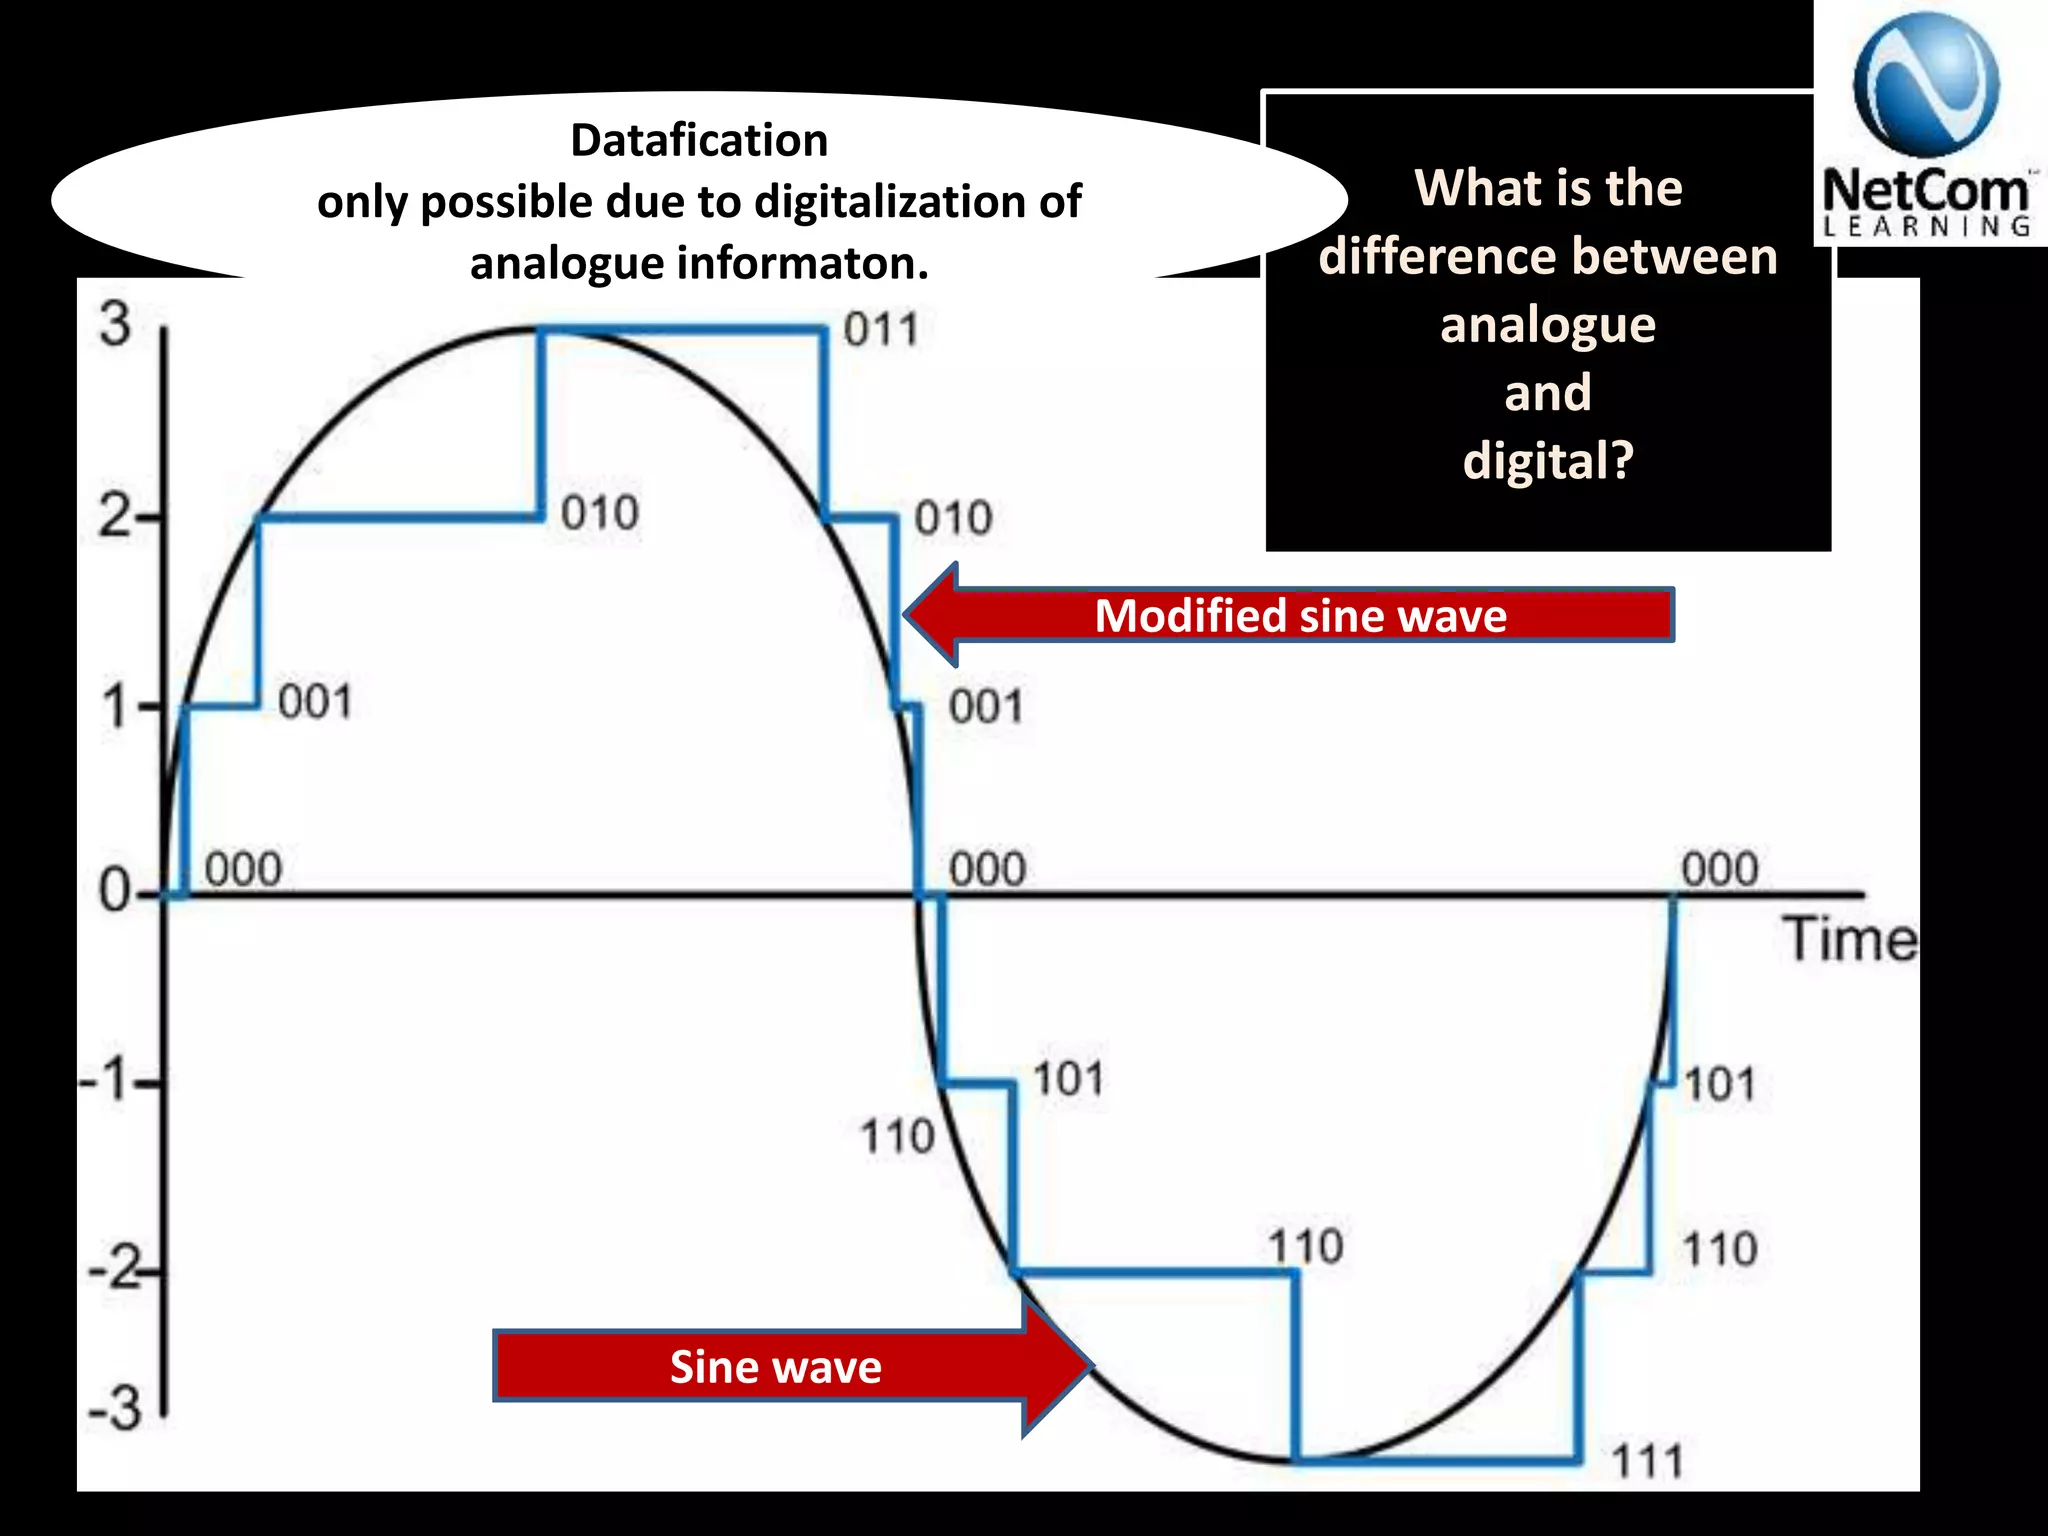
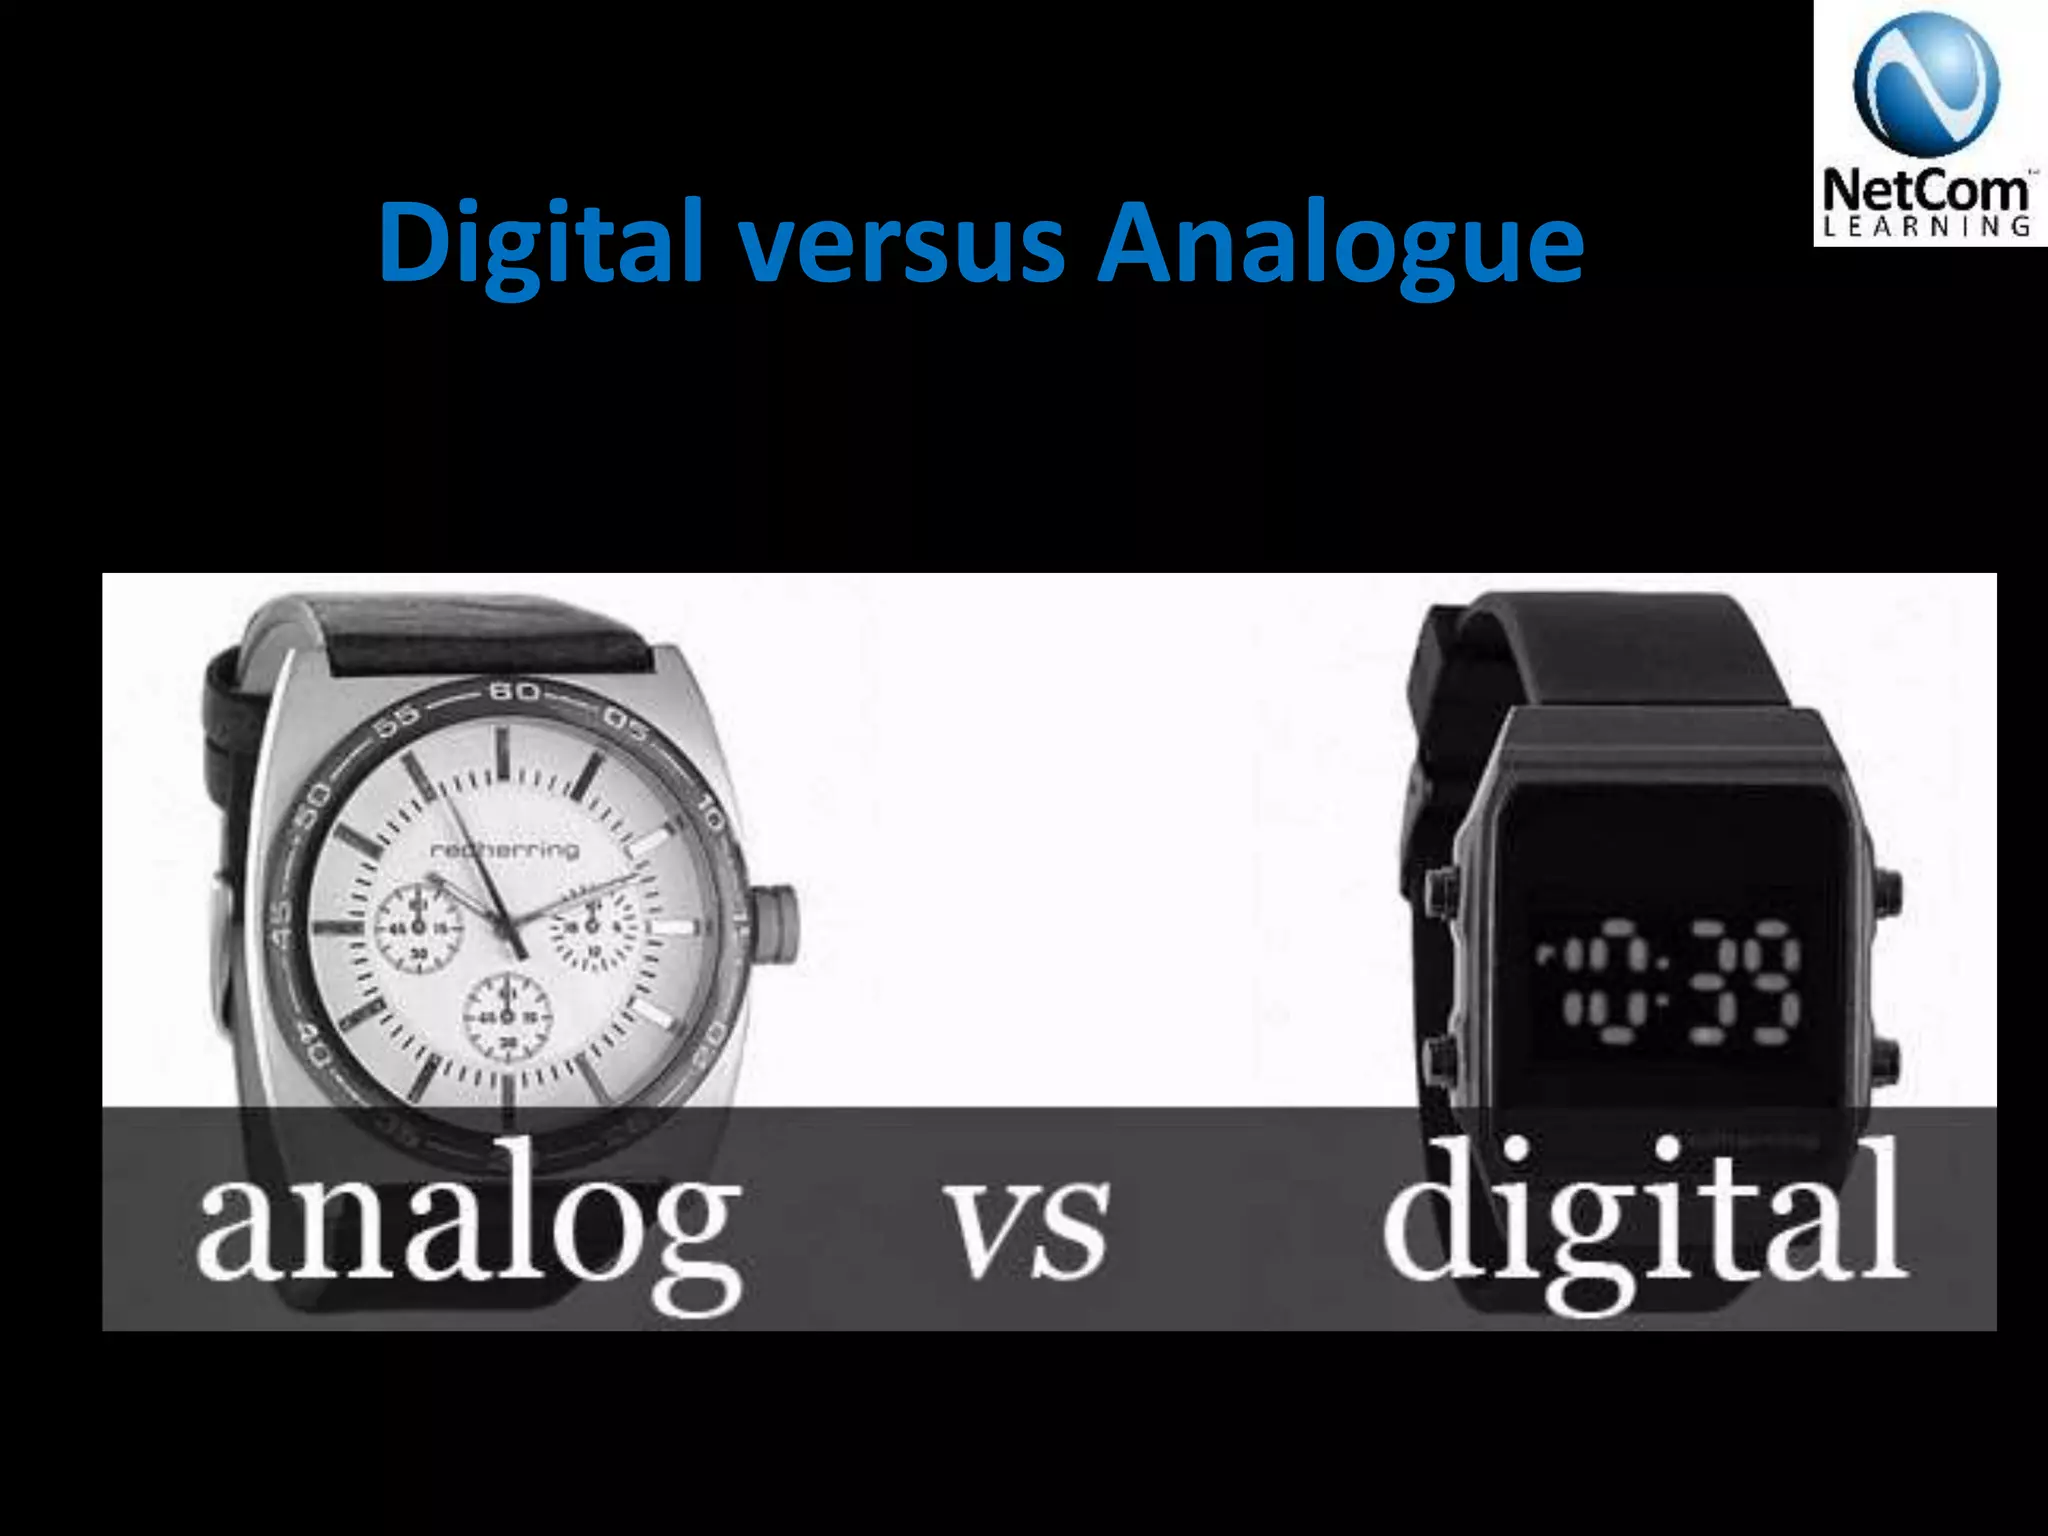
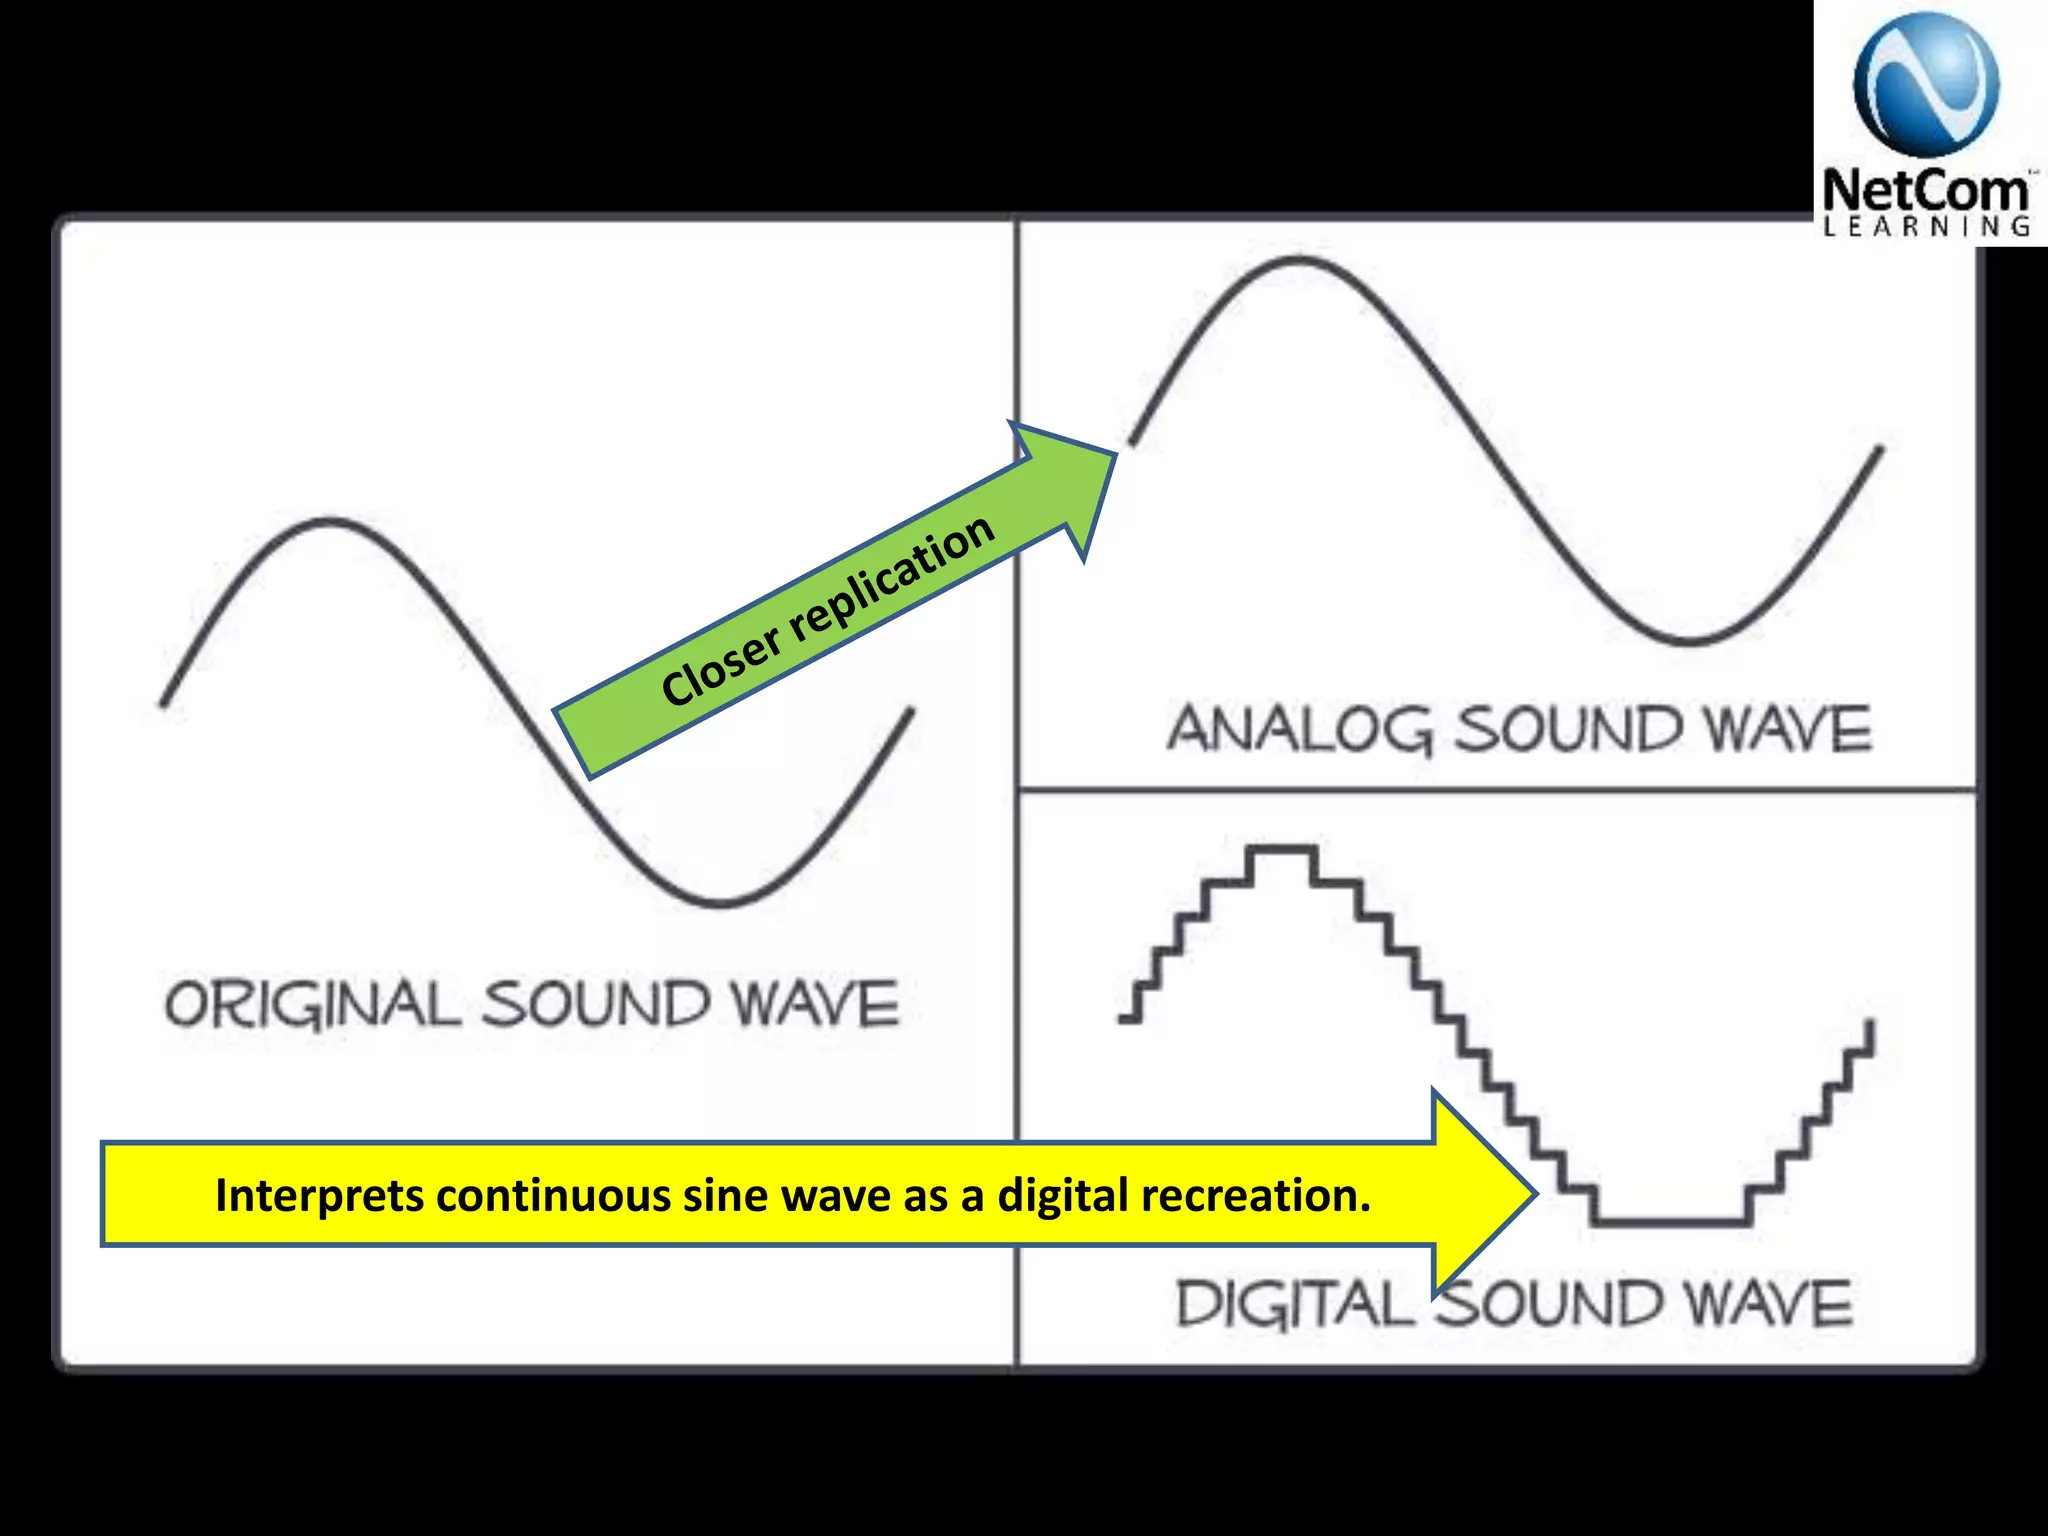


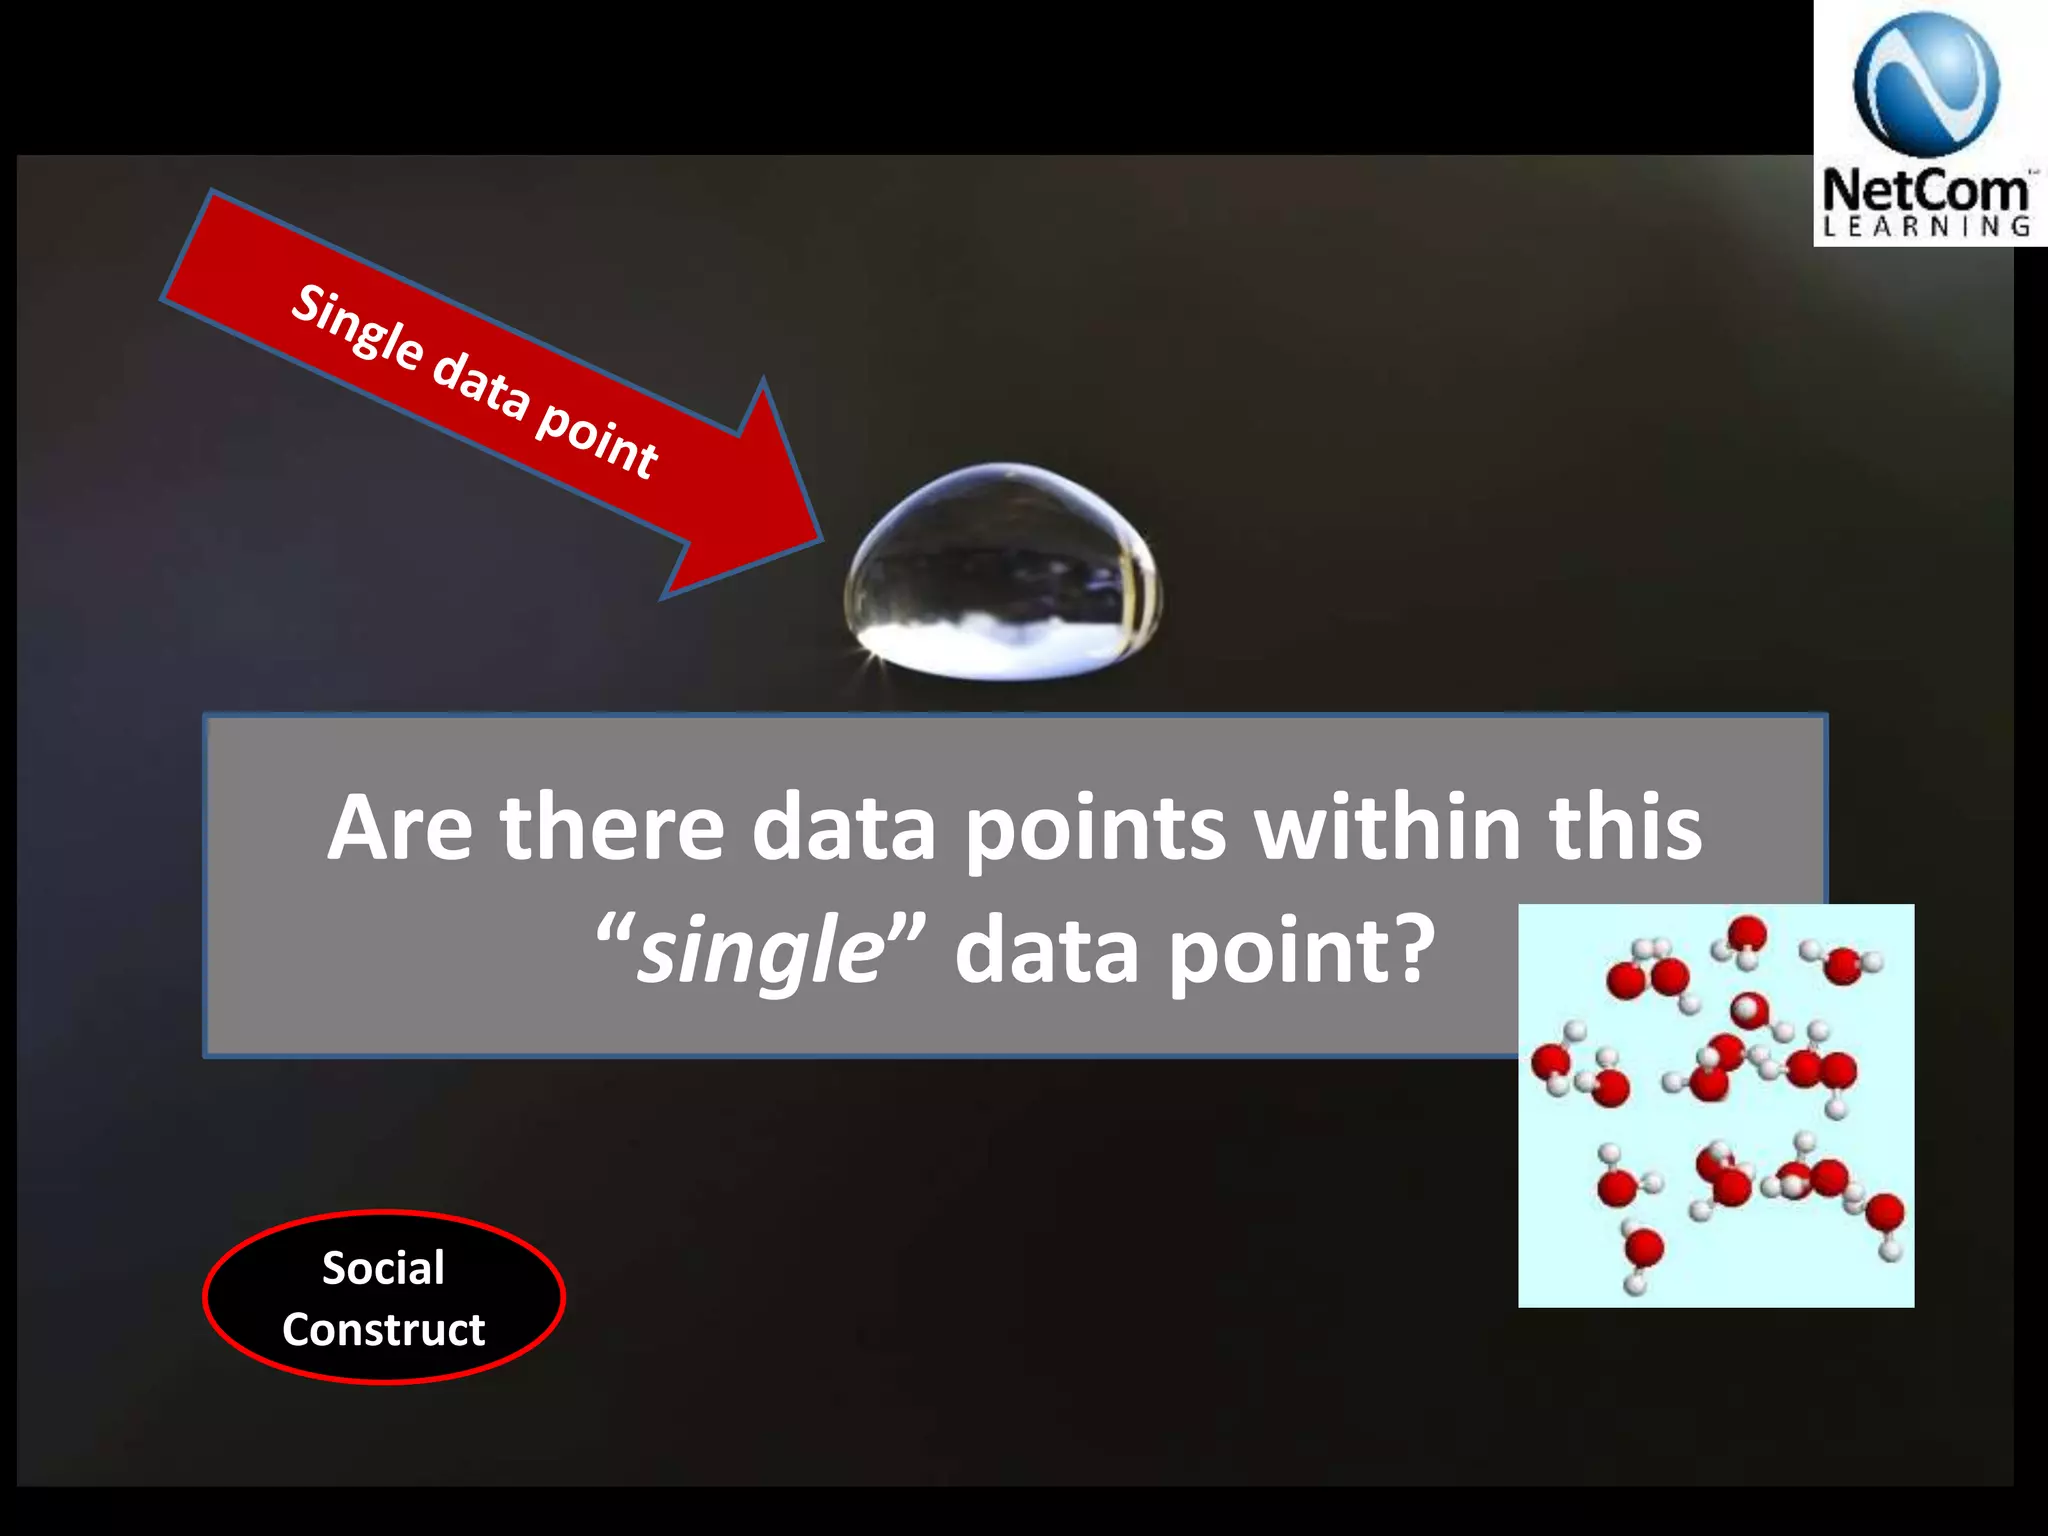


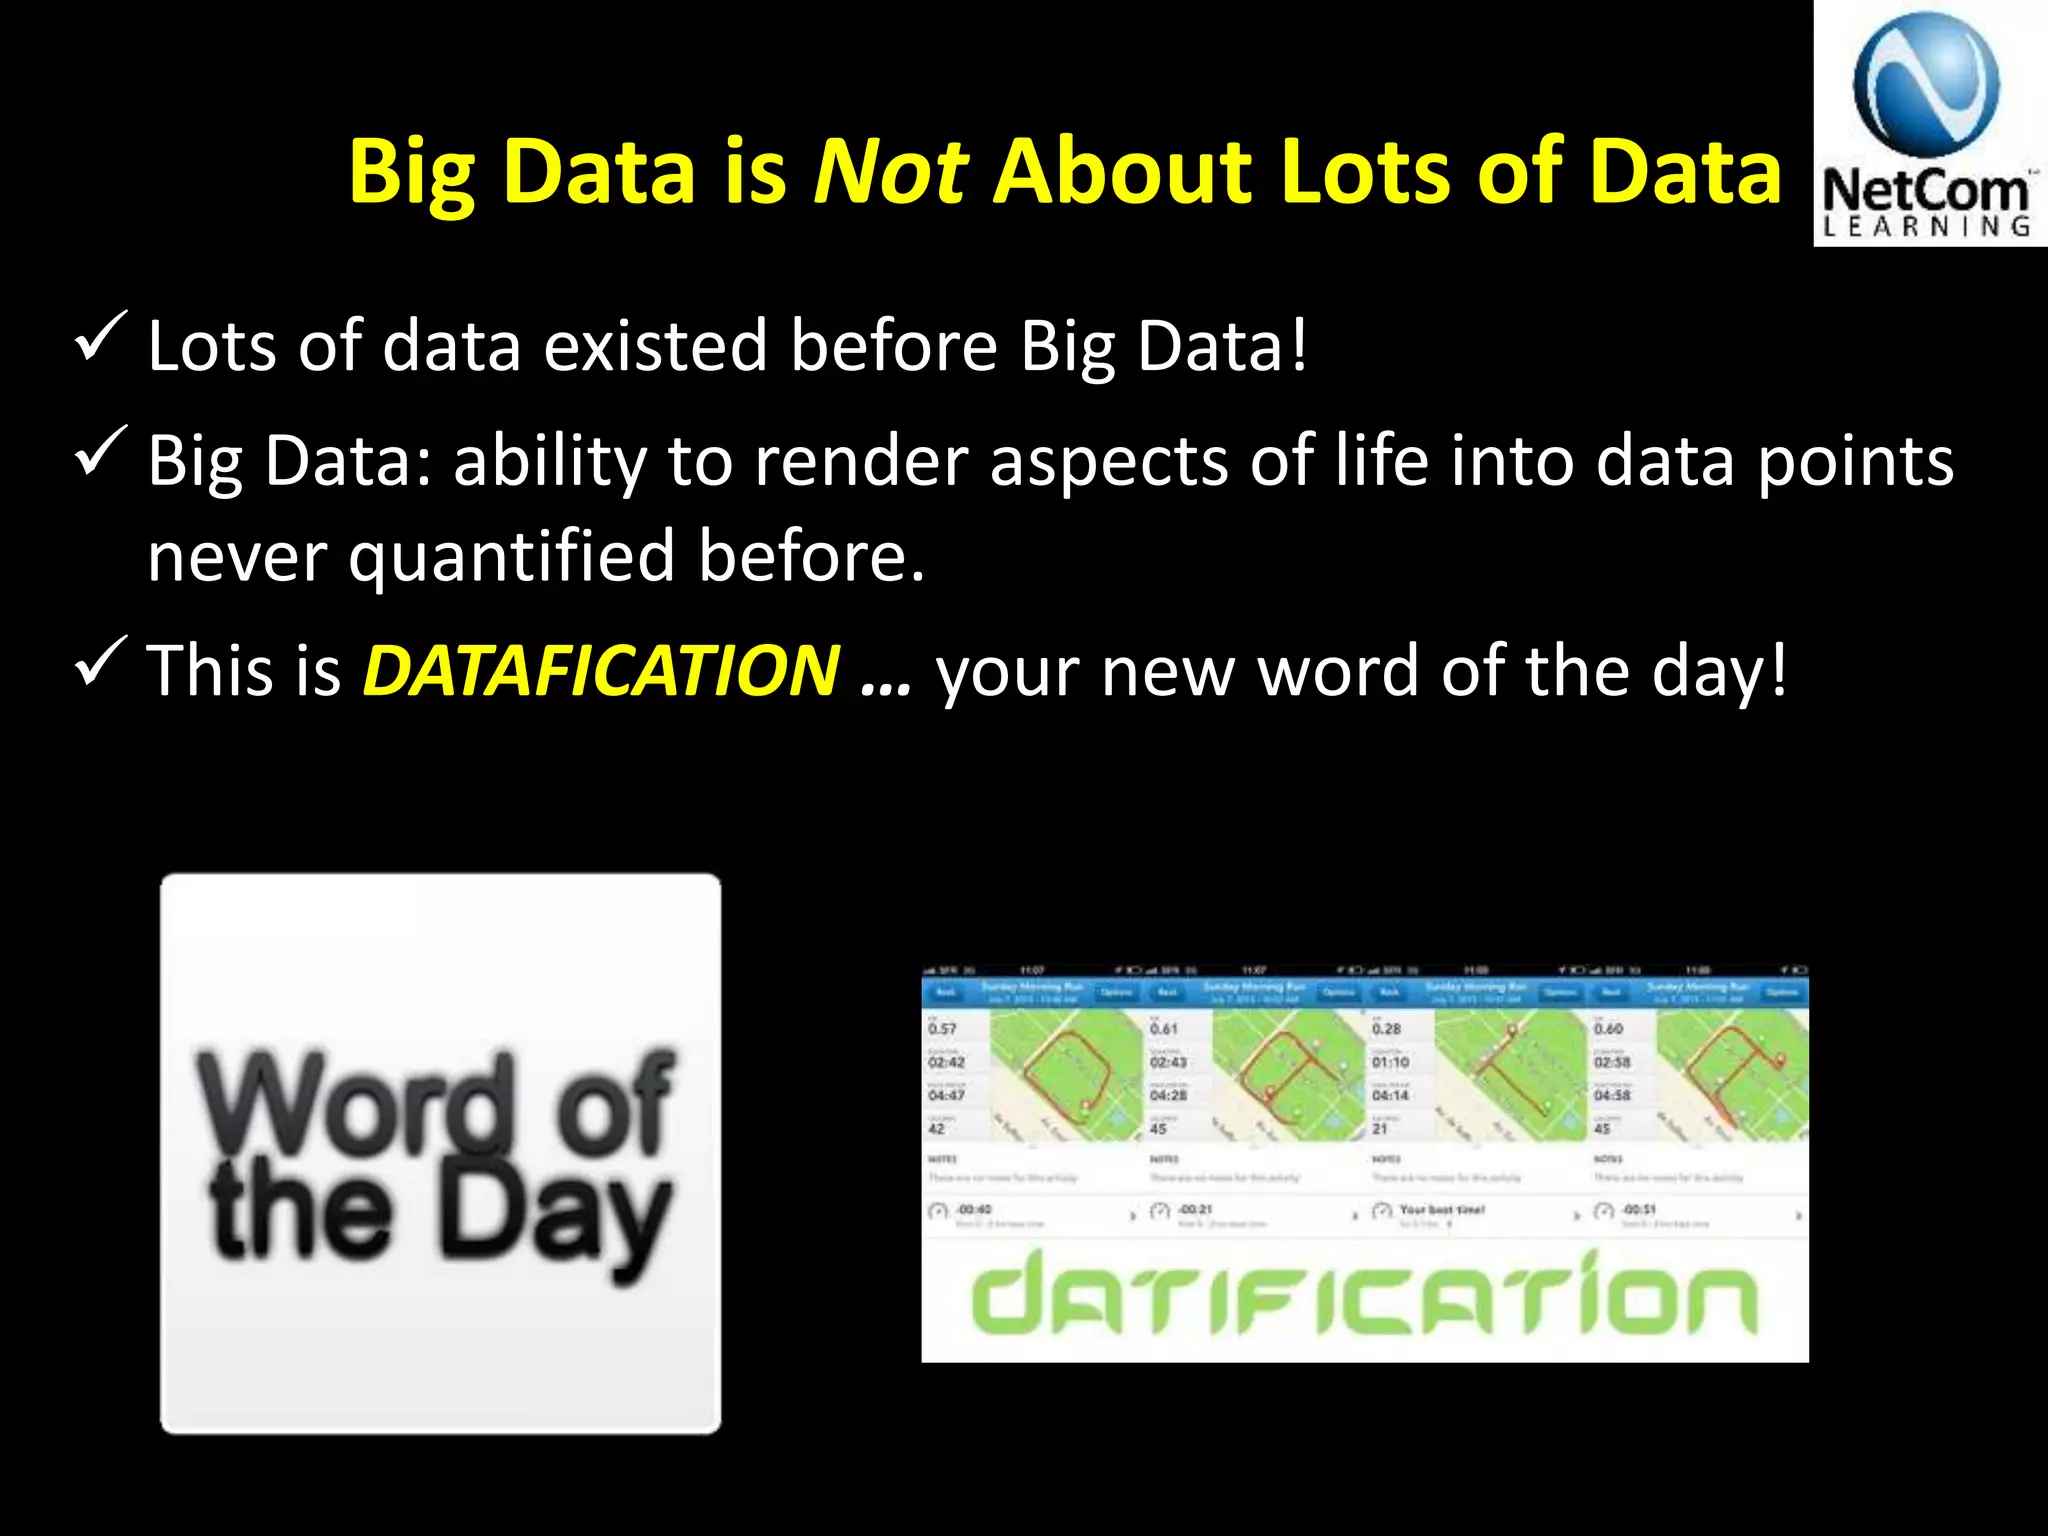
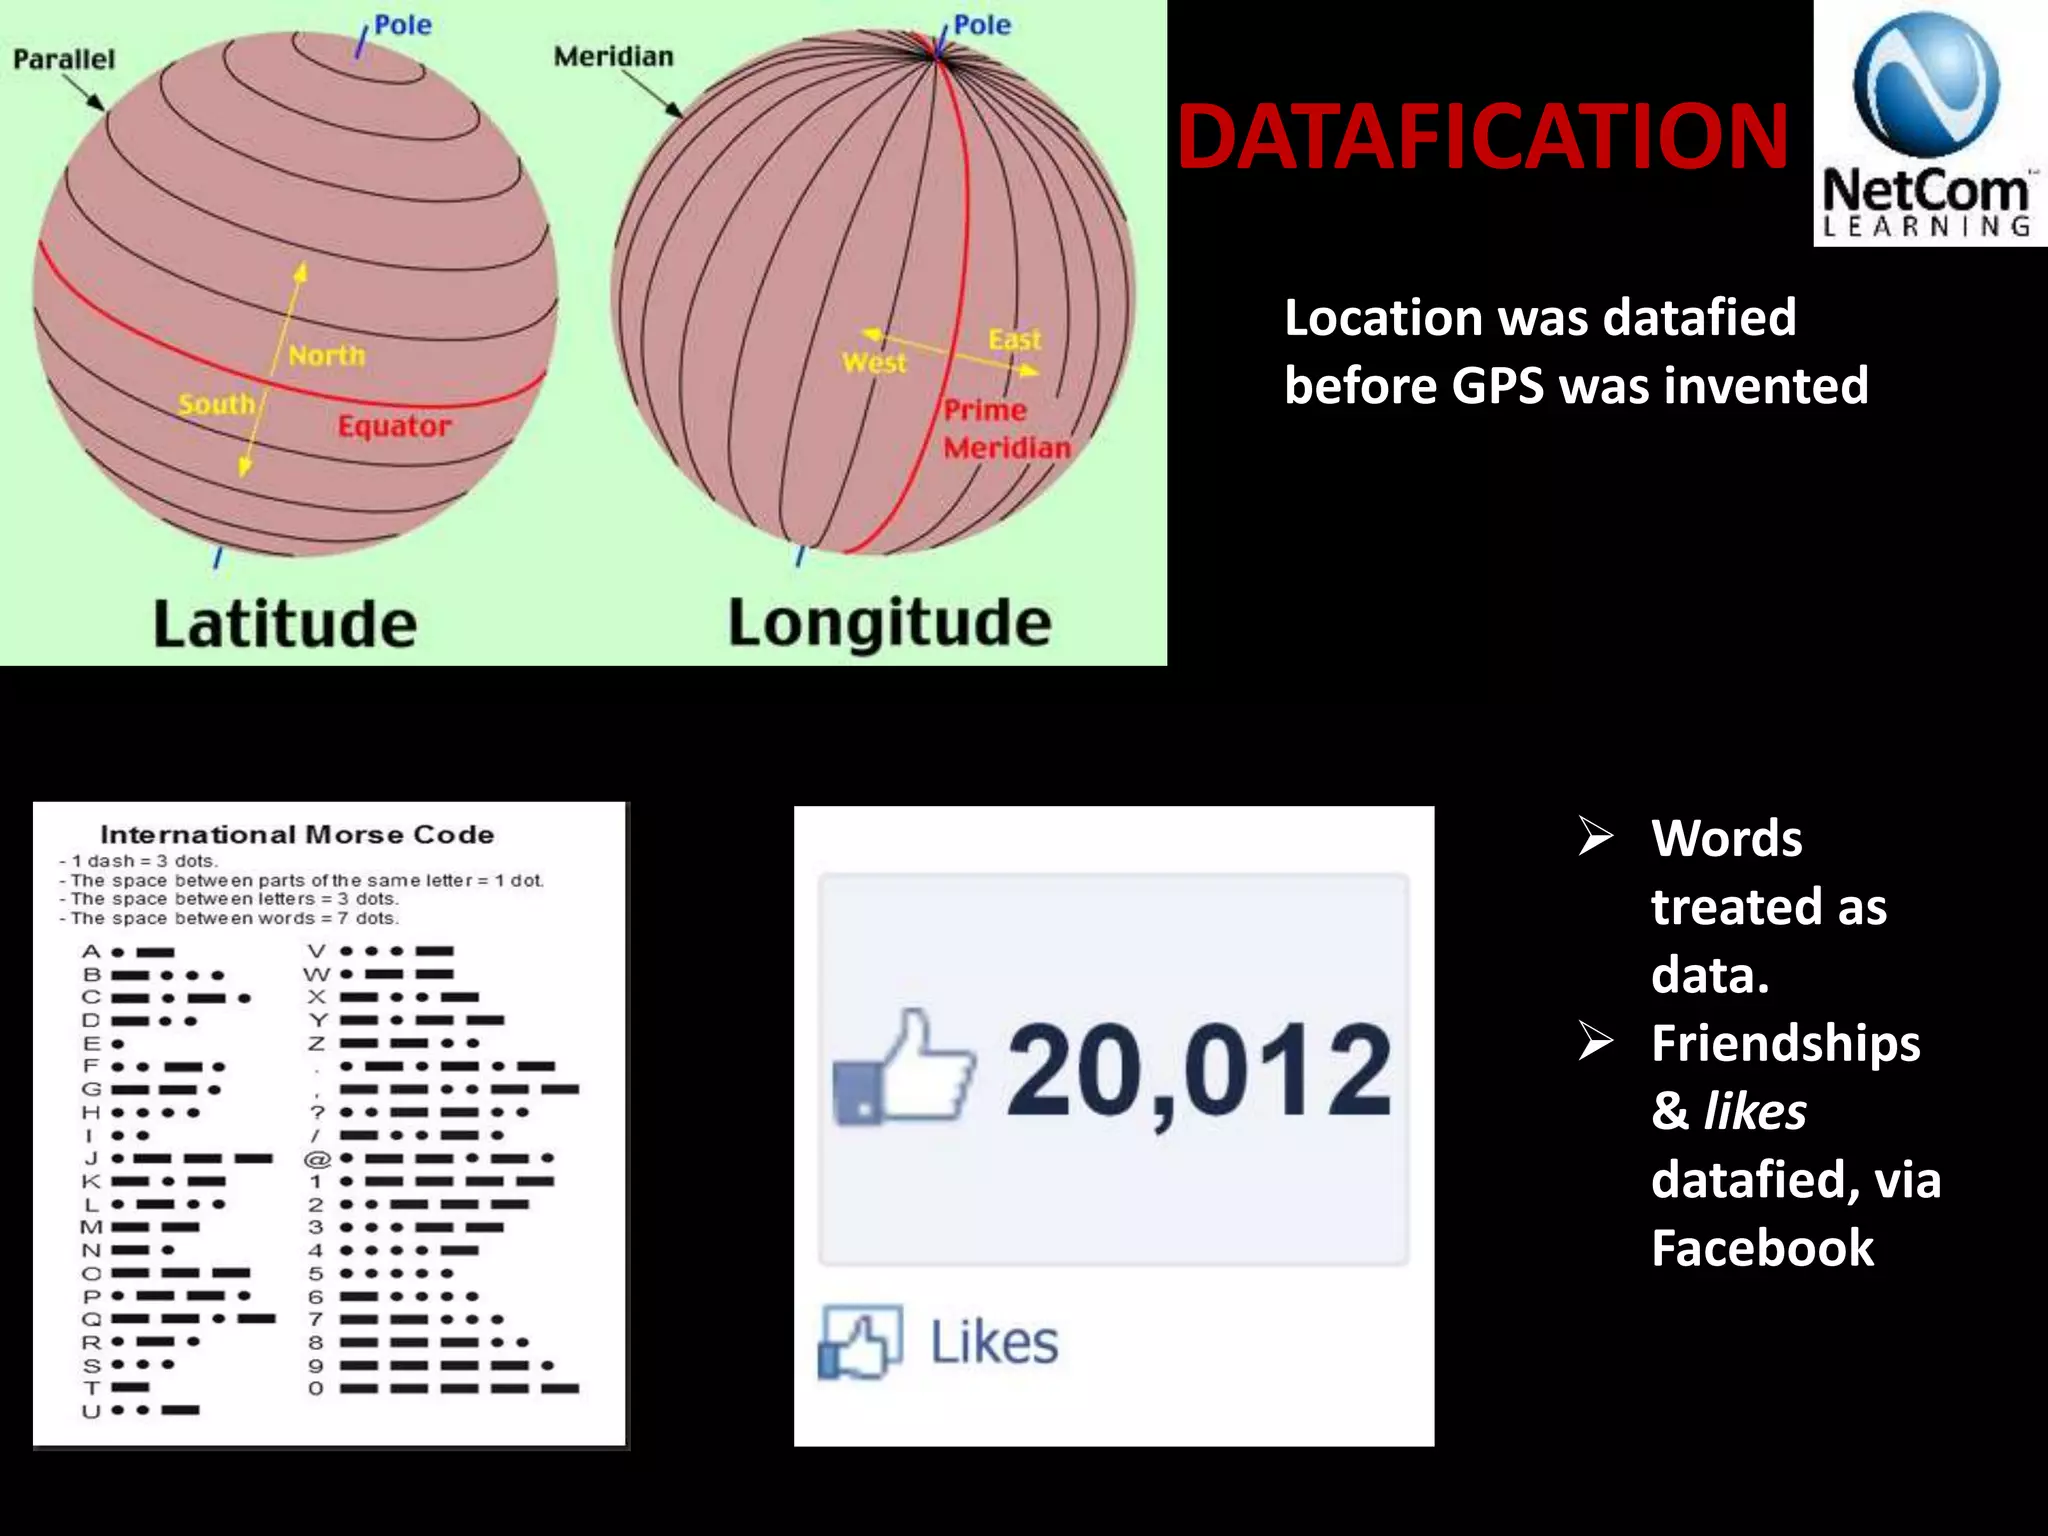
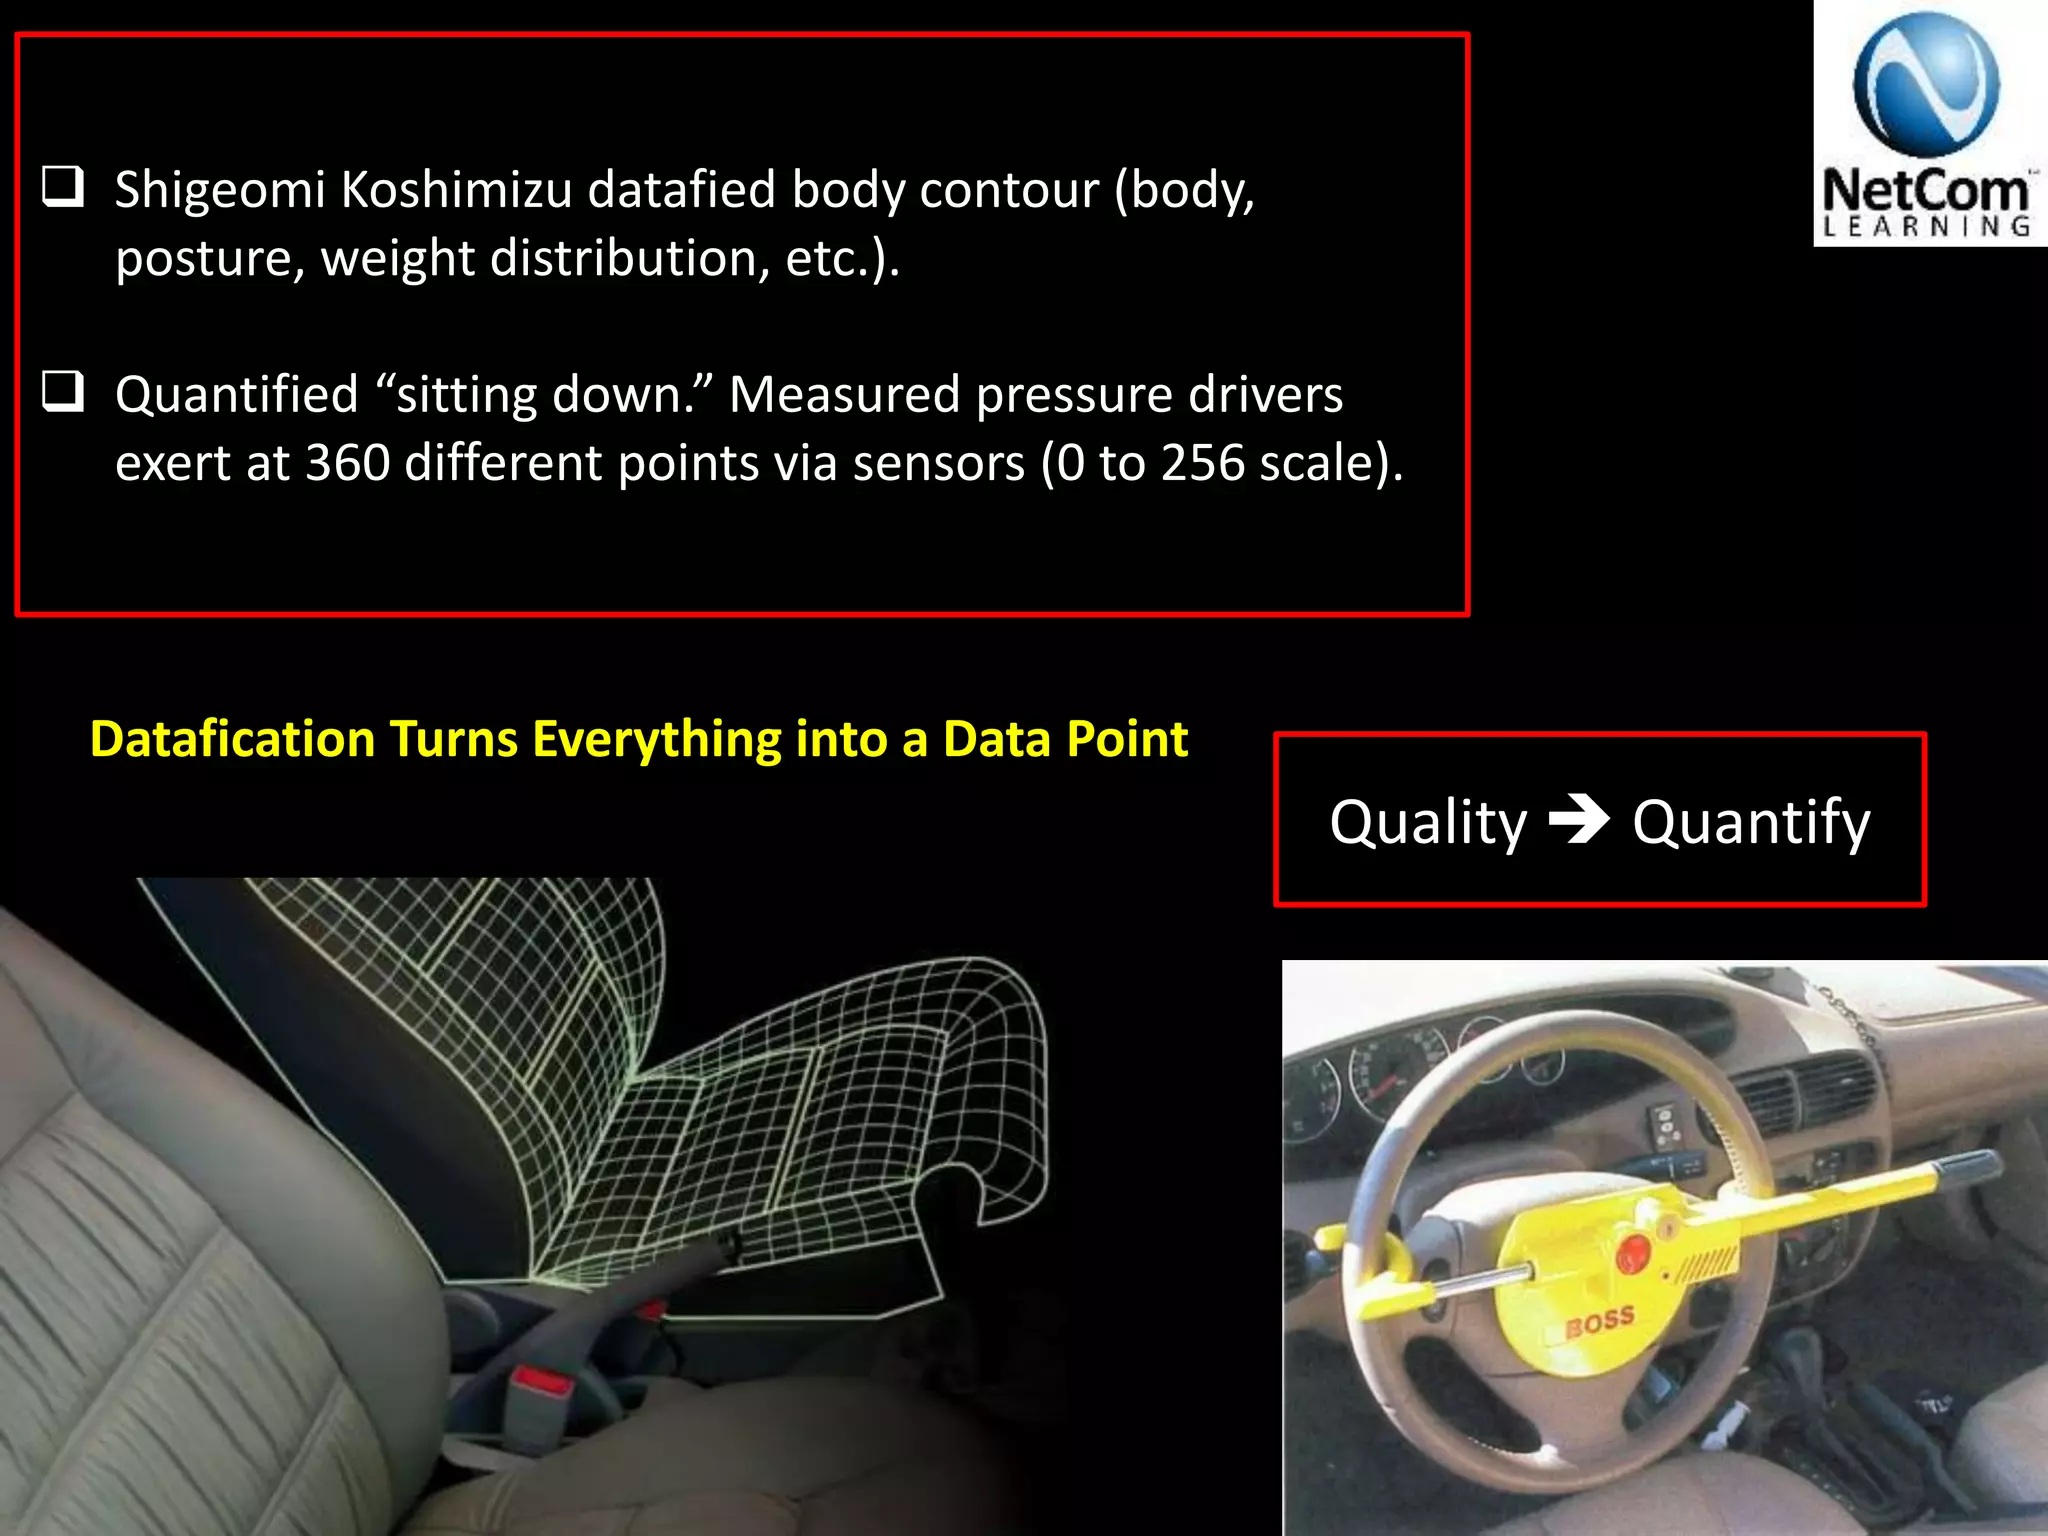
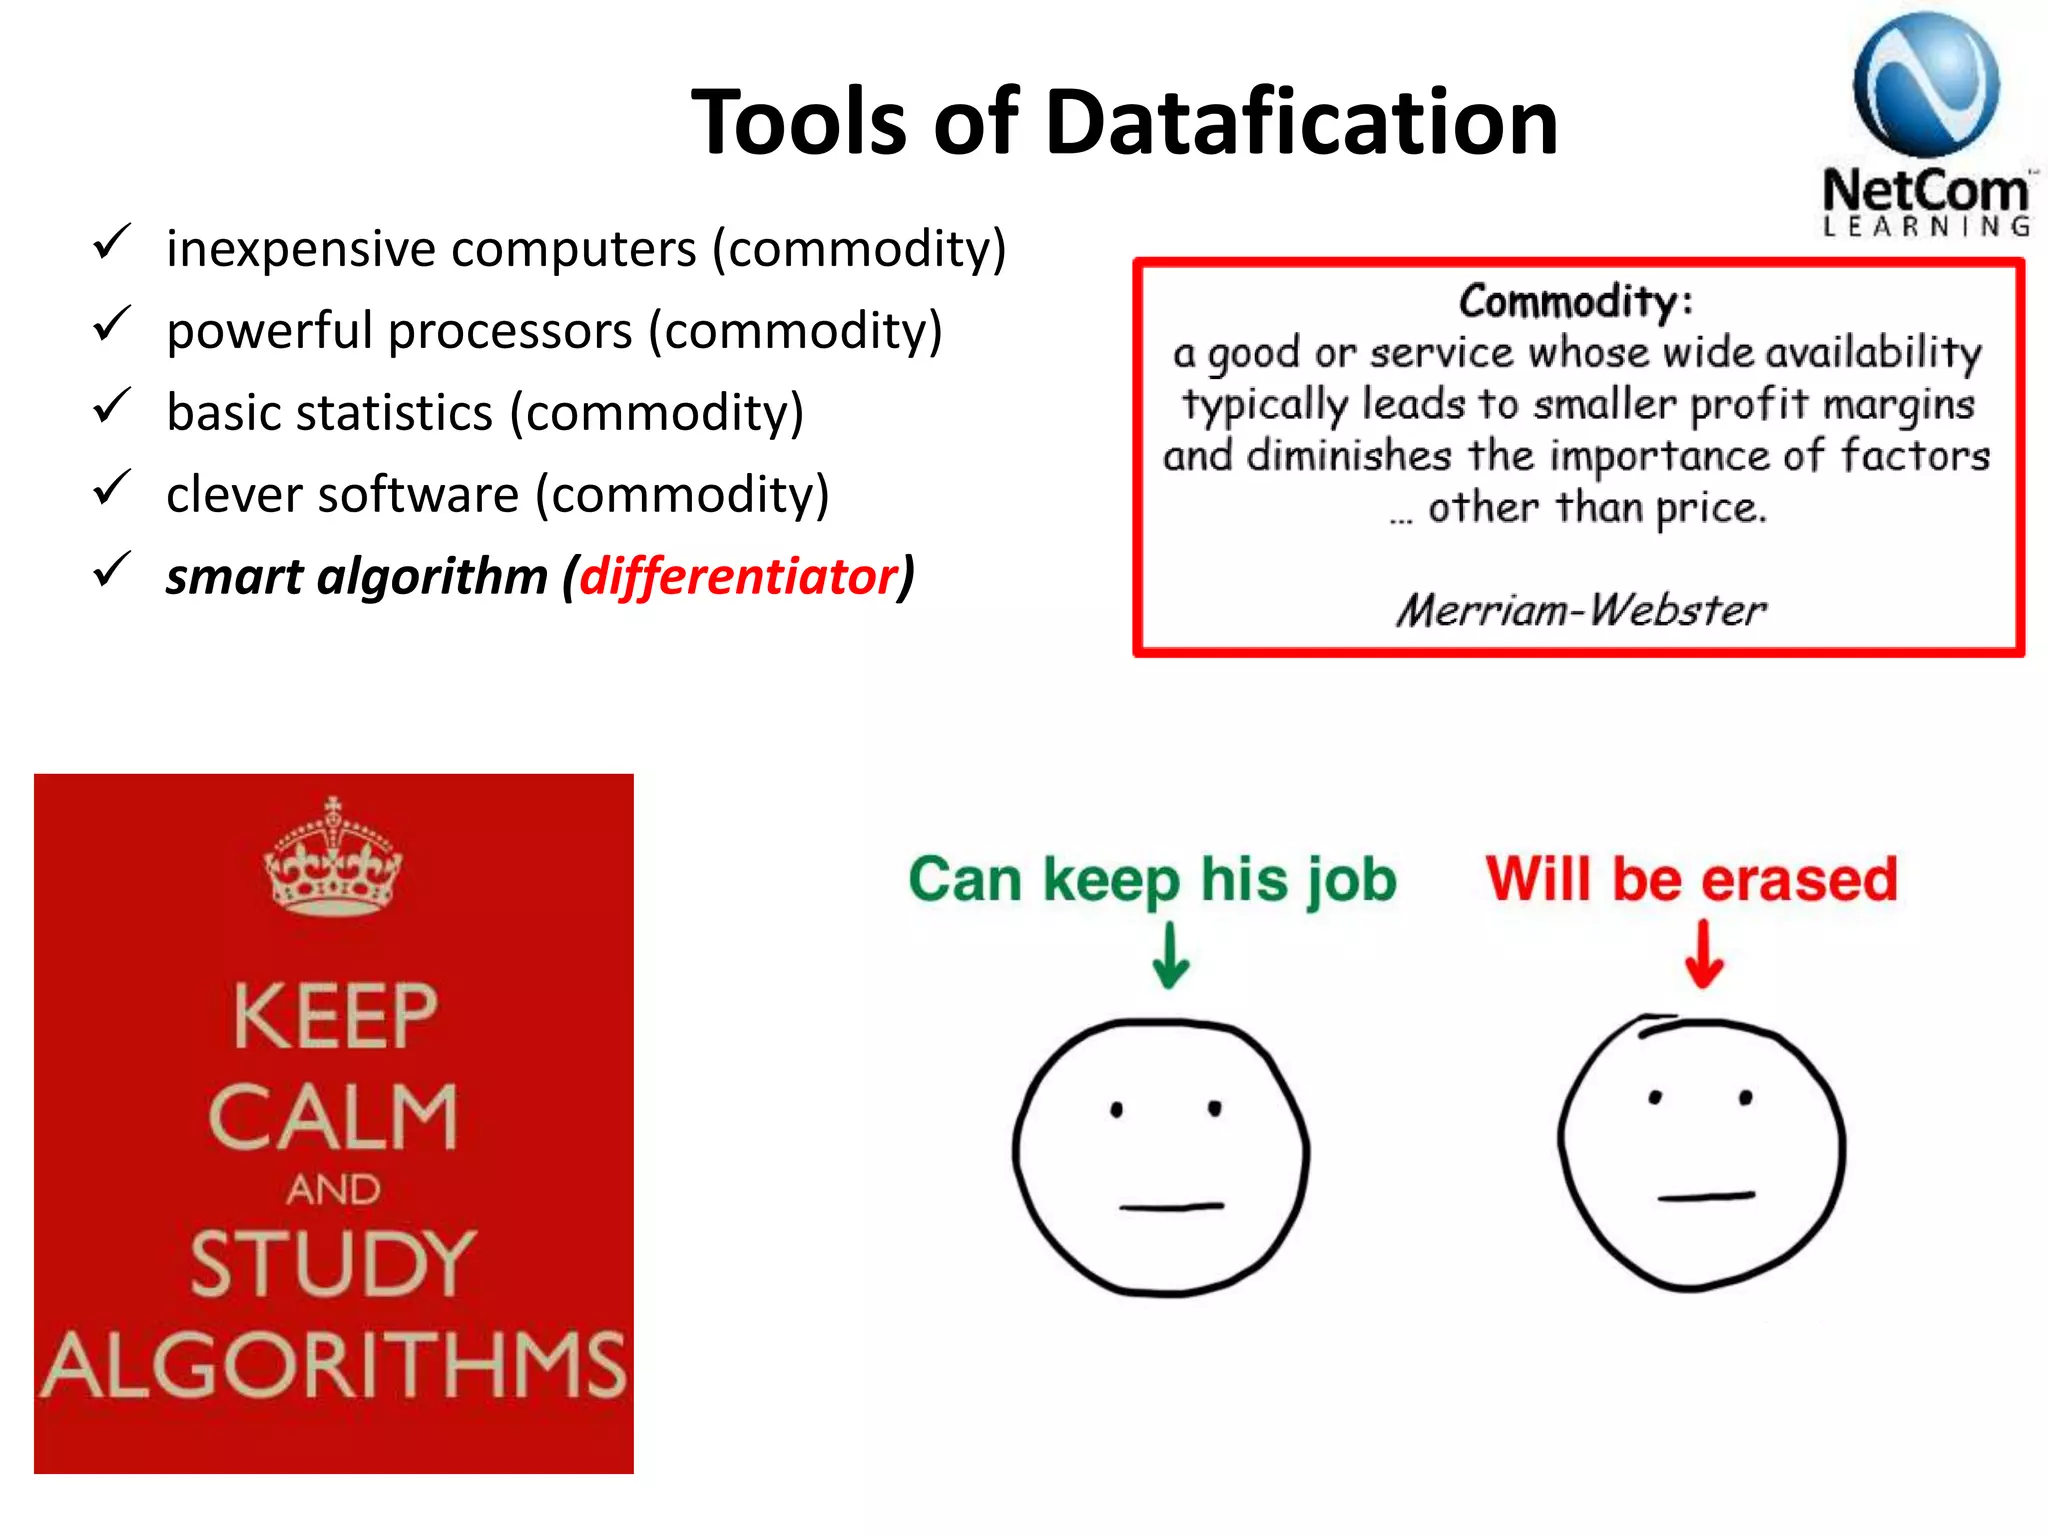
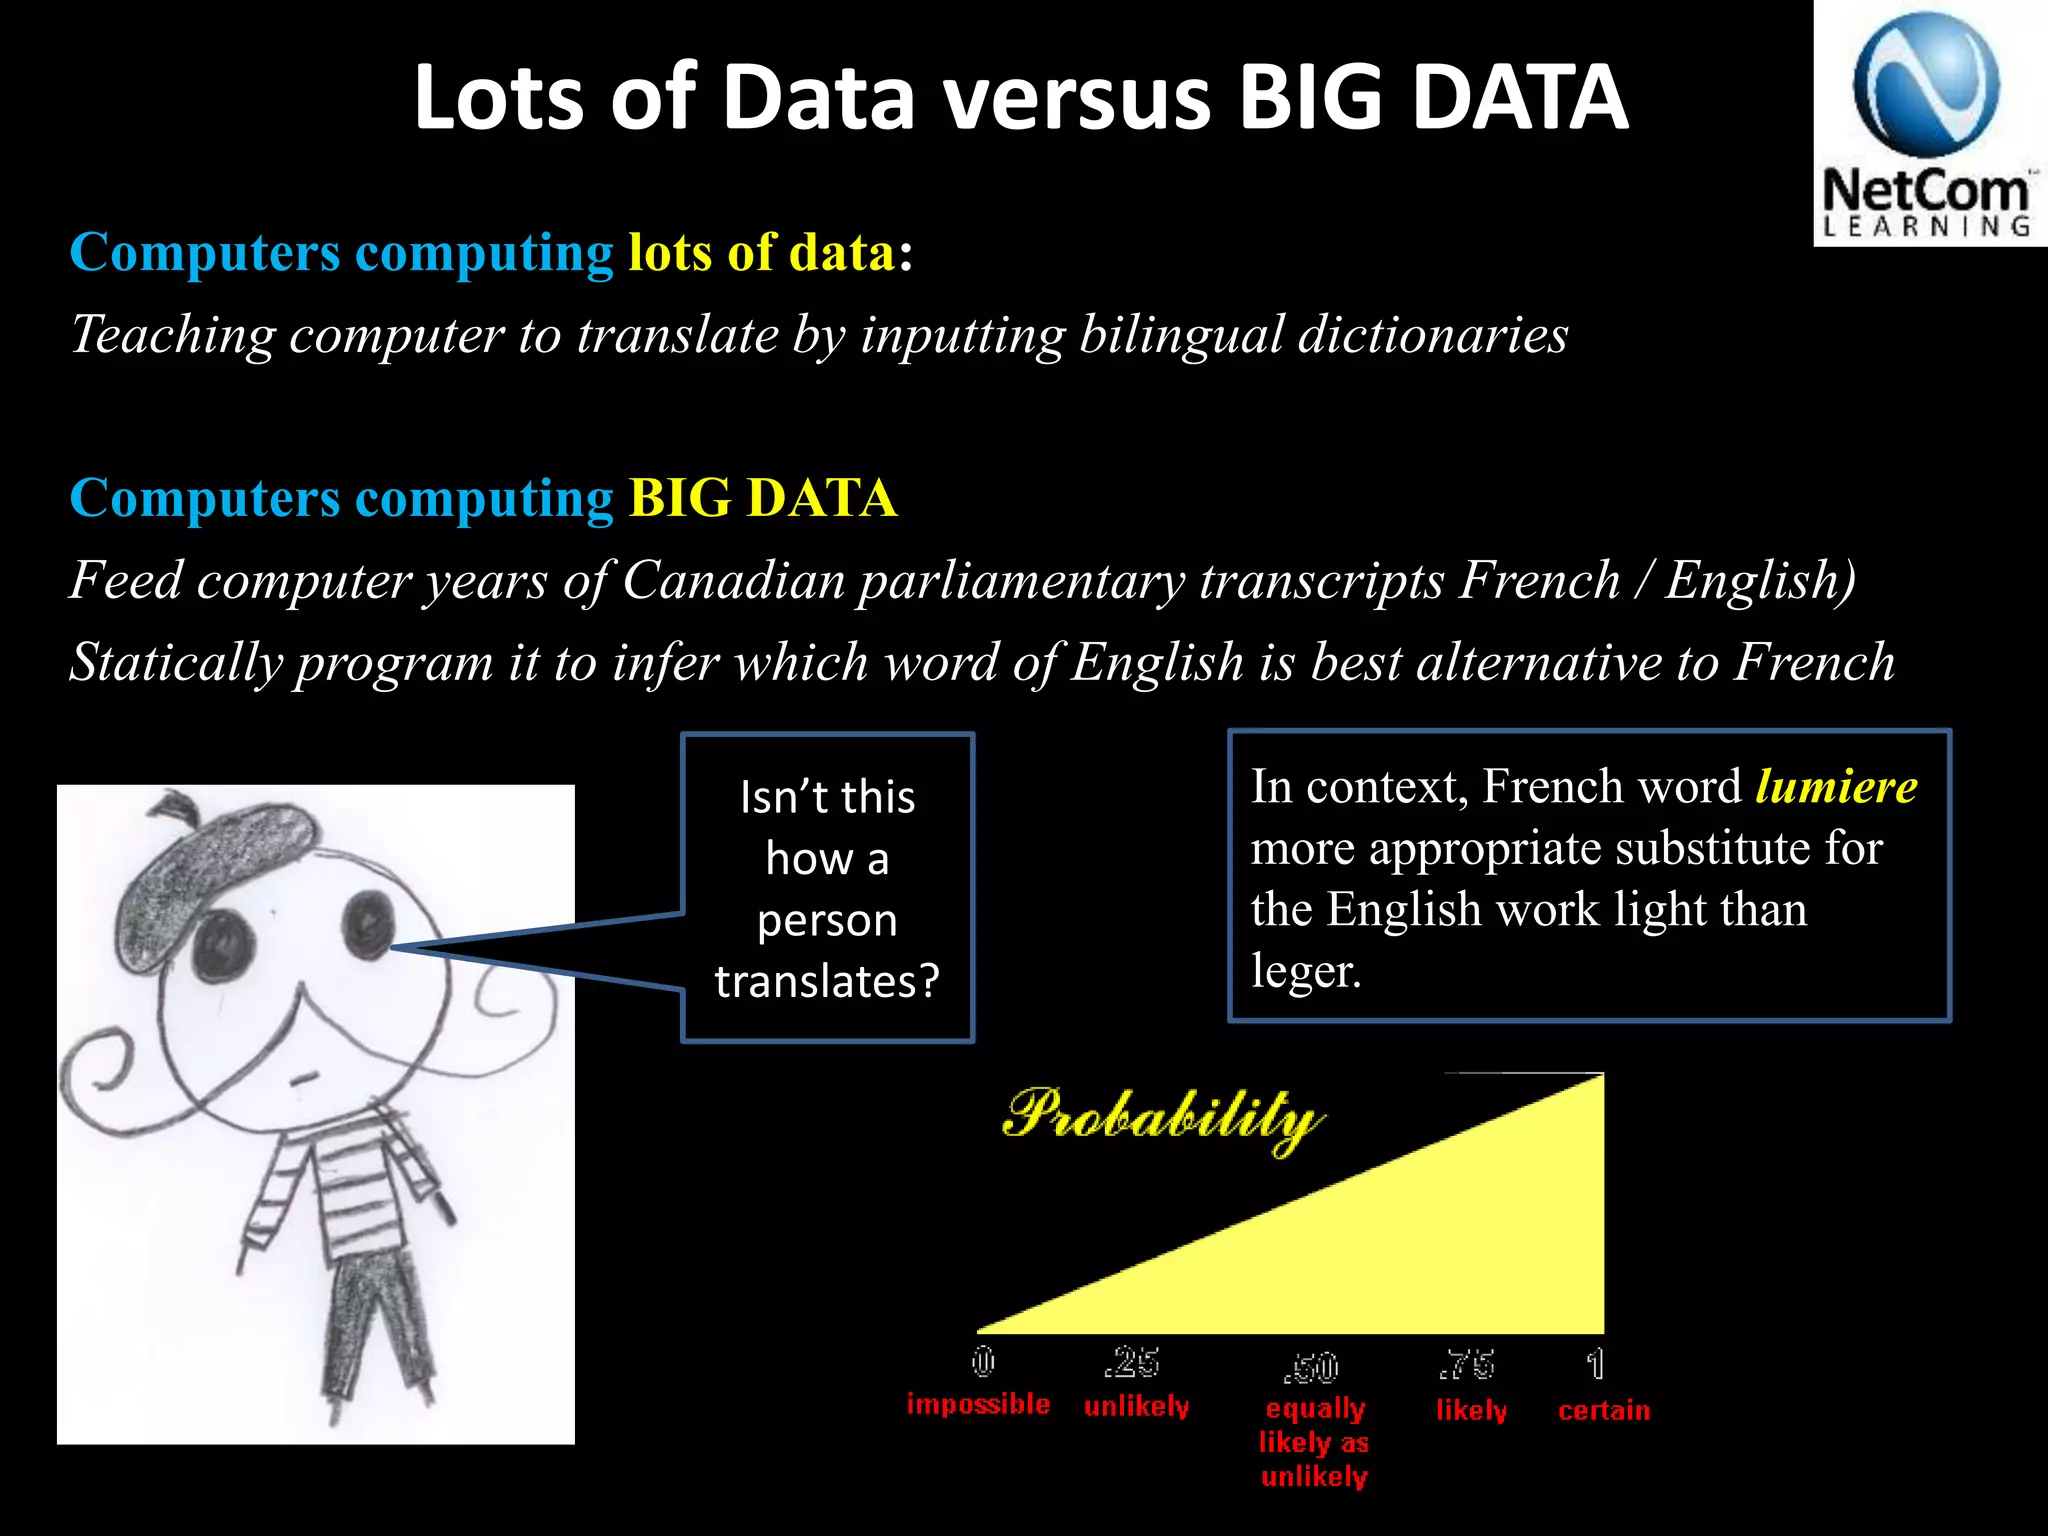
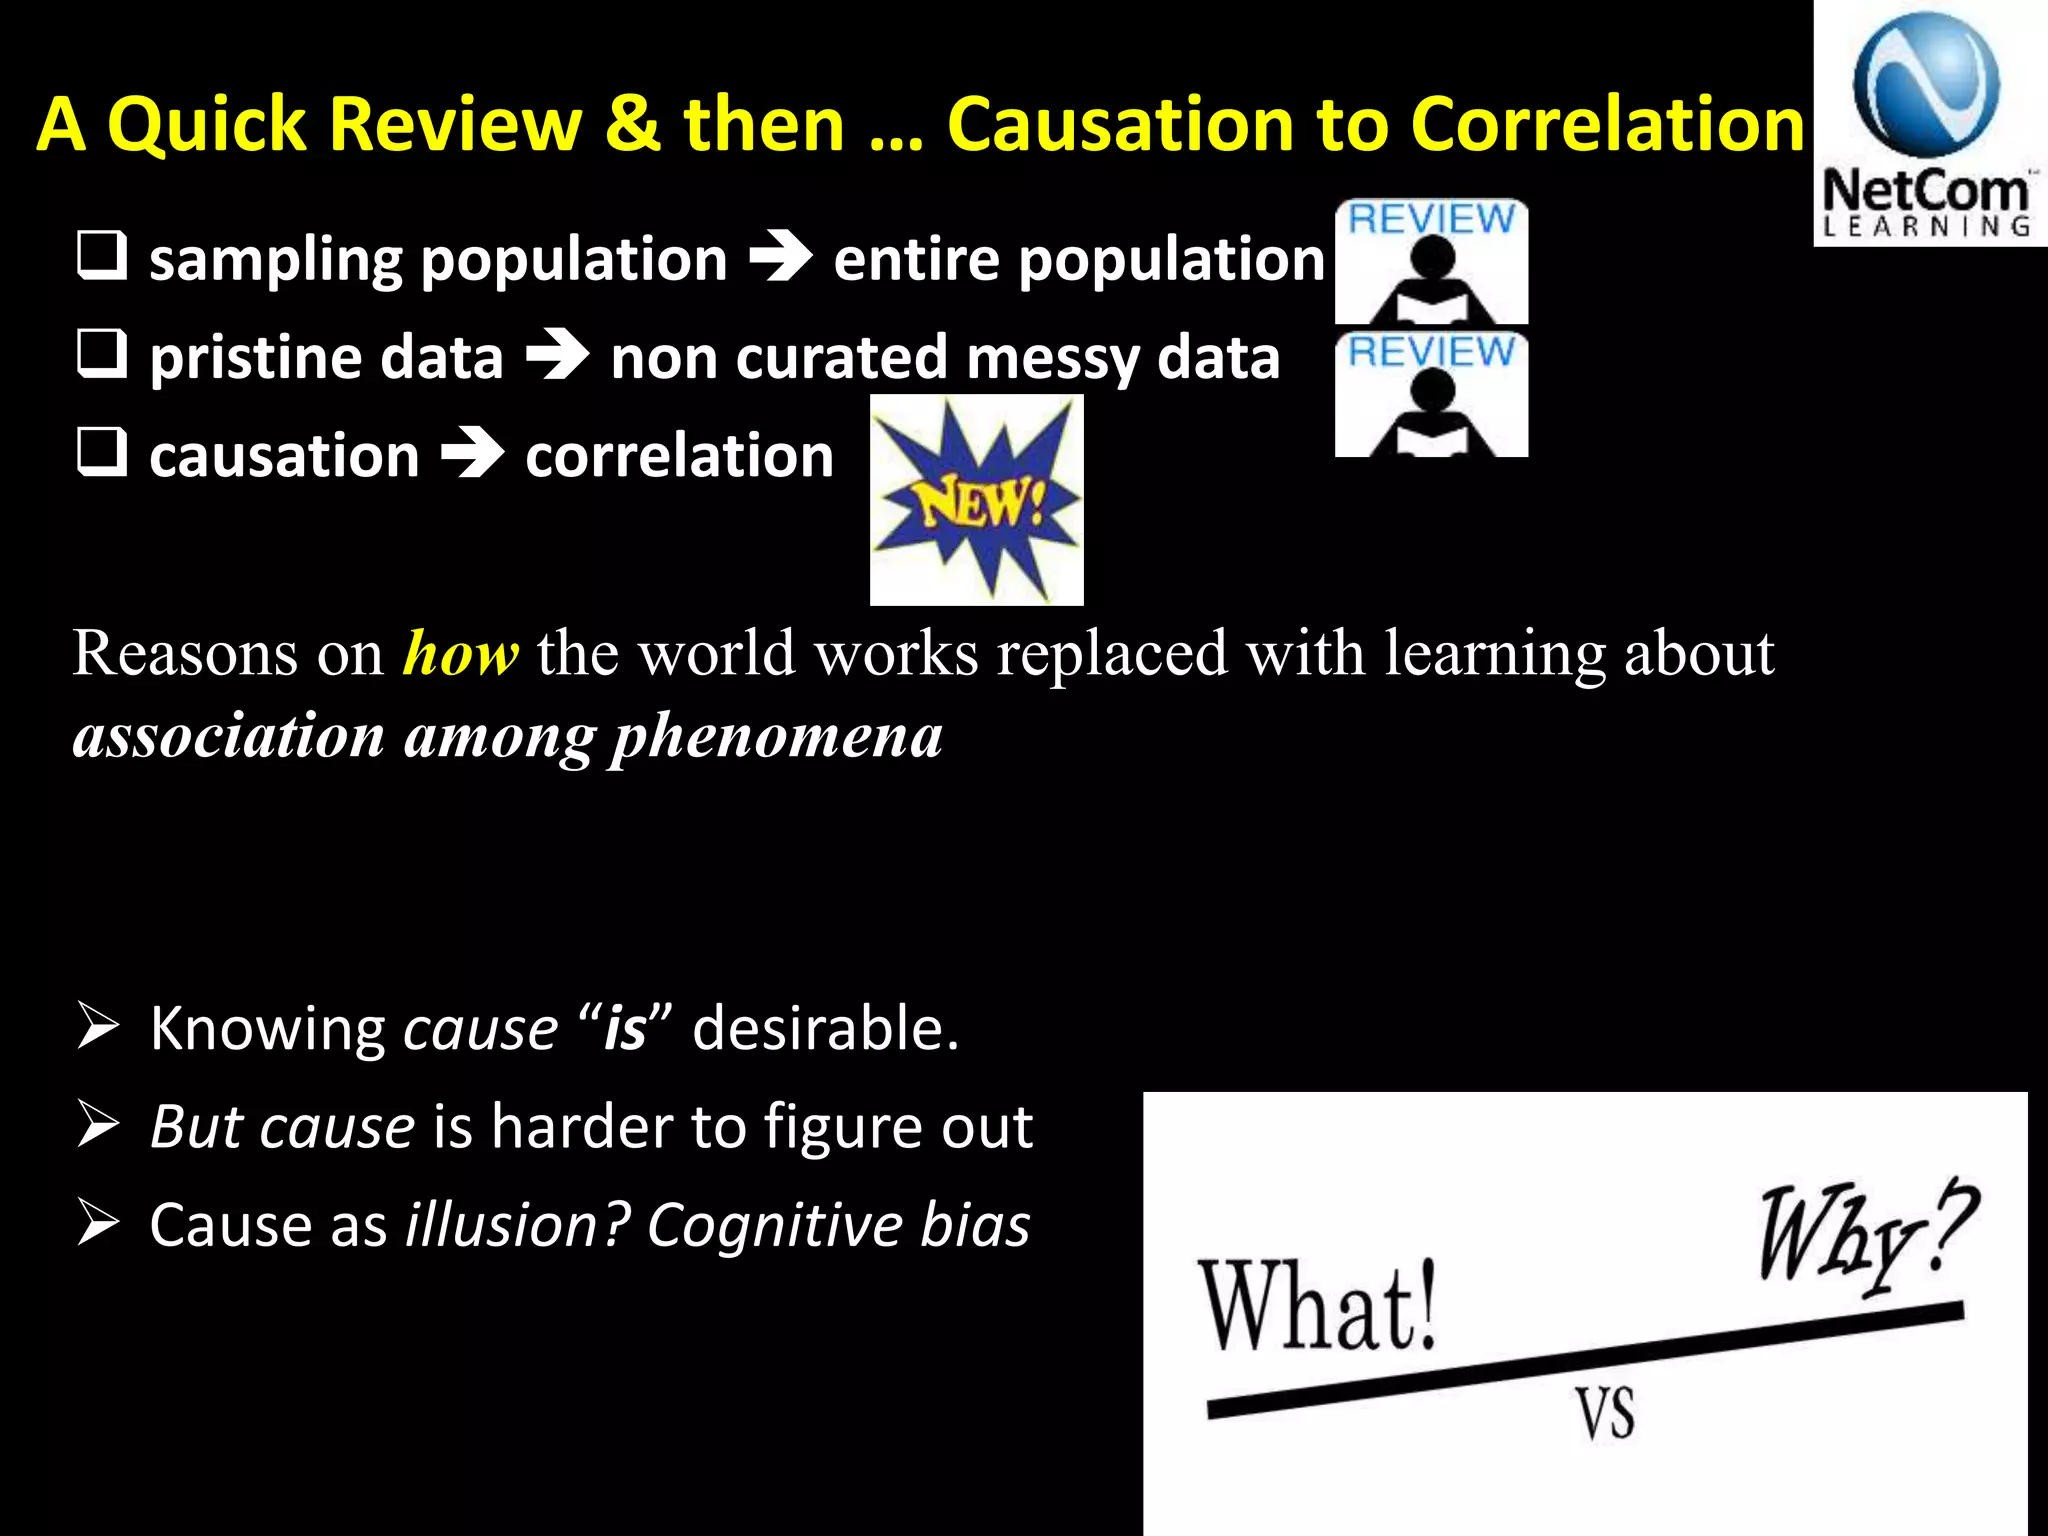

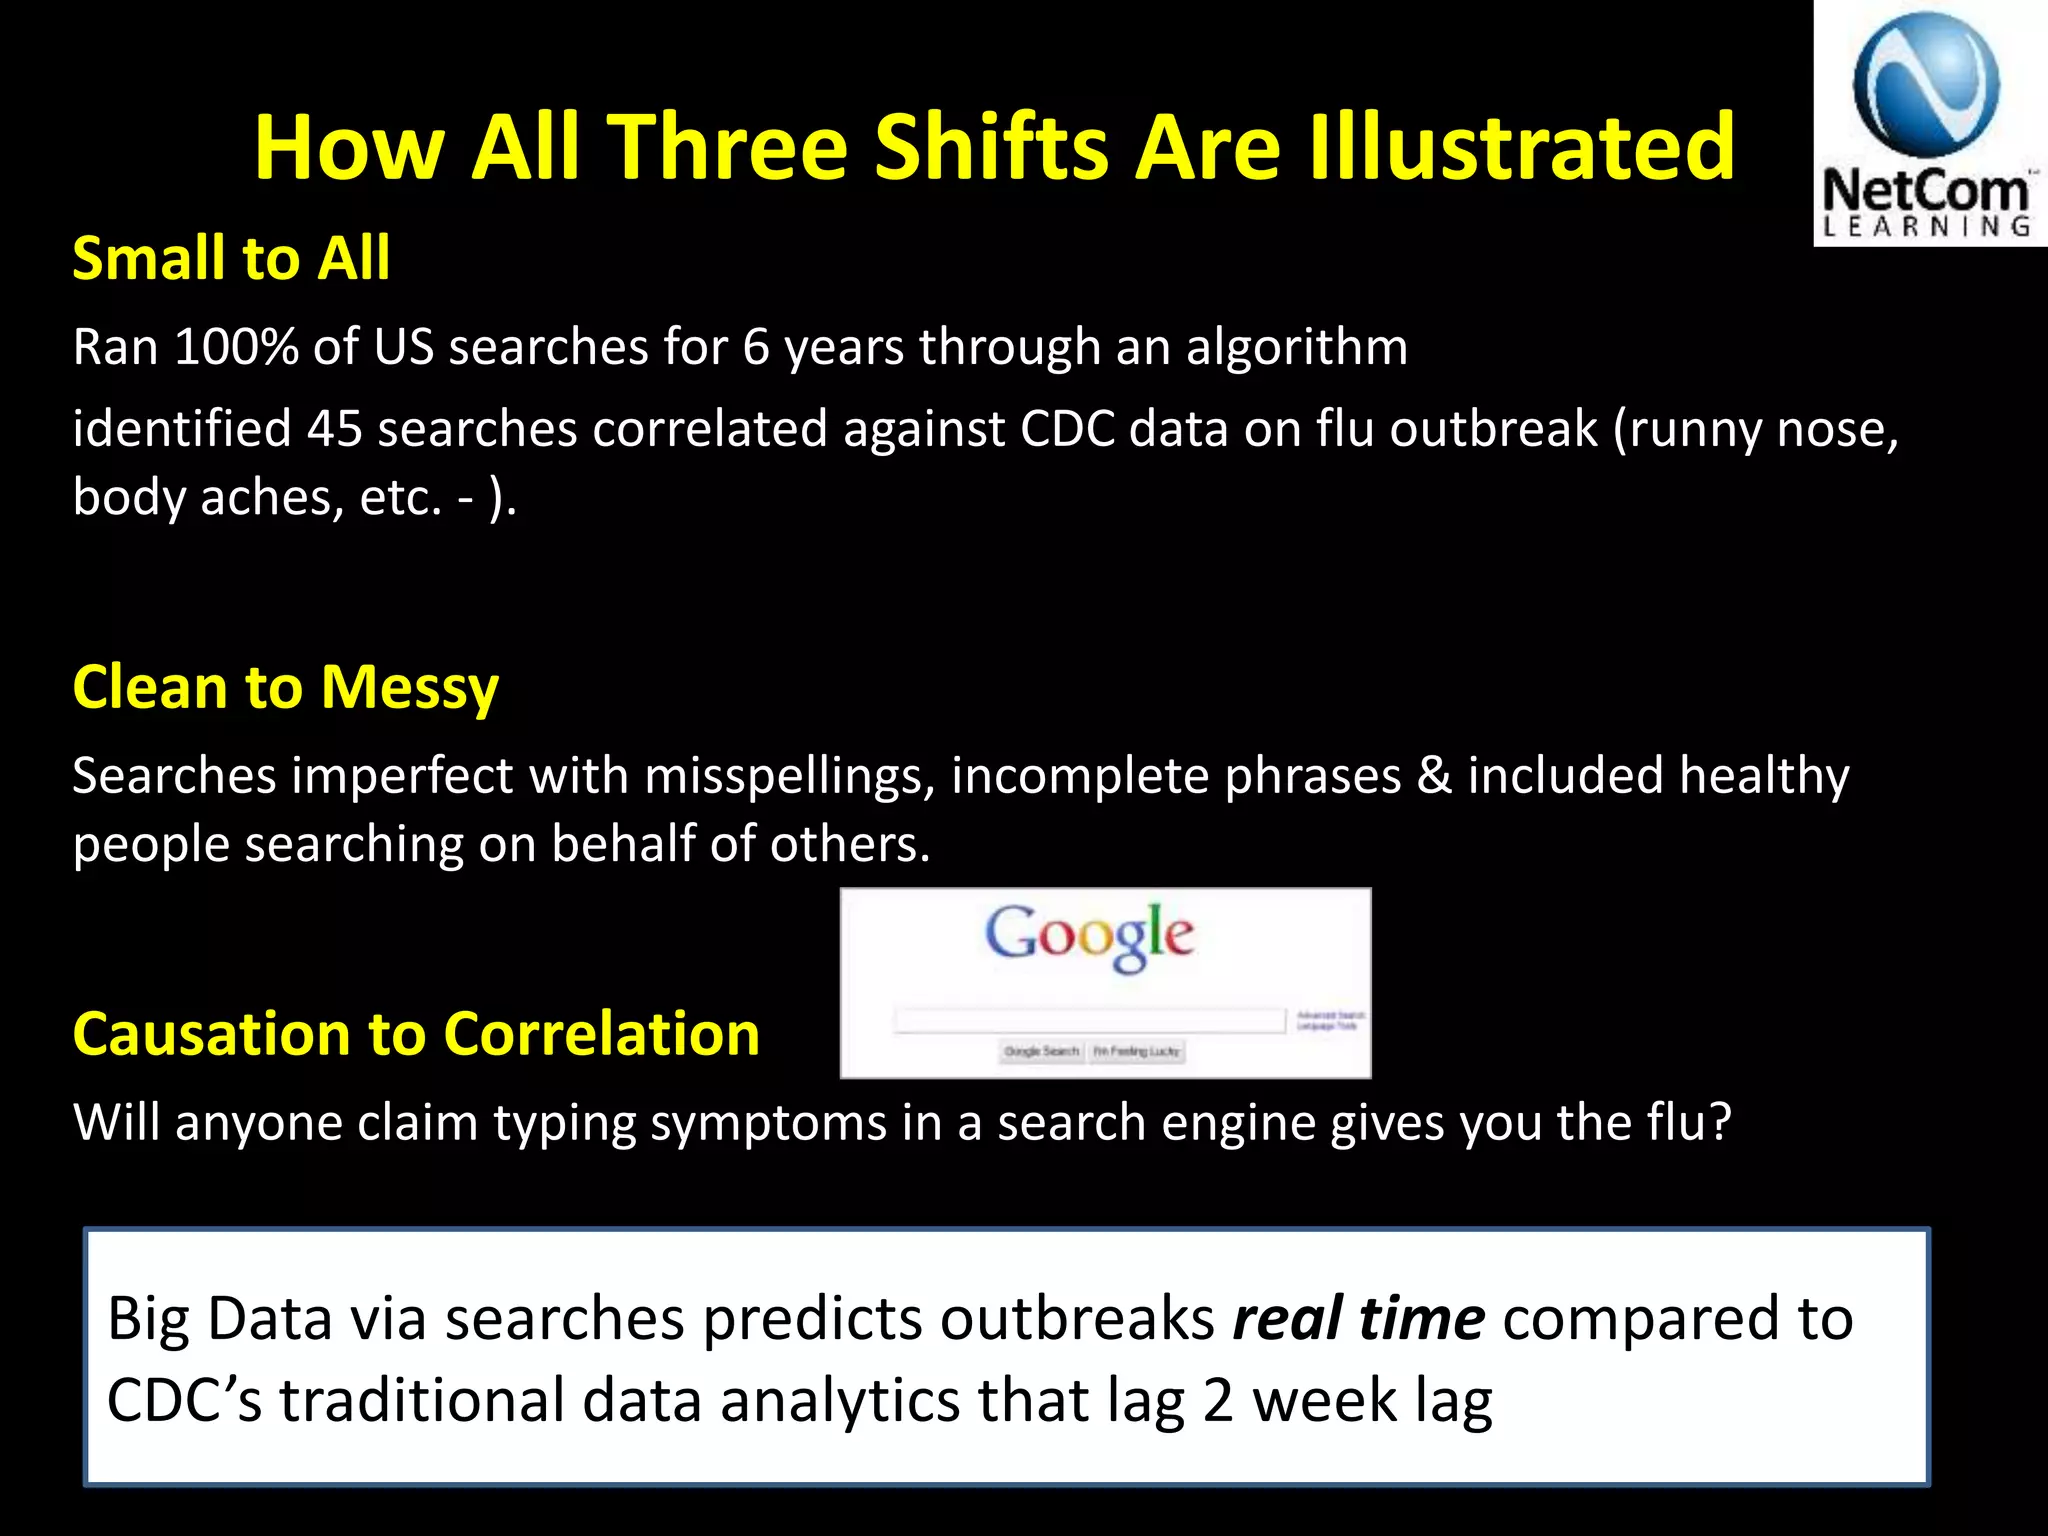
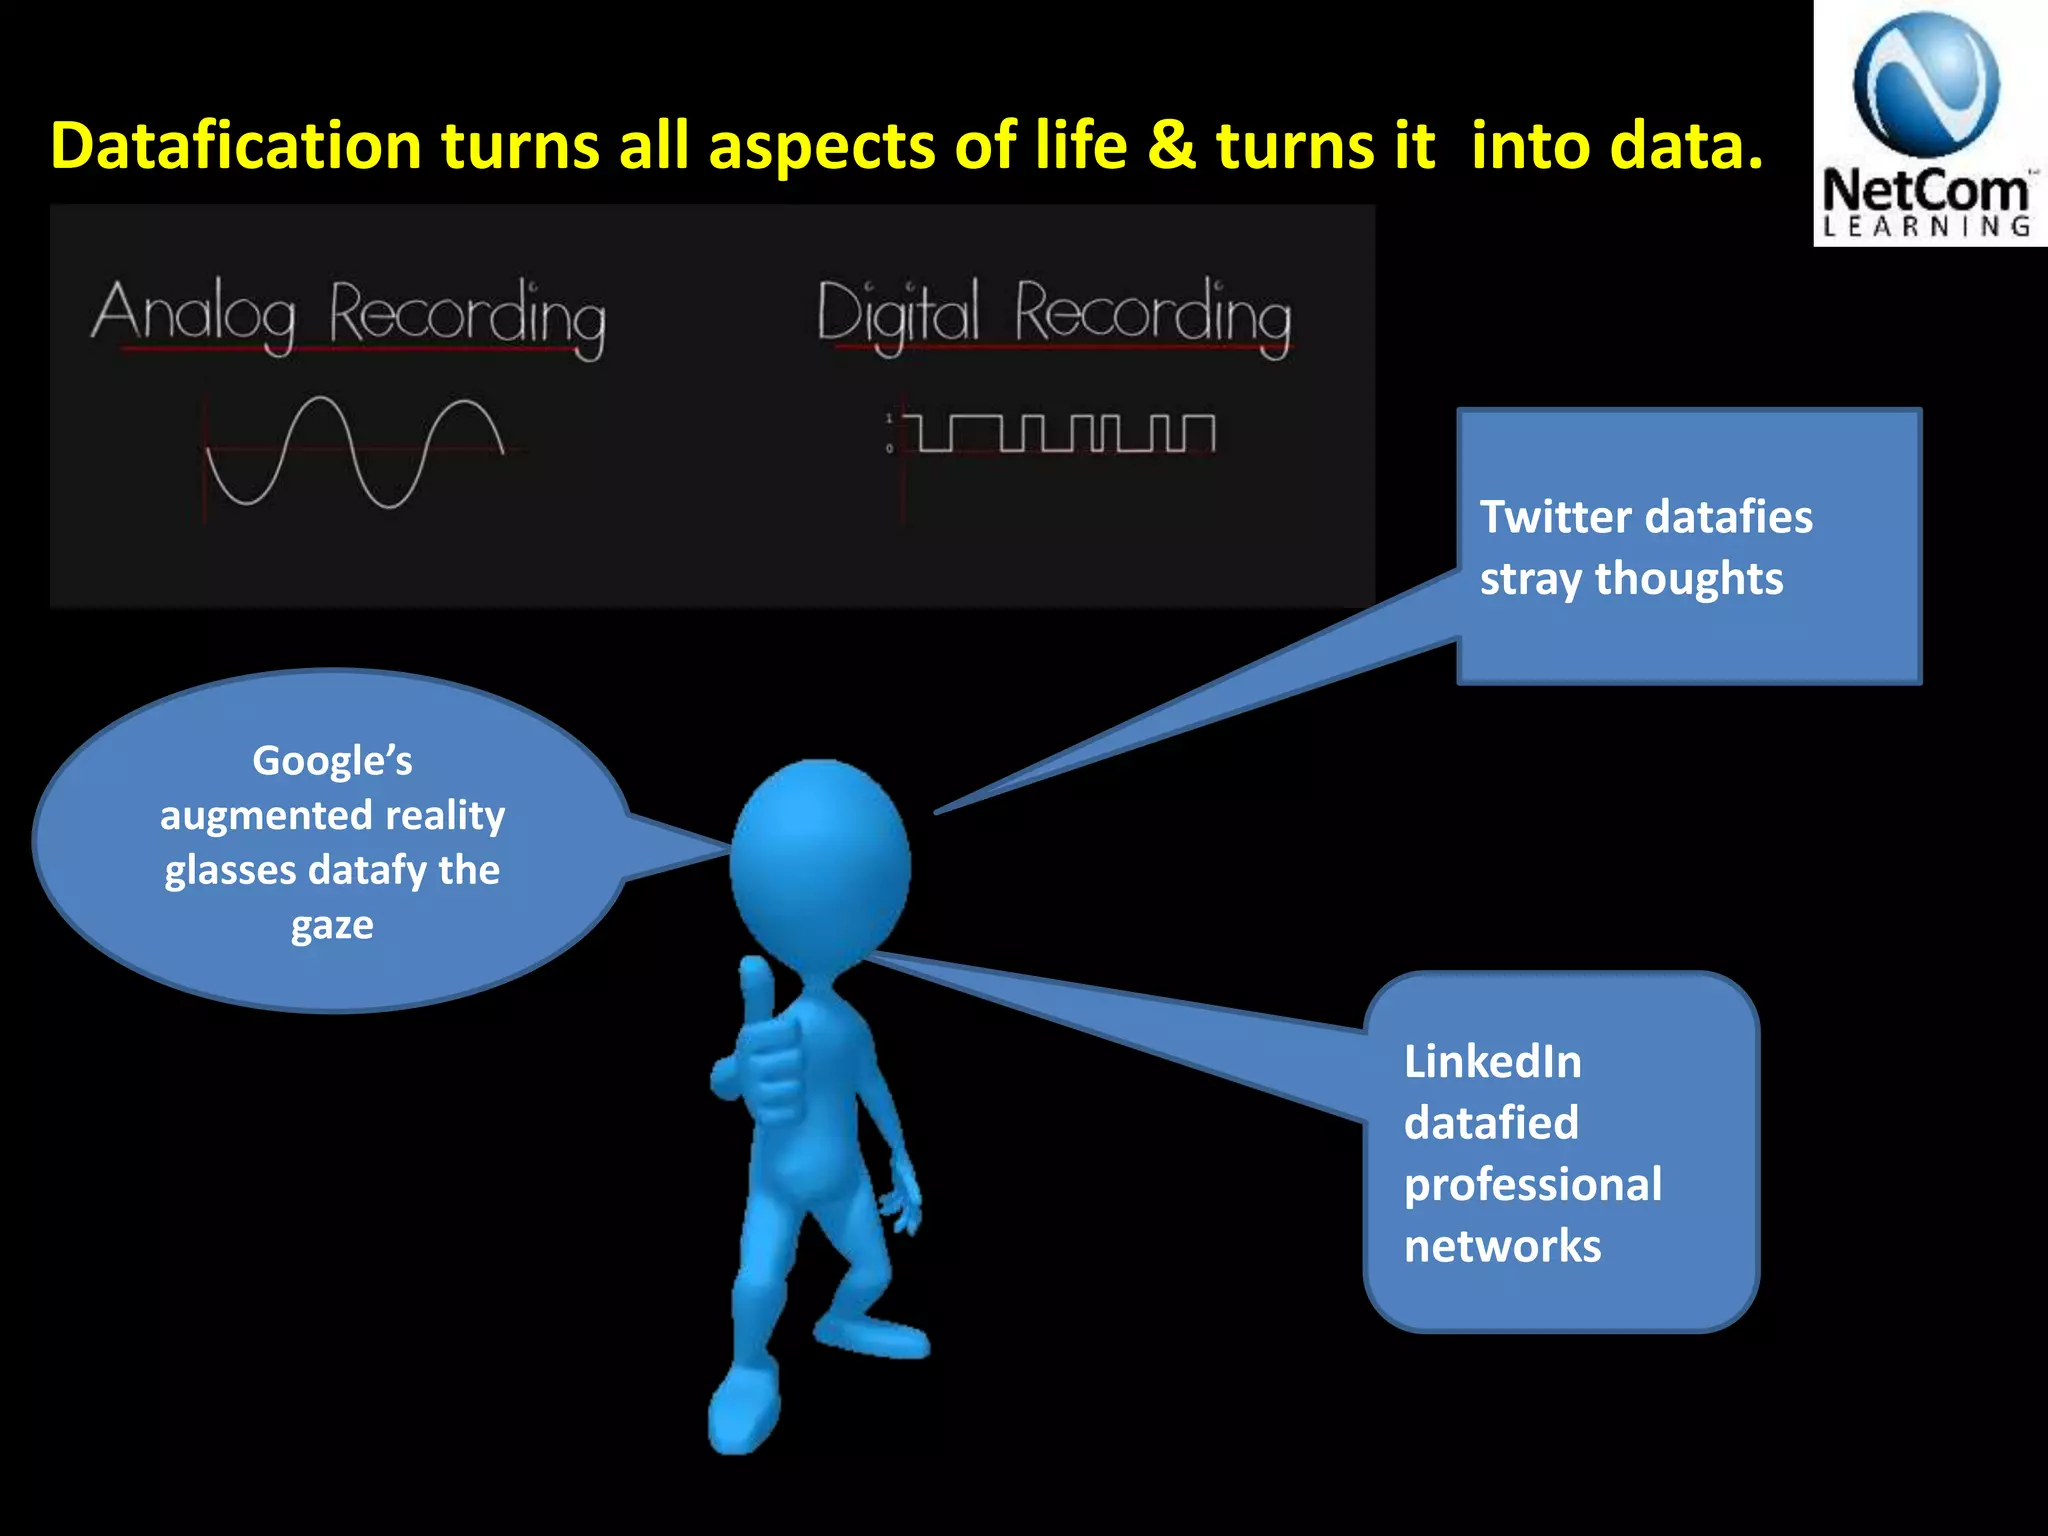


The document discusses the concept of big data, emphasizing its role in transforming business decision-making and career paths. It introduces 'datafication' as the process of converting aspects of life into data points that enhance value, and outlines the skills necessary to leverage big data in the workplace. Additionally, it highlights the importance of distinguishing between causation and correlation, offering practical steps for integrating big data into everyday business operations.


![Big Data [sorry] & Data Science: What Does a Data Scientist Do?](https://cdn.slidesharecdn.com/ss_thumbnails/dslatcloudmsevent20130125-130126065651-phpapp01-thumbnail.jpg?width=640&height=640&fit=bounds)


