This document discusses the automatic identification of scripts from printed Indian documents, focusing on dimension reduction techniques like Partial Least Squares (PLS), Sliced Inverse Regression (SIR), and Principal Component Analysis (PCA) for classification purposes. It presents a methodology that uses global approaches for feature extraction without complex segmentation, achieving robust classification accuracy across ten Indian scripts. The work addresses the need for efficient automatic processing of multilingual documents in India, enhancing the capabilities of Optical Character Recognition (OCR) systems.
![International Journal of Advanced Information Technology (IJAIT) Vol. 7, No.1/2/3, June 2017
DOI : 10.5121/ijait.2017.7301 1
DIMENSION REDUCTION FOR SCRIPT
CLASSIFICATION- PRINTED INDIAN DOCUMENTS
Hamsaveni L1
, Pradeep C2
and Chethan H K3
1
Department of Studies in Computer Science Manasagangotri, University of
Mysore, Mysore
2
Department of Computer Science and Engineering Rajarajeswari College of Engineering,
Bangalore
3
Department of Computer Science and Engineering Maharaja Institute of Technology,
Mysore
ABSTRACT
Automatic identification of a script in a given document image facilitates many important applications such
as automatic archiving of multilingual documents, searching online archives of document images and for
the selection of script specific OCR in a multilingual environment. This paper provides a comparison study
of three dimension reduction techniques, namely partial least squares (PLS), sliced inverse regression (SIR)
and principal component analysis (PCA), and evaluates the relative performance of classification
procedures incorporating those methods. For given script we extracted different features like Gray Level
Co-occurrence Method (GLCM) and Scale invariant feature transform (SIFT) features. The features are
extracted globally from a given text block which does not require any complex and reliable segmentation of
the document image into lines and characters. Extracted features are reduced using various dimension
reduction techniques. The reduced features are fed into Nearest Neighbor classifier. Thus the proposed
scheme is efficient and can be used for many practical applications which require processing large volumes
of data. The scheme has been tested on 10 Indian scripts and found to be robust in the process of scanning
and relatively insensitive to change in font size. This proposed system achieves good classification accuracy
on a large testing data set.
KEYWORDS
SIFT, GLCM, PLS, SIR, PCA, Nearest Neighbour
1. INTRODUCTION
Document image analysis has been an active research area from a few decades, and that facilitates
the establishment of paperless offices across the world. The process of converting textual symbols
present on printed and/ or handwritten paper to a machine understandable format is known as
optical character recognition (OCR) which is the core of the field of document image analysis.
The OCR technology for Indian documents is in emerging stage and most of these Indian OCR
systems can read the documents written in only a single script. As per the trilingual formula of
Indian constitution [1], every state Government has to produce an official document containing a
national language (Hindi), official language (English) and state language (or regional language).
According to the three-language policy adopted by most of the Indian states, the documents
produced in an Indian state Karnataka, are composed of texts in the regional language-Kannada,
the National language-Hindi and the world wide commonly used language-English. In addition,
majority of the documents found in most of the private and Government sectors of Indian states,
are tri-lingual type (a document having text in three languages). So, there is a growing demand to
automatically process these tri-lingual documents in every state in India, including Karnataka.](https://image.slidesharecdn.com/7317ijait01-170712045240/75/Dimension-Reduction-for-Script-Classification-Printed-Indian-Documents-1-2048.jpg)
![2
The monolingual OCR systems will not process such multi-script documents without human
involvement for delineating different script zones of multi-lingual pages before activating the
script specific OCR engine. The need for such manual involvement can result in greater expense
and crucially delays the overall image-to-text conversion. Thus, an automatic forwarding is
required for the incoming document images to handover this to the particular OCR engine
depending on the knowledge of the intrinsic scripts. In view of this, identification of script and/ or
language is one of the elementary tasks for multi-script document processing. A script recognizer,
therefore, simplifies the task of OCR by enhancing the accuracy of recognition and reducing the
computational complexity.
2. PREVIOUS WORK
Existing works on automatic script identification are classified into either local approach or global
approach. Local approaches extract the features from a list of connected components like line,
word and character in the document images and hence they are well suited to the documents
where the script type differs at line or word level. In contrast, global approaches employ analysis
of regions comprising of at least two lines and hence do not require fine segmentation. Global
approaches are applicable to those documents where the whole document or paragraph or a set of
text lines is in one script only. The script identification task is simplified and performed faster
with the global rather than the local approach. A sample work has been reported in literature on
both Indian and non-Indian scripts using local and global approaches.
2.1 Local approaches on Indian scripts
Pal and Choudhuri [2] have proposed an automatic technique of separating the text lines from 12
Indian scripts (English, Hindi, Bangla, Gujarati, Tamil, Kashmiri, Malayalam, Oriya, Punjabi,
Telugu and Urdu) using ten triplets formed by grouping English and Devanagari with any one of
the other scripts. This method works only when the triplet type of the document is known. Script
identification technique explored by Pal [3] uses a binary tree classifier for 12 Indian scripts using
a large set of features. B Patil and Subbareddy [4] have proposed a neural network based system
for script identification of Kannada, Hindi and English languages. Dhandra et al., [5] have
exploited the use of discriminating features (aspect ratio, strokes, eccentricity, etc,) as a tool for
determining the script at word level in a bi-lingual document containing Kannada, Tamil and
Devnagari containing English numerals. A method to automatically separate text lines of Roman,
Devanagari and Telugu scripts has been proposed by Pal et al., [6]. In Lijun et al, [7] have
developed a method for Bangla and English script identification based on the analysis of
connected component profiles. Vipin [8] have presented an approach to automatically identify
Kannada, Hindi and English languages using a set of features viz., cavity analysis, end point
analysis, corner point analysis, line based analysis and Kannada base character analysis. Word-
wise script identification systems for Indian scripts has been discussed in [24].
2.2 Global approaches on Indian scripts
Adequate amount of work has been reported in literature using global approaches. S Chaudhury et
al., [9] has proposed a method for identification of Indian languages by combining Gabor filter
based technique and direction distance histogram classifier considering Hindi, English,
Malayalam, Bengali, Telugu and Urdu. G D Joshi et al., [10] have presented a script identification
technique for 10 Indian scripts using a set of features extracted from logGabor filters. Dhanya et
al., [11] have used Linear Support Vector Machine (LSVM), K-Nearest Neighbour (K-NN) and
Neural Network (NN) classifiers on Gabor-based and zoning features to classify Tamil and](https://image.slidesharecdn.com/7317ijait01-170712045240/75/Dimension-Reduction-for-Script-Classification-Printed-Indian-Documents-2-2048.jpg)
![3
English scripts. Hiremath [12] have proposed a novel approach for script identification of South
Indian scripts using wavelet based co-occurrence histogram features. Ramachandra and Biswas
[13] have proposed a method based on rotation invariant texture features using multi channel
Gabor filter for identifying seven Indian languages namely Bengali, Kannada, Malayalam, Oriya,
Telugu and Marathi. S R Kunte and S Samuel [14] have suggested a neural approach in on-line
script recognition for Telugu language employing wavelet features. Nagabhushan et al., [15] have
presented an intelligent pin code script identification methodology based on texture analysis using
modified invariant moments. Peeta et al., [16] have presented a technique using Gabor filters for
script identification of Indian bilingual documents.
2.3 Local and global approaches on non-Indian scripts
Sufficient amount of work has also been carried out on non-Indian languages. Spitz [17] has
proposed a system, which relies on specific, well defined pixel structures for script identification.
Such features include locations and numbers of upward concavities in the script image, optical
density of connected components, the frequency and combination of relative character heights.
This approach has been shown to be successful in distinguishing between Asian languages
(Japanese, Chinese, and Korean) against European languages (English, French, German, and
Russian). Wood et al., [18] have proposed projection profile method to determine Roman,
Russian, Arabic, Korean and Chinese characters. Hochberg et al., [19] have presented a method
for automatically identifying script from a binary document image using cluster-based text
symbol templates. In Ding et al., [20], a method that uses a combined analysis of several
discriminating statistical features to classify Oriental and European scripts is presented. Tan et al.,
[21] has proposed a rotation invariant texture feature extraction method for automatic script and
language identification from document images using multiple channel (Gabor) filters and Gray
level co-occurrence matrices for seven languages: Chinese, English, Greek, Koreans, Malayalam,
Persian and Russian. A Busch et al., [22] has presented the use of texture features (gray level co-
occurrence matrix and Gabor energy features) for determining the script of a document image.
B.Kumar et al. [23] have used topological, structural features with rule based classifier for line
based multi-script identification.
It can be seen from the references cited above that sample amount of work has been done in the
area of document script/language identification. Even though some considerable amount of work
has been carried out on Indian script identification, hardly few attempts focus on the all the
languages. So, an intensive work needs to be done in this field as the demand is increasing. Also
the existing methods have to be improved to reach a stage of satisfactory practical application. It
is in this direction the research work proposes a model that automatically identifies the all the
languages in given document. We propose a based classification scheme which uses a global
approach and demonstrate its ability to classify 10 Indian language scripts. In section (3), we
describe the preprocessing scheme. The feature extraction is presented in section 4. The various
dimension reduction techniques is discussed in section 5. Results of the scheme tested over a
large data set are presented in section 6.
3. PREPROCESSING
Our scheme first segments the text area from the document image by removing the upper, lower,
left and right blank regions. After this stage, we have an image which has textual and non-textual
regions. This is then binarised after removing the graphics and pictures (at present the removal of
non-textual information is performed manually, though page segmentation algorithms such as
[12] could be readily been employed to perform this automatically). Text blocks of predefined
size (100×200 pixels) are next extracted. It should be noted that the text block may contain lines](https://image.slidesharecdn.com/7317ijait01-170712045240/75/Dimension-Reduction-for-Script-Classification-Printed-Indian-Documents-3-2048.jpg)
![4
with different font sizes and variable spaces between lines words and characters. Numerals may
appear in the text.
4. FEATURE EXTRACTION
Feature extraction is a necessary step for any classification task. For image object classification
purpose, the use of texture and shape features has proved to be quite effective for many
applications. There are many ways for calculating texture feature descriptors. GLCM is one of
them. Many descriptors can be obtained from the co-occurrence matrix calculated. The SIFT
based descriptors describes a given object with respect to a set of interesting points which are
invariant to scale, translation, partial occlusion and clutter. These feature descriptors have been
used successfully for object recognition, robotic mapping etc.
In our work, for each script, we computed 4 texture features, contrast, homogeneity, correlation
and energy. For each object, the SIFT algorithm generates a feature vector of 128 elements. So
each image object is now represented by a feature vector of 132 elements.
4.1 GLCM Based Texture Feature Descriptors
Texture features based on spatial co-occurrence of pixel values are probably the most widely used
texture feature descriptors having been used in several application domains like analysis of
remotely sensed images, image segmentation etc. Cooccurrence texture features are extracted
from an image into two steps. First, pair wise spatial co-occurrence of pixels separated by a given
angular value are computed and stored in a grey level co-occurrence matrix. Second, the GLCM
is used to compute a set of scalar quantities that characterizes the different aspects of the
underlying texture. We have worked with four GLCM based descriptors, namely, Contrast,
Correlation, Homogeneity and Energy [26].
4.2 SIFT Feature Descriptors
In computer vision, SIFT is used to detect and describe local features in an image. SIFT features
are used for reliable matching between different views of the same object. The extracted features
are invariant to scale, orientation and are partially invariant to illumination changes. The SIFT
feature extraction is a four step process. In the first step, locations of the potential interest points
are computed in the image by finding the extremas in a set of Difference of Gaussian (DOG)
filters applied to the actual image at different scale-space. Then those interest points which are
located at the areas of low brightness and along the edges are discarded. After that an orientation
is assigned to the remaining points based on local image gradients. Finally local image features
based on image gradient is calculated at the neighboring regions of each of the key points. Every
feature is defined in the 4 x 4 neighborhoods of the key points and is a vector of 128 elements
[27].
5. DIMENSION REDUCTION
The extracted features are reduced using various dimension reduction techniques. One way to
achieve dimension reduction is to transform the large number of original variables (genes) to a
new set of variables (gene components), which are uncorrelated and ordered so that the first few
account for most of the variation in the data. The K new variables (gene components) can then
replace the initial p variables (genes), thereby reducing the data from the high p-dimension to a
lower K-dimension. PCA, PLS and SIR are three of such methods for dimension reduction. To](https://image.slidesharecdn.com/7317ijait01-170712045240/75/Dimension-Reduction-for-Script-Classification-Printed-Indian-Documents-4-2048.jpg)
![5
describe them, let X be the n × p matrix of n samples and p features, y be the n × 1 vector of
response values, and SX be the p × p covariance matrix.
5.1 Principal Component Analysis
PCA is a well-known method of dimension reduction (Jolliffe, [30]). The basic idea of PCA is to
reduce the dimensionality of a data set, while retaining as much as possible the variation present
in the original predictor variables. This is achieved by transforming the p original variables X =
[x1, x2, …, xp] to a new set of K predictor variables, T = [t1, t2, …, tK], which are linear
combinations of the original variables. In mathematical terms, PCA sequentially maximizes the
variance of a linear combination of the original predictor variables,
)(maxarg 1' uuuk XVaru == (1)
subject to the constraint ui 'SX uj = 0, for all 1 ≤ i < j. The orthogonal constraint ensures that the
linear combinations are uncorrelated, i.e.Cov(Xui ,Xuj ) = 0, i ≠ j. These linear combinations
ij Xut =
(2)
are known as the principal components (PCs) (Massey, [31]). Geometrically, these linear
combinations represent the selection of a new coordinate system obtained by rotating the original
system. The new axes represent the directions with maximum variability and are ordered in terms
of the amount of variation of the original data they account for. The first PC accounts for as much
of the variability as possible, and each succeeding component accounts for as much of the
remaining variability as possible. Computation of the principal components reduces to the
solution of an eigenvalue-eigenvector problem. The projection vectors (or called the weighting
vectors) u can be obtained by eigenvalue decomposition on the covariance matrix SX,
S X ui = λi ui (3)
where λi is the i-th eigenvalue in the descending order for i=1,…,K, and ui is the corresponding
eigenvector. The eigenvalue λi measures the variance of the i-th PC and the eigenvector ui
provides the weights (loadings) for the linear transformation (projection). The maximum number
of components K is determined by the number of nonzero eigenvalues, which is the rank of S X,
and K ≤ min(n,p). The computational cost of PCA, determined by the number of original
predictor variables p and the number of samples n, is in the order of min(np2 + p3 , pn2 + n3). In
other words, the cost is O(pn2 + n3) when p > n.
5.2 Partial Least Squares
The objective of constructing components in PLS is to maximize the covariance between the
response variable y and the original predictor variables X,
w K = arg max Cov(Xw, y) (4)
w'w=1
subject to the constraint wi 'S X w j = 0 , for all 1 ≤ i < j. The central task of PLS is to obtain the
vectors of optimal weights wi (i=1,…,K) to form a small number of components that best predict
the response variable y. Note that PLS is a “supervised” method because it uses information on
both X and y in constructing the components, while PCA is an “unsupervised” method that
utilizes the X data only.](https://image.slidesharecdn.com/7317ijait01-170712045240/75/Dimension-Reduction-for-Script-Classification-Printed-Indian-Documents-5-2048.jpg)
![6
To derive the components, [t1, t2, …, tK], PLS decomposes X and y to produce a bilinear
representation of the data (Martens and Naes, 1989):
X = t1w'1 +t2 w'2 +... + t K w'K +E (5)
and
y = t1q1 + t2 q2 +... + t K qK + F (6)
where w’s are vectors of weights for constructing the PLS components t=Xw, q’s are scalars, and
E and F are the residuals. The idea of PLS is to estimate w and q by regression. Specifically, PLS
fits a sequence of bilinear models by least squares, thus given the name partial least squares
(Wold, [32],[33],[34]).
At each step i (i=1,…,K), the vector wi is estimated in such a way that the PLS component, ti, has
maximal sample covariance with the response variable y subject to being uncorrelated with all
previously constructed components. The first PLS component t1 is obtained based on the
covariance between X and y. Each subsequent component ti (i=2,…,K), is computed using the
residuals of X and y from the previous step, which account for the variations left by the previous
components. As a result, the PLS components are uncorrelated and ordered (Garthwaite, [35];
Helland, [36], [37]).
The maximum number of components, K, is less than or equal to the smaller dimension of X, i.e.
K ≤ min(n,p). The first few PLS components account for most of the covariation between the
original predictors and the response variable and thus are usually retained as the new predictors.
The computation of PLS is simple and a number of algorithms are available (Martens and Naes,
[38]). In this study, we used a standard PLS algorithm (Denham, [39]).
Like PCA, PLS reduces the complexity of microarray data analysis by constructing a small
number of gene components, which can be used to replace the large number of original gene
expression measures. Moreover, obtained by maximizing the covariance between the components
and the response variable, the PLS components are generally more predictive of the response
variable than the principal components.
The number of components, K, to be used in the class prediction model is considered to be a meta
parameter and must be estimated in the application, which we will discuss later. PLS is
computationally very efficient with cost only at O(np), i.e. the number of calculations required by
PLS is a linear function of n and p. Thus it is much faster than the other two methods (PCA and
SIR).
5.3 Sliced Inverse Regression
SIR, one of the sufficient dimension reduction methods (Li, [40]; Duan and Li,[41];Cook [42]), is
a supervised approach, which utilizes response information in achieving dimension reduction.
The idea of SIR is simple. Conventional regression models deal with the forward regression
function, E(y|X), which is a p-dimensional problem and difficult to estimate when p is large. SIR
is based on the inverse regression function,
η(y) = E(X | y) (7)
which consists of p one-dimensional regressions and is easier to deal with. The SIR directions v
can be obtained as the solution of the following optimization problem,](https://image.slidesharecdn.com/7317ijait01-170712045240/75/Dimension-Reduction-for-Script-Classification-Printed-Indian-Documents-6-2048.jpg)
![7
vK = arg max
v' Cov(E(X | y))v
(8)
v' SX vv'v=1
subject to the constraint vi 'S X v j = 0 , for all 1 ≤ i < j. Algebraically, the SIR
components ti=Xvi ( i=1,…,K) are linear combinations of the p original predictor variables
defined by the weighting vectors vi. Geometrically, SIR projects the data from the high p-
dimensional space to a much lower K-dimensional space spanned by the projection vectors v. The
projection vectors v are derived in such a way that the first a few represent directions with
maximum variability between the response variable and the SIR components. Computation of vi
is straightforward. Let Sη = Cov(E(X | y)) be the covariance matrix of the inverse regression
function defined in (7) and recall that SX is the variance-covariance matrix of X. The vectors vi
(i=1,…,K) can be obtained by spectral decomposition of Sη with respect to S X ,
Sη vi = λiS X vi (9)
where λi is the i-th eigenvalue in descending order for i=1,…,K; vi is the corresponding
eigenvector, and vi 'S X v j =1.
SIR is implemented by appropriate discretization of the response. Let T(y) be a discretization of
the range of y. SIR computes Cov(E(X|T(y))), the covariance matrix for the slice means of X,
which can be thought of as the between covariance for the subpopulations of X defined by T(y).
Usually, if the response is continuous, one divides its range into H slices. If the response is
categorical, one simply considers its categories. In class prediction problems, the number of
classes G is a natural choice for H, i.e. H=G. The maximum number of SIR components is H
minus one, i.e. K ≤ min(H-1,n,p). As discussed before, K is considered to be a meta-parameter
and may be estimated by cross-validation. The cost of computing SIR directions using the
standard algorithm is O(np2 + p3), which is quite expensive comparing to the cost of PLS. We
used a standard SIR algorithm (Härdle et al., [43]) in this study.
6. EXPERIMENTS AND RESULTS
6.1 Data Collection
At present, in India, standard databases of Indian scripts are unavailable. Hence, data for training
and testing the classification scheme was collected from different sources. These sources include
the regional newspapers available online [24] and scanned document images in a digital library
[25].
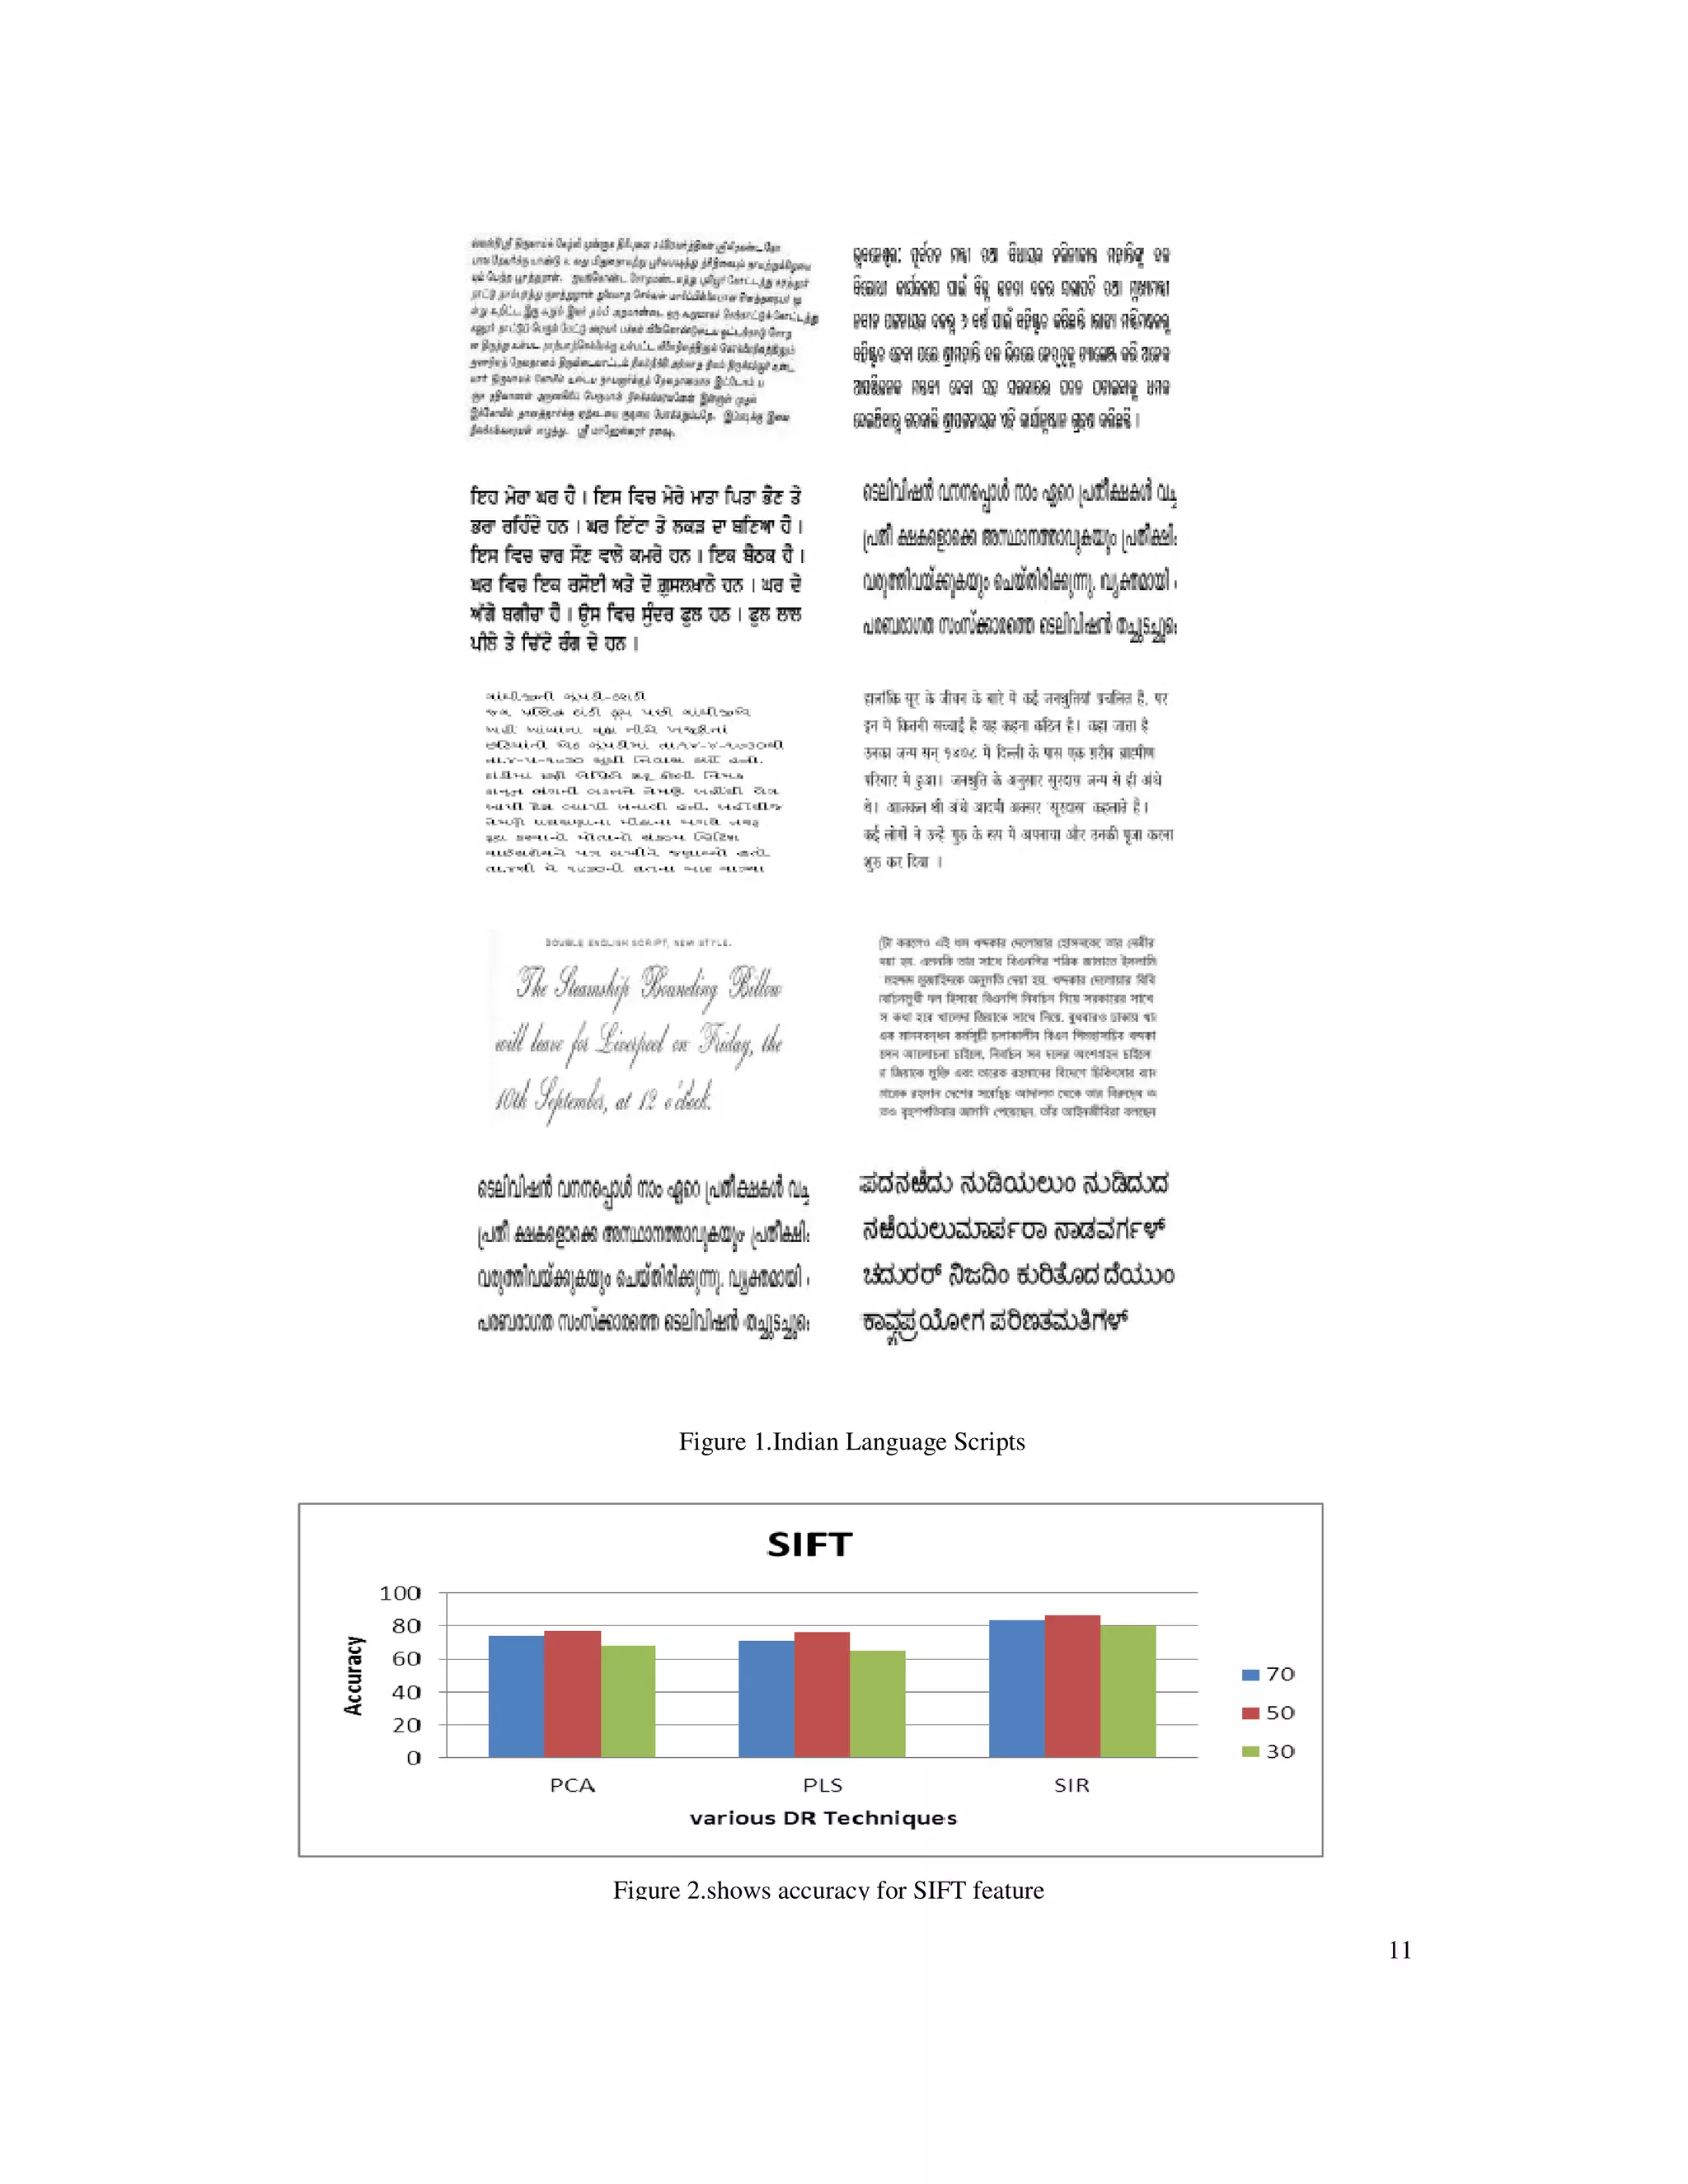
6.1.1 Indian Language Scripts
India has 18 official languages which includes Assamese, Bangla, English, Gujarati, Hindi,
Konkanai, Kannada, Kashmiri, Malayalam, Marathi, Nepali, Oriya, Punjabi, Rajasthani, Sanakrit,
Tamil, Telugu and Urdu. All the Indian languages do not have the unique scripts. Some of them
use the same script. For example, languages such as Hindi, Marathi, Rajasthani, Sanskrit and
Nepali are written using the Devanagari script; Assamese and Bangla languages are written using
the Bangla script; Urdu and Kashmiri are written using the same script and Telugu and Kannada
use the same script. In all, ten different scripts are used to write these 18 languages. These scripts
are named as Bangla, Devanagari, Roman (English), Gurumukhi, Gujarati, Malayalam, Oriya,](https://image.slidesharecdn.com/7317ijait01-170712045240/75/Dimension-Reduction-for-Script-Classification-Printed-Indian-Documents-7-2048.jpg)
![8
Tamil, Kannada and Urdu. The image blocks of these images are shown in Fig. 1. The dataset
consists of 10 classes of various scripts, with 100 images of each.
6.2 Nearest Neighbour (NN)
One of the simplest classifiers which we used is the Nearest Neighbor classifier [28][29]. The
term of nearest can be taken to mean the smallest Euclidean distances in n-dimensional feature
space. This takes a test sample feature in vector form, and finds the Euclidean distance between
this and the vector representation of each training example. The training sample closest to the test
sample is termed its Nearest Neighbor. Since the trained sample in some sense is the one most
similar to our test sample, it makes sense to allocate its class label to the test sample. This exploits
the ‘smoothness’ assumption that samples near each other are likely to have the same class.
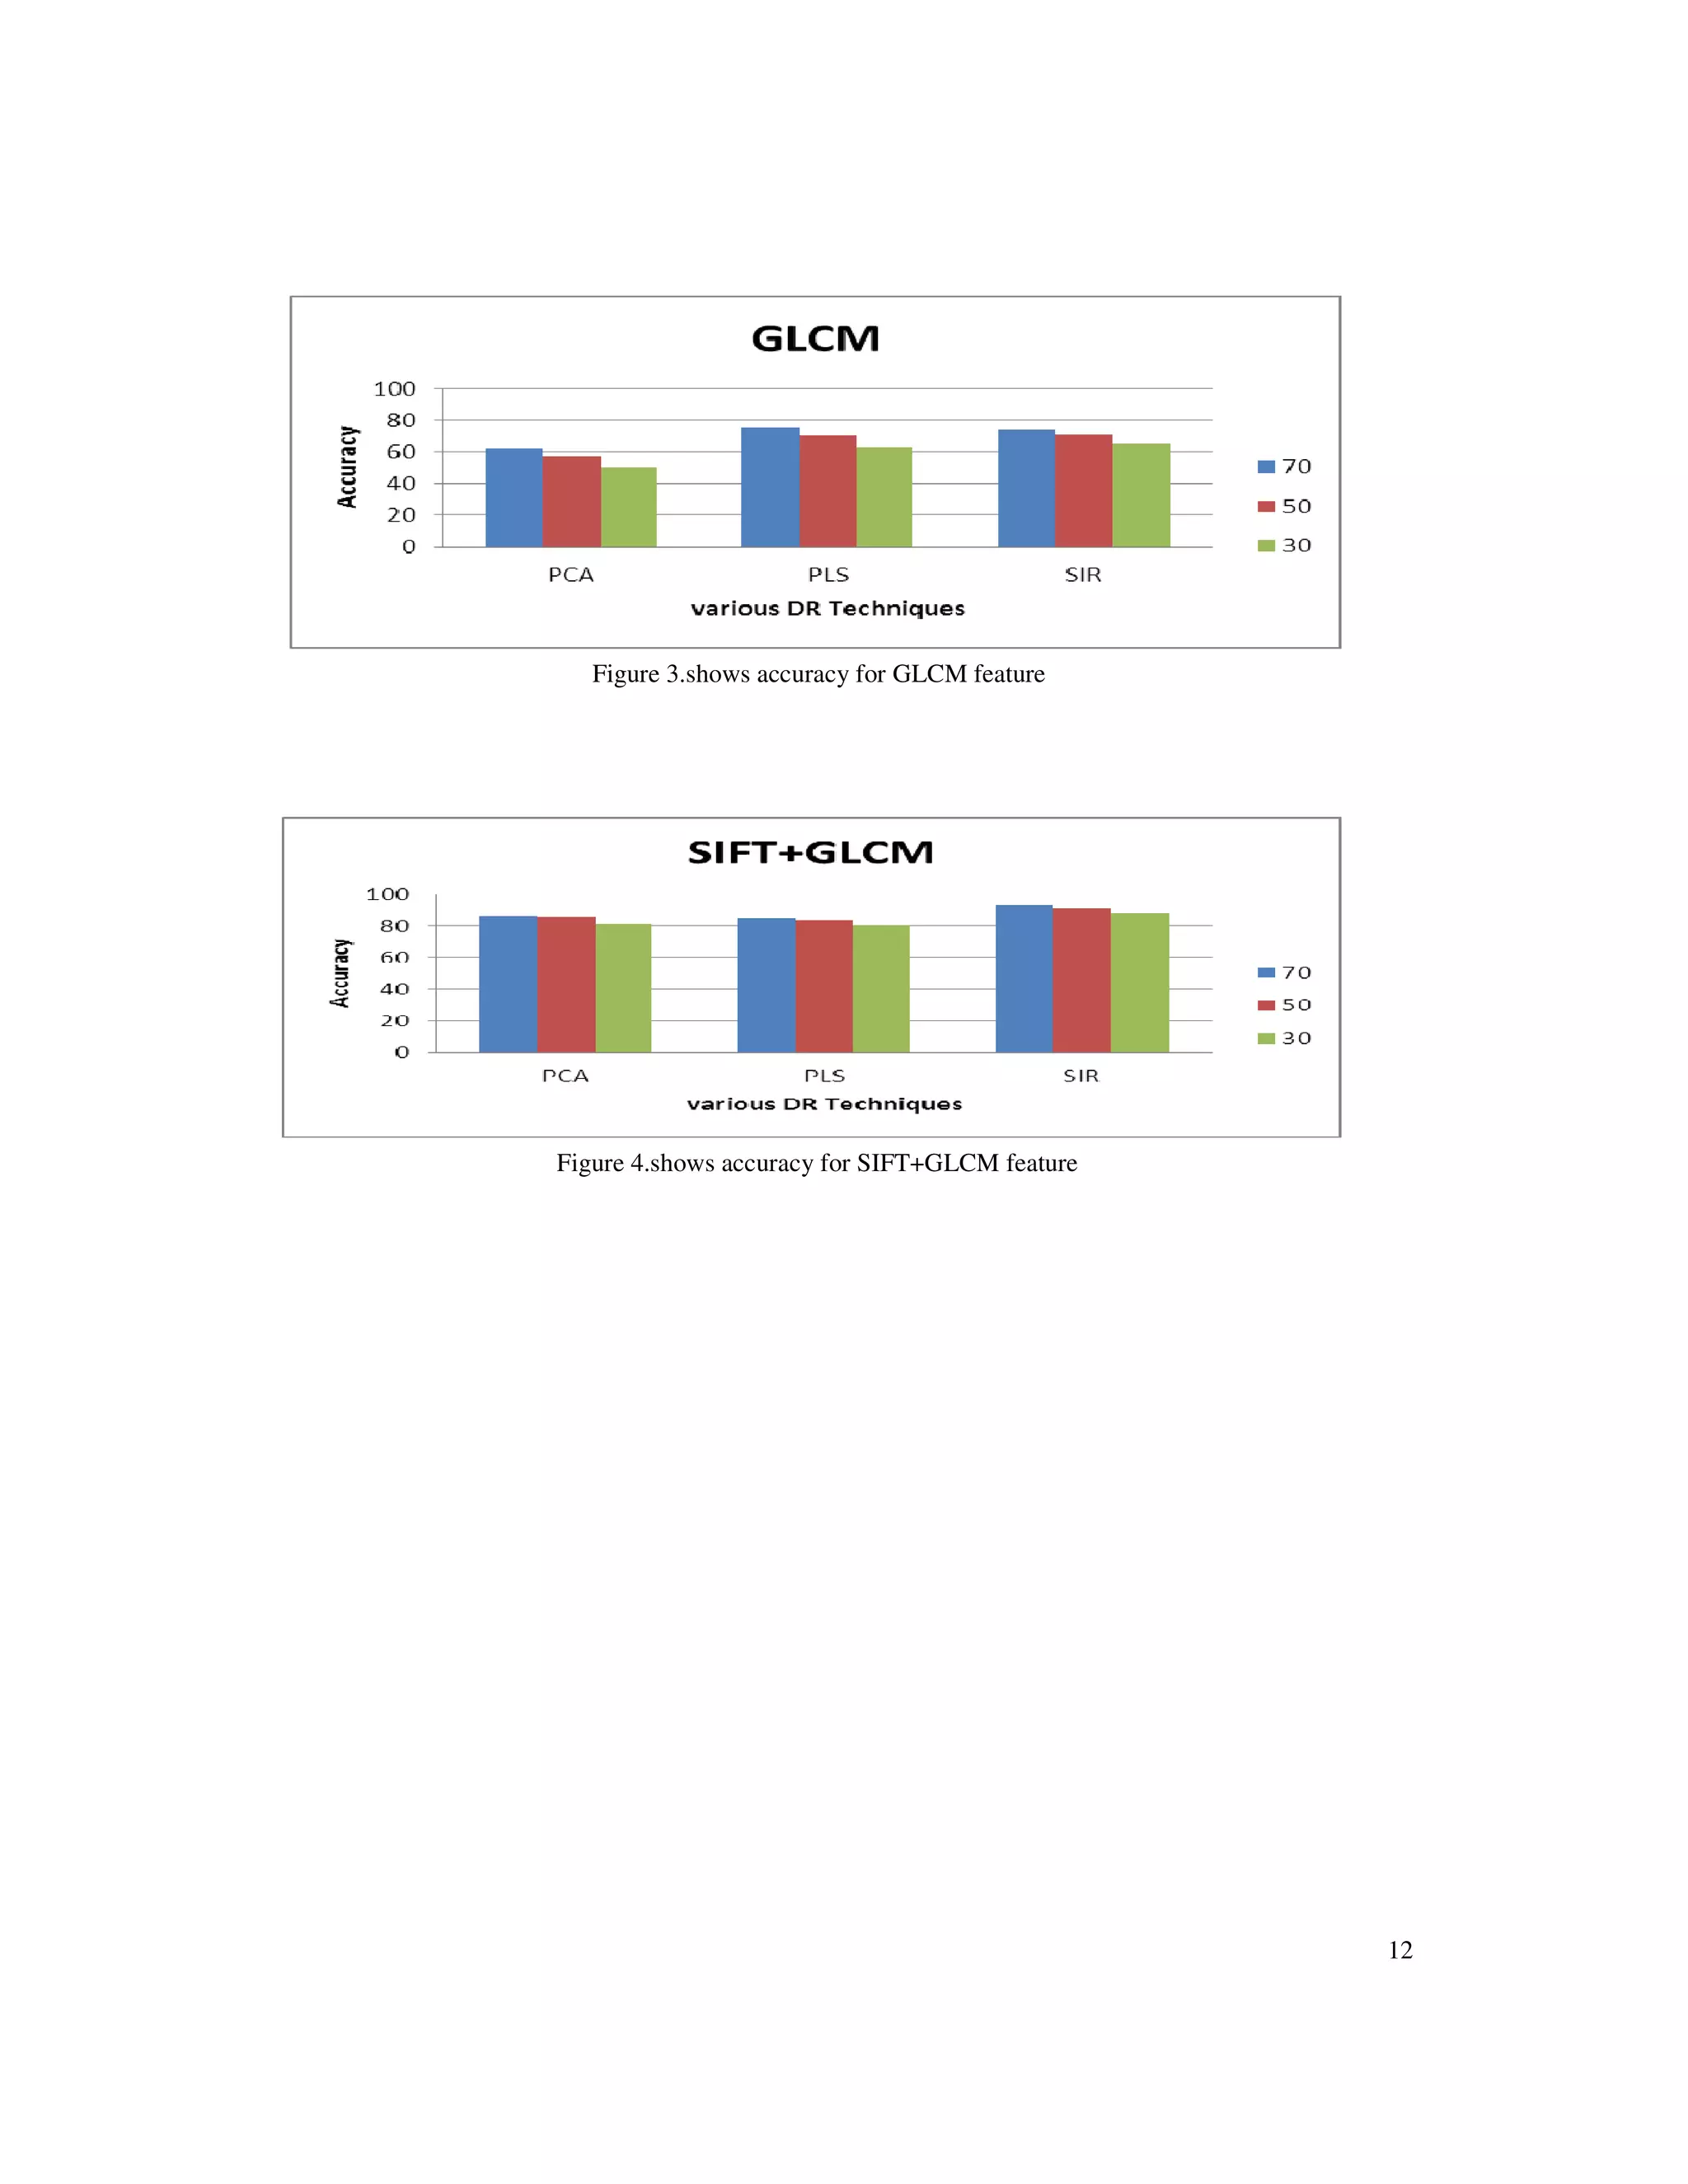
6.3 Results
We have performed experiments with different types of images such as normal, bold, thin, small,
big, etc. The experimentation has been conducted under varying training samples from 30 to 70
percent of database. We report the accuracies obtained in all cases. The results obtained for
various features like SIFT, GLCM and combination (SIFT + GLCM) are respectively shown in
Figure 1, Figure 2 and Figure 3. From figures we can understand that the combination of GLCM
and SIFT gives a good classification accuracy of 93.
7. CONCLUSION
In this paper, we have proposed a Nearest Neighbour based script classification method with the
use features such as GLCM, and SIFT. Specifically, we compared three dimension reduction
methods (PLS, SIR, PCA), examined the relative performance of classification procedures
incorporating those methods. We found that PLS and SIR were both effective in dimension
reduction and they were more effective than PCA. The PLS and SIR based classification
procedures performed consistently better than the PCA based procedure in prediction accuracy.
The empirical results are consistent with the analysis of the techniques. PLS and SIR construct
new predictors using information on the response variable while PCA does not; thus PLS and SIR
components are more likely to be good predictors than those from PCA. Considering predictive
accuracy, we conclude that the SIR based procedure has provided the best performance among
the three classification procedures.
REFERENCES
[1]. U. Pal, S. Sinha and B. B.Chaudhri, (2003) “Multi-Script Line Identification from Indian
Documents”, Proceedings of International Conference on Document Analysis and Recognition, pp.
880-884.
[2]. Pal U., Chaudhuri B.B., (1999), “Script line separation from Indian multi-script document”, Proc.
5th Int. Conf. on Document Analysis and Recognition (IEEE Comput. Soc. Press), 406–409.
[3]. Pal U. and Chaudhuri B.B., (2003), “Script line identification from Multi script documents”, IETE
journal Vol. 49, No 1, 3-11.
[4]. Basavaraj Patil S. and Subbareddy N.V., (2002), “Neural network based system for script
identification in Indian documents”, Sadhana Vol. 27, Part 1, 83–97.
[5]. Dhandra B.V., Nagabhushan P., Mallikarjun Hangarge, Ravindra Hegadi, Malemath V.S., (2006),
“Script Identification Based on Morphological Reconstruction in Document Images”, The 18th
International Conference on Pattern Recognition (ICPR'06), Vol.No. 11-3, 950-953.](https://image.slidesharecdn.com/7317ijait01-170712045240/75/Dimension-Reduction-for-Script-Classification-Printed-Indian-Documents-8-2048.jpg)
![9
[6]. Pal U., Chaudhuri B.B., (1999), “Script line separation from Indian multi-script document, Proc. 5th
Int. Conf. on Document Analysis and Recognition”, (IEEE Comput. Soc. Press), 406–409.
[7]. Lijun Zhou, Yue Lu and Chew Lim Tan, (2006),” Bangla/English Script Identification based on
Analysis of Connected component Profiles”, Proc. 7th IAPR workshop on Document Analysis
System, New land, 234-254.
[8]. Vipin Gupta, G.N. Rathna, K.R. Ramakrishnan, (2006), “ A Novel Approach to Automatic
Identification of Kannada, English and Hindi Words from a Trilingual Document”, Int. conf. on
Signal and Image Processing, Hubli, pp. 561-566.
[9]. Santanu Chaudhury, Gaurav Harit, Shekar Madnani, Shet R.B., (2000),” Identification of scripts of
Indian languages by Combining trainable classifiers”, Proc. of ICVGIP, India.
[10]. Gopal Datt Joshi, Saurabh Garg, and Jayanthi Sivaswamy, (2006), “Script Identification from Indian
Documents”, H. Bunke and A.L. Spitz (Eds.): DAS 2006, LNCS 3872, 255–267.
[11]. Dhanya D., Ramakrishnan A.G. and Pati P.B., (2002), “Script identification in printed bilingual
documents, Sadhana”, vol. 27, 73-82.
[12]. Hiremath P S and S Shivashankar, (2008), “Wavelet Based Co-occurrence Histogram Features for
Texture Classification with an Application to Script Identification in a Document Image”, Pattern
Recognition Letters 29, pp 1182-1189.
[13]. Srinivas Rao Kunte R. and Sudhakar Samuel R.D., (2002), A Neural Approach in On-line Script
Recognition for Telugu Language Employing Wavelet Features, National Workshop on Computer
Vision, Graphics and Image Processing (WVGIP), 188-191.
[14]. Peeta Basa Pati, S. Sabari Raju, Nishikanta Pati and A. G. Ramakrishnan, (2004 ), “Gabor filters for
Document analysis in Indian Bilingual Documents”, 0-7803-8243-9/04/ IEEE, IClSlP, pp. 123- 126.
[15]. Spitz A. L., (1994), Script and language determination from document images, Proc. of the 3rd
Annual Symposium on Document Analysis and Information Retrieval, Las Vegas, Nevada, 229-235.
[16]. Wood S. L.; Yao X.; Krishnamurthy K. and Dang L., (1995): Language identification for printed text
independent of segmentation, Proc. Int. Conf. on Image Processing, 428–431, IEEE 0- 8186-7310-
9/95.
[17]. Hochberg J., Kerns L., Kelly P. and Thomas T., (1997), Automatic script identification from images
using cluster based templates, IEEE Trans. Pattern Anal. Machine Intell. Vol. 19, No. 2, 176–181.
[18]. Ding J., Lam L. and Suen C. Y., (1997), Classification of oriental and European Scripts by using
Characteristic features, Proc. 4th ICDAR , 1023-1027.
[19]. Tan T. N., (1998): Rotation invariant texture features and their use in automatic script identification,
IEEE Trans. Pattern Anal. Machine Intell. PAMI, Vol.20, No. 7, 751–756.
[20]. Andrew Busch; Wageeh W. Boles and Sridha Sridharan, (2005), Texture for Script Identification,
IEEE Transactions on Pattern Analysis and Machine Intelligence, Vol. 27, No. 11, pp. 1720-1732.
[21]. B. Kumar, A. Bera and T. Patnaik, (2012), “Line Based Robust Script Identification for Indian
Languages”, International Journal of Information and Electronics Engineering, vol. 2, no. 2 ,pp. 189-
192.
[22]. R. Rani, R. Dhir and G. S. Lehal, (2013), “Modified Gabor Feature Extraction Method for Word
Level Script Identification- Experimentation with Gurumukhi and English Scripts”, International
Journal of Signal Processing, Image Processing and Pattern Recognition, vol. 6, no. 5, pp. 25-38.
[23]. A. K. Jain and Y. Zhong., (1996), Page segmentation using texture analysis. Pattern Recognition 29,
743–770.
[24]. http://www.samachar.com/.
[25]. Digital Library of India. http://dli.iiit.ac.in/
[26]. R. M. Haralick, K. Shanmugam, and I. Dinstein, (1973), Textural Features of % Image
Classification, IEEE Transactions on Systems, Man and Cybernetics, % vol. SMC-3, no. 6.
[27]. Lowe, D. G., (2004), “Distinctive Image Features from Scale-Invariant Keypoints”, International
Journal of Computer Vision, 60, 2, pp. 91-110.
[28]. Hall P, Park BU, Samworth R J . (2008), “Choice of neighbor order in nearest-neighbor
classification”. Annals of Statistics36 (5): 2135–2152.
[29]. Bremner D, Demaine E, Erickson J, Iacono J, Langerman S, Morin P, Toussaint G. (2005), “Output-
sensitive algorithms for computing nearest-neighbor decision boundaries”. Discrete and
Computational Geometry33 (4): 593–604.
[30]. Jolliffe, I.T. (1986), “Principal Component Analysis”. Springer, New York.](https://image.slidesharecdn.com/7317ijait01-170712045240/75/Dimension-Reduction-for-Script-Classification-Printed-Indian-Documents-9-2048.jpg)
![10
[31]. Massey, W.F. (1965).,”Principal Components regression in exploratory statistical research”. Journal
of American Statistical Association, 60, 234-246.
[32]. Wold, H. (1966), “Nonlinear estimation by iterative least squares procedures”. In Research Papers in
Statistics, ed. F.N. David, pp. 411-444. Wiley, New York.
[33]. Wold, H. (1973), “Nonlinear iterative partial least squares (NIPALS) modeling: some recent
developments”. In Multivariate Analysis III, ed. P. Krishnaiah, pp. 383-407, Academic Press, New
York.
[34]. Wold, H. (1982), “Soft modeling: the basic design and some extensions. In Systems under Indirect
Observation: Causality-Structure-Prediction”, ed. K. G. Joreskog and H. Wold, Vol. II, Ch. 1, pp. 1-
54, North-Holland, Amsterdam..
[35]. Garthwaite, P.H. (1994), “An interpretation of partial least squares”. Journal of American Statistical
Association, 89, 122-127.
[36]. Helland, I.S. (1988),” On the structure of partial least squares”. Communications in Statistics:
Simulation and Computation, 17, 581-607.
[37]. Helland, I.S. (1990), “Partial least squares regression and statistical models”. Scandinavian Journal
of Statistics, 17, 97-114.
[38]. Martens, H. and Naes, T. (1989), “Multivariate Calibration”. Wiley, New York.
[39]. Denham, M.C. (1995), “Implementing partial least squares. Statistics and Computing”, 5, 191-202.
[40]. Li, K.C. (1991), “Sliced inverse regression for dimension reduction”. Journal of American Statistical
Association, 86, 316-342.
[41]. Duan, N. and Li, K.C. (1991), “Slicing regression: a link-free regression method”. The Annals of
Statistics, 19, 505-530..
[42]. Cook, R.D. (1998), “Regression Graphics”. John Wiley & Sons, New York.
[43]. Härdle, W., Klinke, S. and Turlach, B.A. (1995), “XploRe: an Interactive Statistical Computing
Environment”, Springer-Verlag, New York.
[44]. Bijalwan, Vishwanath, et al. (2014),"KNN based Machine Learning Approach for Text and
Document Mining." International Journal of Database Theory and Application 7.1, 61-70.
[45]. Kumari, Pinki, and Abhishek Vaish. (2015),"Brainwave based user identification system: A pilot
study in robotics environment." Robotics and Autonomous Systems 65, 15-23.
[46]. Kumari, Pinki, and Abhishek Vaish. (2014), "Brainwave's energy feature extraction using wavelet
transform." Electrical, Electronics and Computer Science (SCEECS), IEEE Students' Conference on.
IEEE.
[47]. Bijalwan V.et al., (2014), Machine learning approach for text and document mining, arXivpreprint
arXiv:1406.1580.
[48]. Kumari, Pinki, and Abhishek Vaish. (2011),"Instant Face detection and attributes recognition."
International Journal of Advanced Computer Science and Applications (IJACSA-ISSN 2156 5570).](https://image.slidesharecdn.com/7317ijait01-170712045240/75/Dimension-Reduction-for-Script-Classification-Printed-Indian-Documents-10-2048.jpg)