The paper presents a novel method for identifying partially similar Indian scripts using texture symmetry factors through cumulants and bispectra analysis. By enhancing dissimilarity in script samples and utilizing Support Vector Machines (SVM), the method successfully identifies eight different Indian scripts with high accuracy. The study emphasizes the significance of sample size and the effectiveness of the proposed feature extraction technique in script recognition.
![Rajiv Kapoor & Amit Dhamija
International Journal of Image Processing (IJIP), Volume (6) : Issue (2) : 2012 94
A New Method for Identification of Partially Similar Indian
Scripts
Rajiv Kapoor rajivkapoor@dce.edu
Department of Electronics and Communication Engg.
Delhi Technological University
Delhi, India
Amit Dhamija dhamija.amit@hotmail.com
Department of Electrical Engg.
YMCA University of Science and Technology
Faridabad, Haryana, India
Abstract
In this paper, the texture symmetry/non-symmetry factor has been exploited to identify the Indian
scripts. Biwavelants have been proposed to obtain the script texture using third order cumulant
and bispectra. As the Indian scripts are partially similar to each other, in order to identify them,
the samples must include more number of dissimilar characters. The features of individual lines
are added repeatedly to enhance the dissimilarity until it reaches to a saturation level which in
turn is used to compute a confidence factor i.e. amount of confidence attained in identifying a
particular script sample. This variation in confidence factor also gives an estimate of the optimum
sample size (number of lines) required for expected results. Cumulants are sensitive to the script
curvatures and therefore are most suitable for the partially similar Indian scripts. The double
discrete Fourier transform of third order cumulant gives bispectra which estimates the factor of
symmetry/non-symmetry in terms of the quadratically coupled frequencies. The envelope of
bispectra (biwavelant) obtained using wavelet (db8) provides an accurate behavior of the script
texture; which along with Newton-Raphson technique is used to classify the Indian scripts.
Various classifiers have been tested for script identification and out of them SVM gives the best
results. The method successfully identified the 8 Indian scripts like Devanagari, Urdu, Gujarati,
Telugu, Assamese, Gurmukhi, Kannada, and Bangla with desired accuracy.
Keywords: Indian Scripts, Cumulant, Bispectra and Support Vector Machine (SVM)
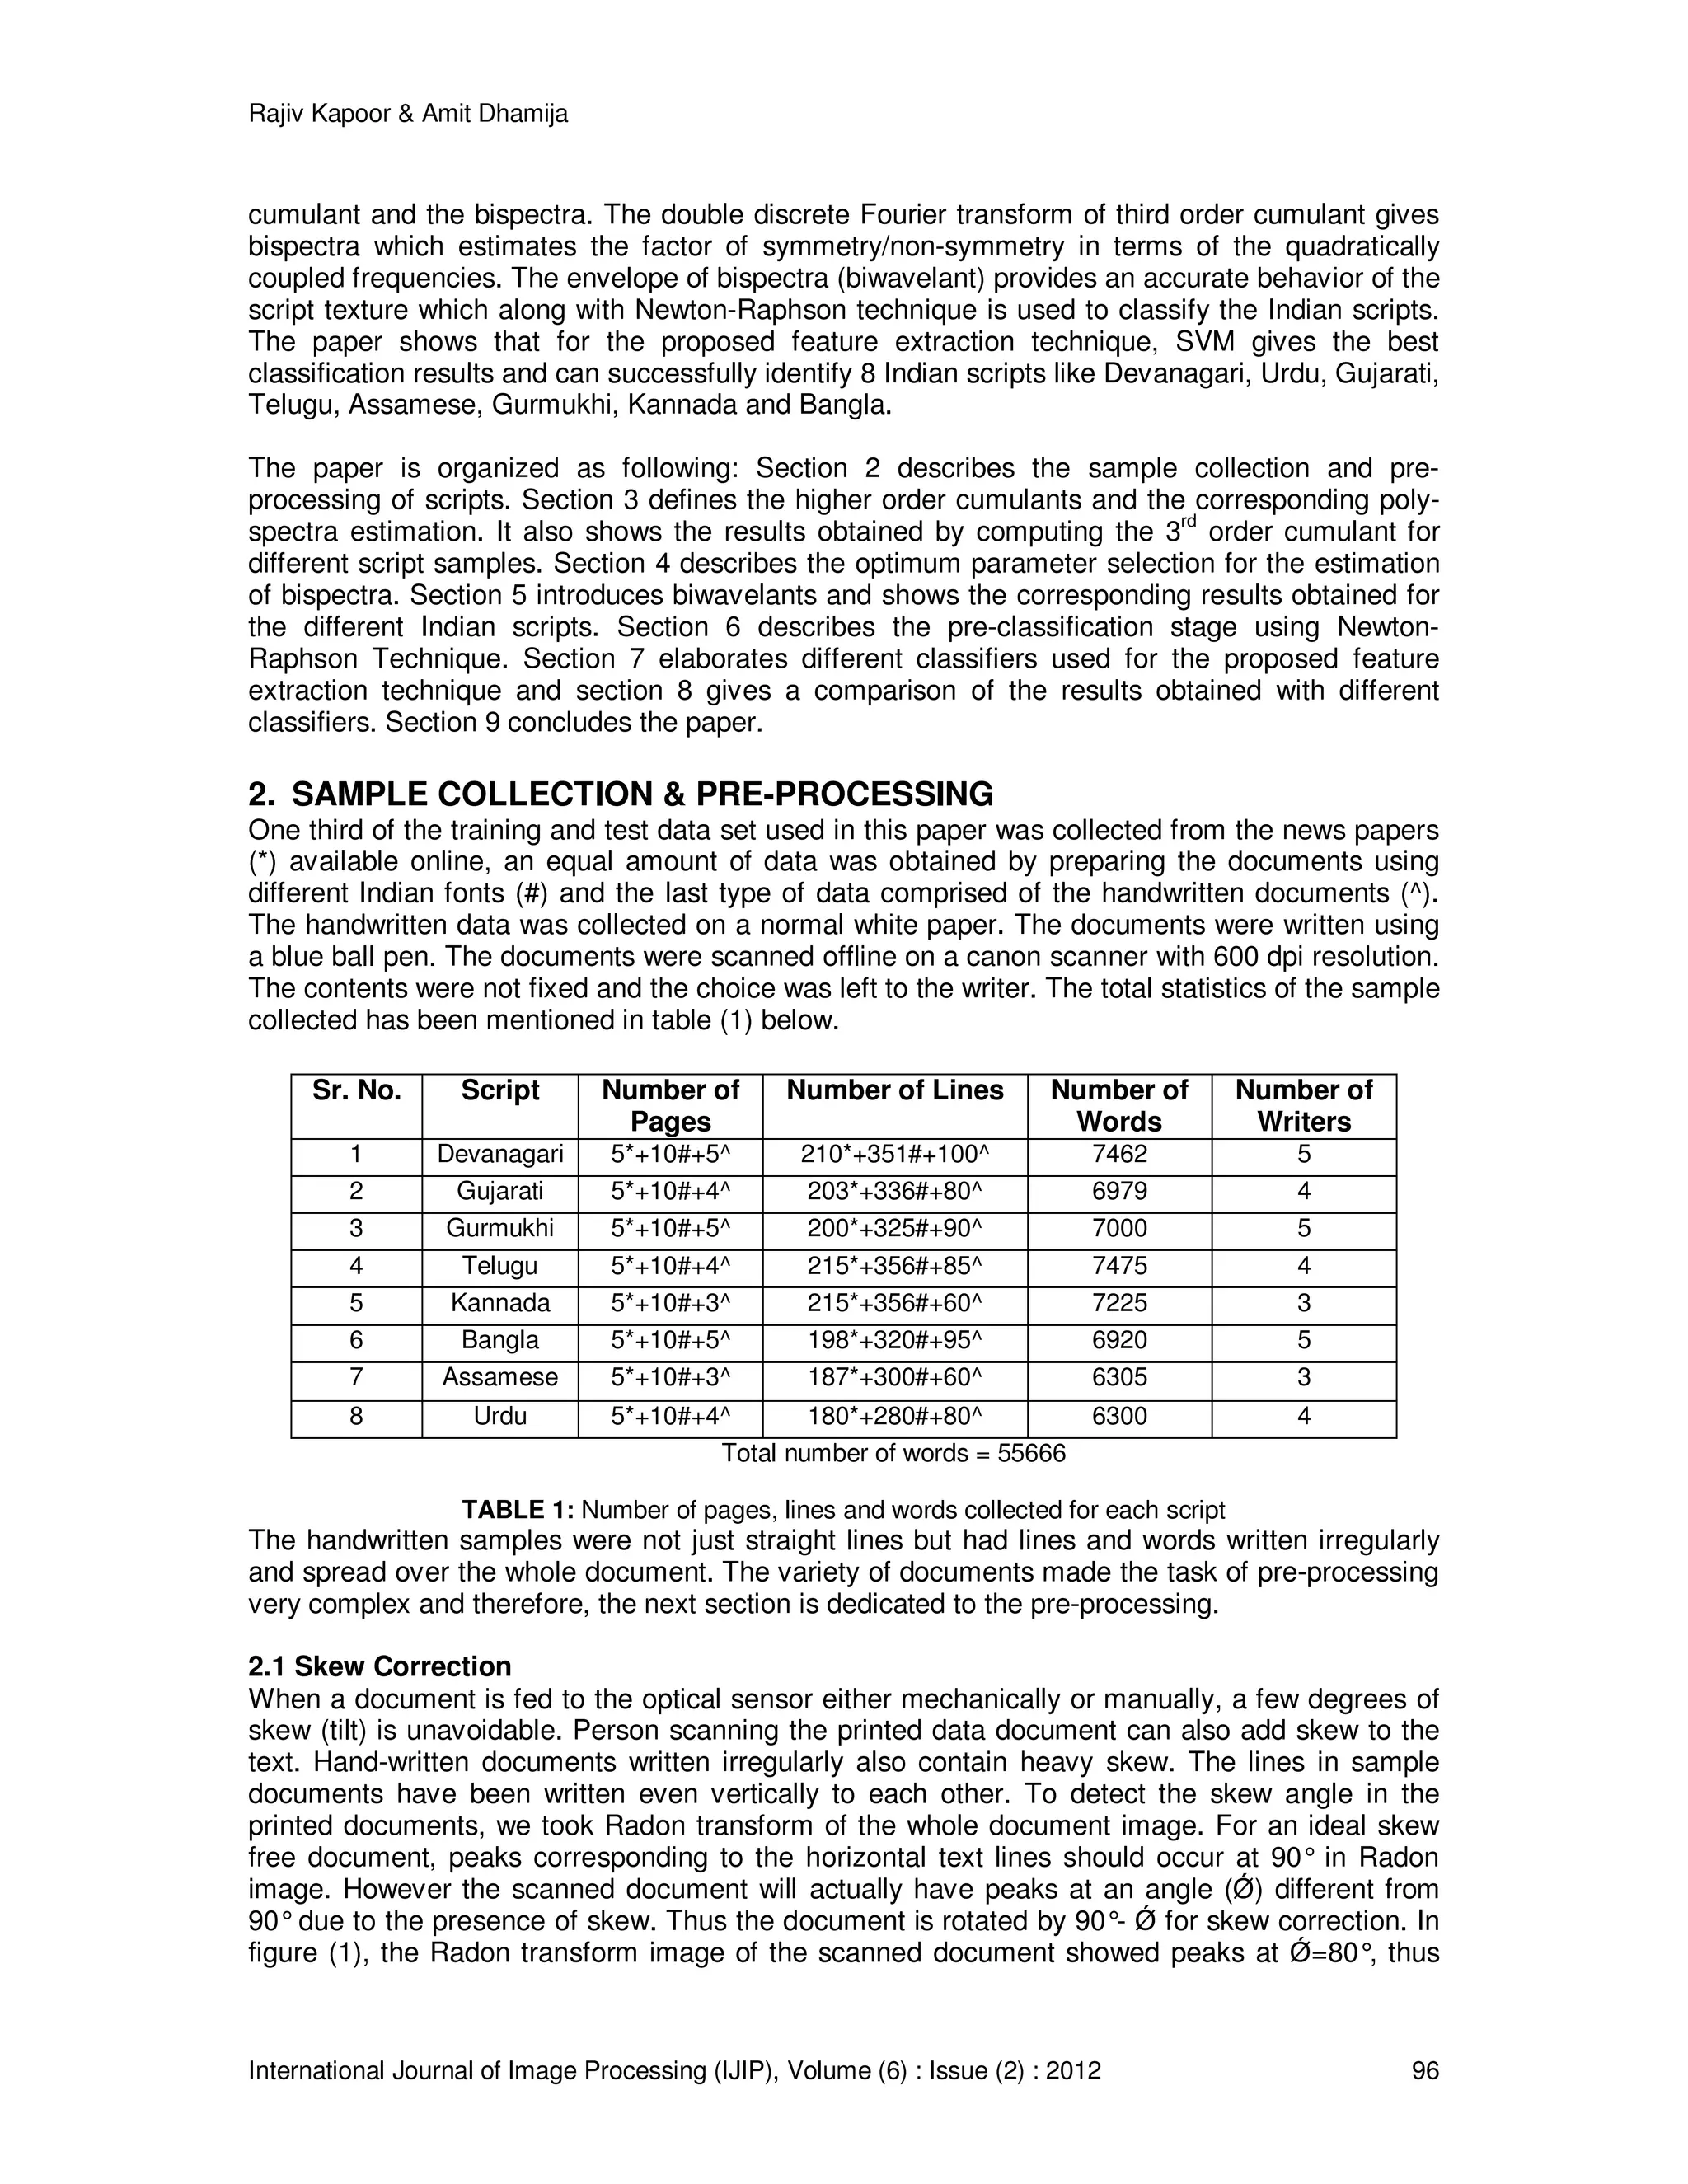
1. INTRODUCTION
Script identification is a key part of automatic processing of document images. A document script
must be known in order to choose an appropriate OCR algorithm. Further processing like
indexing or translation of scripts depends on identifying the language used in a document and
here again script identification is crucial. Now-a-days documents are stored digitally so as to have
quicker access and to save them from any kind of environmental effect. Most of the states in India
have their own language of communication and independent scripts. Thus, many official
documents are written in regional scripts. Identification of these regional scripts is one of the
challenging tasks faced by the designer of an OCR system. Script identification makes the task of
analysis and recognition of the text easier by suitably selecting the modalities of OCR. What
makes recognition of Indian scripts daunting is their undistinguishable closeness. A number of
attempts have already been made to isolate and identify the scripts of the texts in the case of
multi-script Indian documents. Patil and Subbareddy [1] developed a system having a feature
extractor and a modular neural network. They dilated the documents using 3 x 3 masks in
horizontal, vertical, right diagonal, and left diagonal directions. Average pixel distribution was
found in these resulting images. A combination of separately trained feed forward neural network
was utilized as classifiers for each script. Hochberg [2] approach was to discover frequent
character shapes in each script and then look for same instances in new documents. Some](https://image.slidesharecdn.com/ijip-519-151230144954/75/A-New-Method-for-Identification-of-Partially-Similar-Indian-Scripts-1-2048.jpg)
![Rajiv Kapoor & Amit Dhamija
International Journal of Image Processing (IJIP), Volume (6) : Issue (2) : 2012 95
identification techniques have also used the directional features, however to a meager amount.
Dhanaya, Ramakrishnan and Pati [3] used basically two features of the scripts like Roman and
Tamil. First was Spatial Spread Features like Zonal pixel concentration and character density.
Directional Features were detected by using Gabor filter responses. It was concluded that Tamil
script has more horizontal lines and strokes while English has more slant strokes. They used
Gabor filters to effectively capture the concentration of energies in various directions. Chaudhuri
and Pal [4] used skew angle detection for scanned documents containing popular Indian scripts
(Devanagari and Bangla). Most characters in these scripts have horizontal line at the top called
headlines (Shirorekha). Chaudhuri and Sheth [5] proposed a Gabor filter-based feature extraction
scheme for the connected components. Pal and Chaudhuri [6] proposed an automatic technique
of separating the text lines using script characteristics and shape-features. Spitz [7] developed
techniques for distinguishing the script into two broad classes: Han-based and Latin-based. This
classification was based on the spatial relationships of features related to the upward concavities
in character structures. Language identification within the Han script class (Chinese, Japanese,
and Korean) was performed by analysis of the distribution of optical density in the text images.
Tan [8] extracted rotation invariant texture features and then used such features in script
identification from document images. Rotation invariant texture features are computed based on
the popular multi-channel Gabor filtering technique. Hochberg [9] used features of connected
components to classify six different scripts (Arabic, Chinese, Cyrillic, Devanagari, Japanese, and
Roman). Srinivasan, Ramakrishnan and Budhlakoti [10] proposed the spatial entropy obtained
after decomposing the characters from the document image. The method is not adaptive to the
writing styles and moreover after decomposing the characters, the spatial entropy will be
definable under so many constraints which have not been discussed. Veena and Sinha [11]
proposed a technique using smallest segments of the Devanagari structures to define the
Devanagari characters. The method is very time consuming and detection is an issue. Sameer
and Lalitha [12] suggested a preliminary technique based upon multiple classifiers like k-means
classifier and Minimum Hamming Distance classifier. Anup and Anil [13] could extract temporal
information due to online detection recognition and a set of features like Horizontal Inter-stroke
Direction for capturing the writing direction like in the case of Arabic which is written from left to
right, detection of Shirorekha for Devanagari, average stroke length, number of strokes per unit
length, aspect ratio and few more like VD and VID. In these scripts, specific features could work
because the scripts chosen for analysis are not related to each other and therefore the task is
easier. Second kind of feature is heuristic and depends highly upon the writing style and hence
will not work for all Indian scripts because they are highly related. Andrew, Wageeh and
Sridharan [14] considered all scripts as texture of their own kind. Yes, this is true but the use of
clustering techniques and the wavelet decomposition helps more in case of grey level images as
compared to binary. Scripts which are closely related will have similar structures and texture.
Texture of the scripts is formed by symmetrical spread of the structural features like horizontal
lines, vertical lines and curves. This texture is of binary levels and not like grey ones as in
wooden texture. Therefore the kind of features considered by Andrew, Wageeh and Sridhar do
not give the high identification accuracy in case of scripts having structural and textural similarity.
Morphological reconstruction [15] based upon the continuous erosion and opening was carried
out in 4 directions and the average pixel distribution was found as the feature point. MLP [16] has
also been used as classifier with the fuzzy-features from the Hough transform. In [17], support
vector machine (SVM) based hierarchical classification scheme has been used for the recognition
of handwritten Bangla characters. SVM classifier is found to outperform the other classifiers like
multilayer perceptron and radial basis function network. [18] elaborates various noises that affect
the performance of a script recognition system and the techniques to counter them.
What makes recognition of Indian scripts difficult is their similarity. But, since they are partially
similar, their inherent dissimilarity should be enhanced in order to make them completely
distinguishable. The features of individual lines are added repeatedly to enhance the dissimilarity
until it reaches to a saturation level. As cumulants are sensitive to the script curvatures, they are
completely suitable for identifying the Indian Scripts. This paper discusses the use of
symmetry/non-symmetry factor of the script texture for identifying the partially similar Indian
scripts. Biwavelants have been proposed to obtain the script texture using the third order](https://image.slidesharecdn.com/ijip-519-151230144954/75/A-New-Method-for-Identification-of-Partially-Similar-Indian-Scripts-2-2048.jpg)
![Rajiv Kapoor & Amit Dhamija
International Journal of Image Processing (IJIP), Volume (6) : Issue (2) : 2012 97
initial script
0 50 100 150 200 250 300 350
0
50
100
150
200
250
300
350
400
450
500
Segmented Line Segmented Line
Segmented Line Segmented Line
document was rotated by 10°anticlockwise to remove the skew error. [19] discusses the method
in detail.
(a) (b) (c)
FIGURE 1: (a) The original scanned document image, (b) Radon transform of the document showing peaks
at Ǿ=80°and (c) The document image after skew correction
2.2 Segmentation
Case 1: In figure (2), the lines were separated using horizontal projection and similarly the words
were separated using the vertical projection. The printed documents after skew correction could
be segmented completely with 100% accuracy. Separated words were concatenated to each
other to remove any space in-between them and finally, the words were joined together to make a
bigger line. The length of the line was approximately 14 words. These lines were used as input to
the next stage of script recognition process. Space between the words was removed to avoid its
effect on the result of the cumulant.
(a) (b)
(c)
FIGURE 2: First technique - line segmentation
(a) Original script, (b) Horizontal projection and (c) Segmented lines
Case 2: In some of the hand-written documents, words could not be separated using the
projection technique and hence the morphologically conditioned k-means was used to separate
them. The structuring element used was a line of three pixel length at an angle of 90o
. Size of the
structuring element was decided to make the word look like a cluster. When analyzed, the three
pixel length was an optimum choice to make the word of any font and size separable. The
documents were initially eroded and then k-means clustering method was applied to get the
cluster centroids. The major limitation of using k-means is that it requires the optimal number of](https://image.slidesharecdn.com/ijip-519-151230144954/75/A-New-Method-for-Identification-of-Partially-Similar-Indian-Scripts-4-2048.jpg)
![Rajiv Kapoor & Amit Dhamija
International Journal of Image Processing (IJIP), Volume (6) : Issue (2) : 2012 98
clusters as input i.e. the total number of words in the sample document should be known very
precisely before applying the unsupervised clustering techniques. MDL (minimum description
length) criteria was used [20] to determine the optimum number of clusters (words) for the
individual document. k-NN was used to isolate the words of the hand-written document. This
method also works perfectly for the documents having words with some ligature connecting them.
Figure (3) shows the document and the segmentation results.
FIGURE 3: Second technique – word segmentation
Space was never allowed to be considered as part of the text for analysis. The script identification
is a process which does not consider the space and the carriage return as a part of the text for
getting the script features.
3. CUMULANTS
Cumulants are used to extract the inherent features of Indian scripts which are otherwise
extremely difficult to extract. Higher order cumulant helps in understanding the multi-dimensional
information. Structures are generally specific to the scripts, very complex and some times vary
slightly from one script to the other. The paper has successfully attempted to distinguish the
Indian Scripts. The first-order cumulant of a stationary process is the mean, . The
higher-order cumulants represent central moments and therefore are invariant to the mean shift.
Hence, it is convenient to define them under the assumption of zero mean. If the process has a
nonzero mean, we subtract the mean and then apply the following definitions to the resulting
process. The second, third and fourth-order cumulants of a zero-mean stationary process are
defined by equations (1, 2 and 3).
{ })()()(2 knxnxkC x +Ε= ∗
(1)
{ })()()(),(3 lnxknxnxlkC x ++Ε= ∗
(2)
(3)
where and equals for a real valued process. The zero-lag
cumulants have special names like is the variance and and are
usually denoted by and . We will refer to the normalized quantities as the
skewness and as the kurtosis. These normalized quantities are both shift and scale
invariant. If is symmetrically distributed, its skewness is necessarily zero (but not vice versa);
if is Gaussian distributed, its kurtosis is necessarily zero (but not vice versa). Often the terms
skewness and kurtosis are used to refer to the un-normalized quantities, and . Equation (4)
shows that the cumulants of a stationary real-valued process are symmetric in their arguments.
)()( 22 kCkC xx −=](https://image.slidesharecdn.com/ijip-519-151230144954/75/A-New-Method-for-Identification-of-Partially-Similar-Indian-Scripts-5-2048.jpg)
![Rajiv Kapoor & Amit Dhamija
International Journal of Image Processing (IJIP), Volume (6) : Issue (2) : 2012 102
-0.5 -0.4 -0.3 -0.2 -0.1 0 0.1 0.2 0.3 0.4 0.5
-0.5
-0.4
-0.3
-0.2
-0.1
0
0.1
0.2
0.3
0.4
0.5
Bispectrum from direct method phase plot
f1
f2
-1.5
-1
-0.5
0
0.5
1
1.5
-0.5 -0.4 -0.3 -0.2 -0.1 0 0.1 0.2 0.3 0.4 0.5
-0.5
-0.4
-0.3
-0.2
-0.1
0
0.1
0.2
0.3
0.4
0.5
Bispectrum from direct method phase plot
f1
f2
-0.6
-0.4
-0.2
0
0.2
0.4
0.6
-0.5 -0.4 -0.3 -0.2 -0.1 0 0.1 0.2 0.3 0.4 0.5
-0.5
-0.4
-0.3
-0.2
-0.1
0
0.1
0.2
0.3
0.4
0.5
Bispectrum from direct method phase plot
f1
f2
-0.2
-0.15
-0.1
-0.05
0
0.05
0.1
0.15
0.2
(c) (d)
(e)
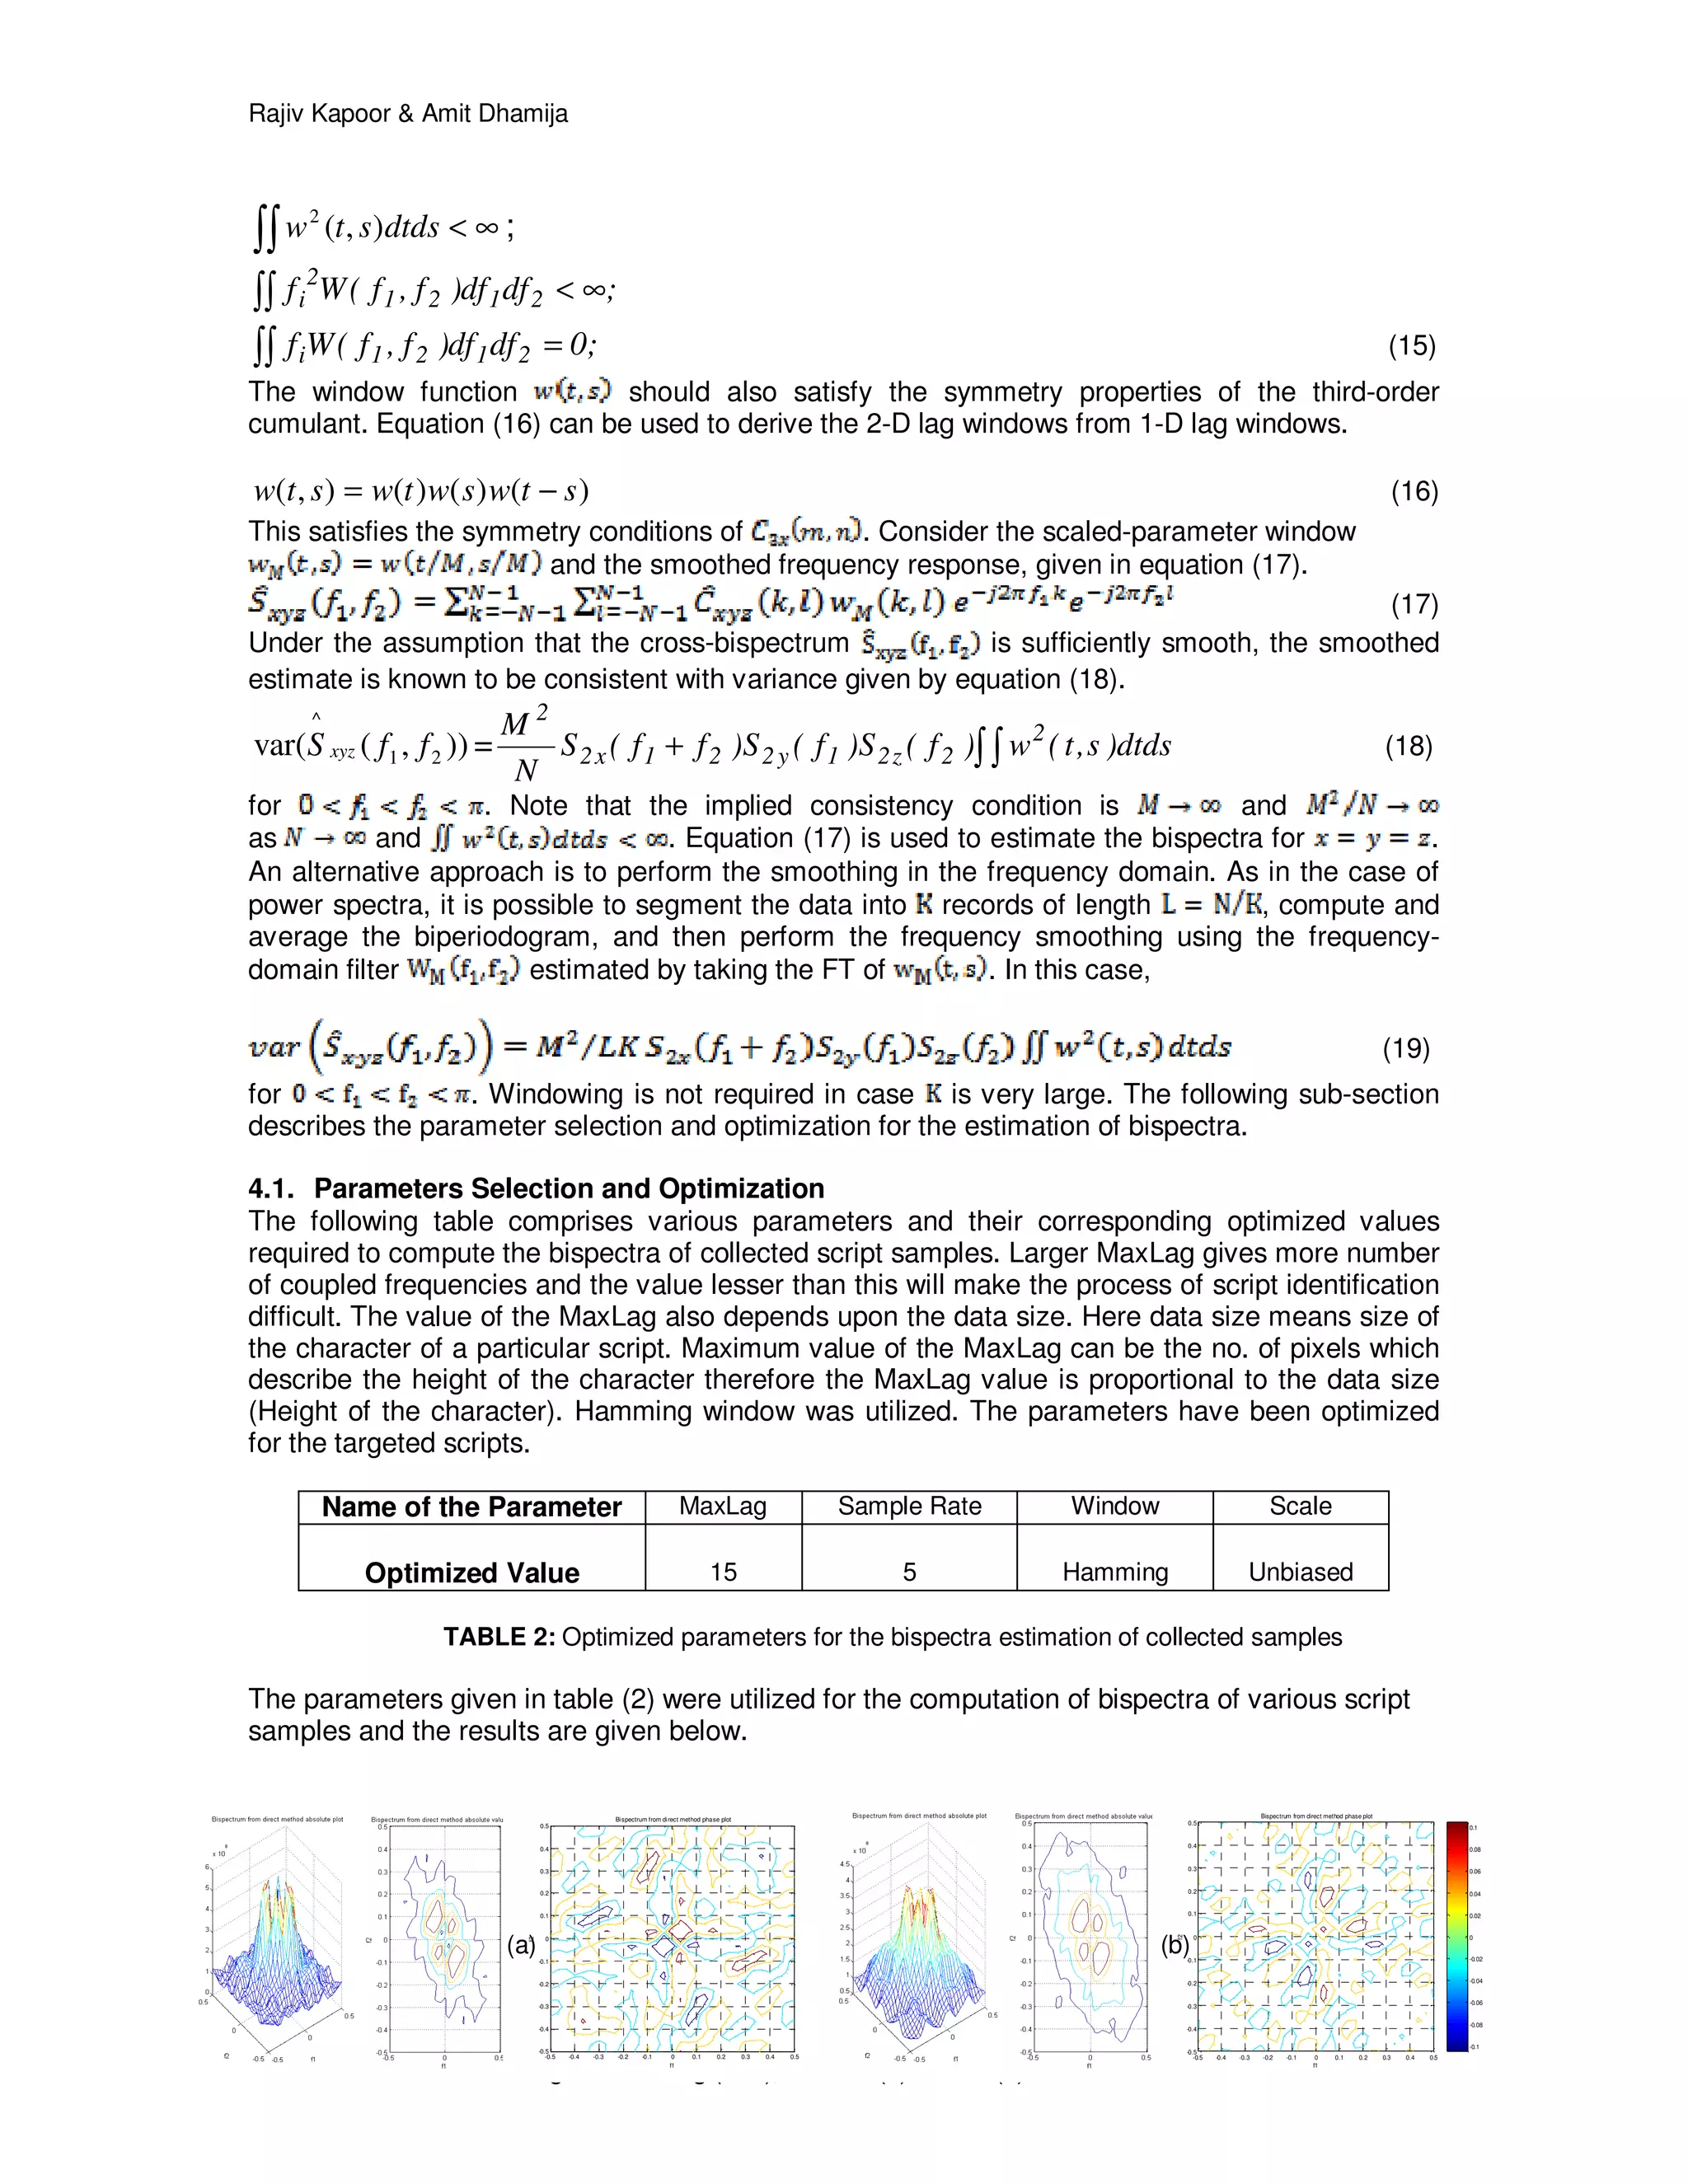
FIGURE 5: (a-e) Bispectra results (magnitude and phase) obtained for Kannada, Telugu, Assamese, Bangla
and Urdu scripts, respectively
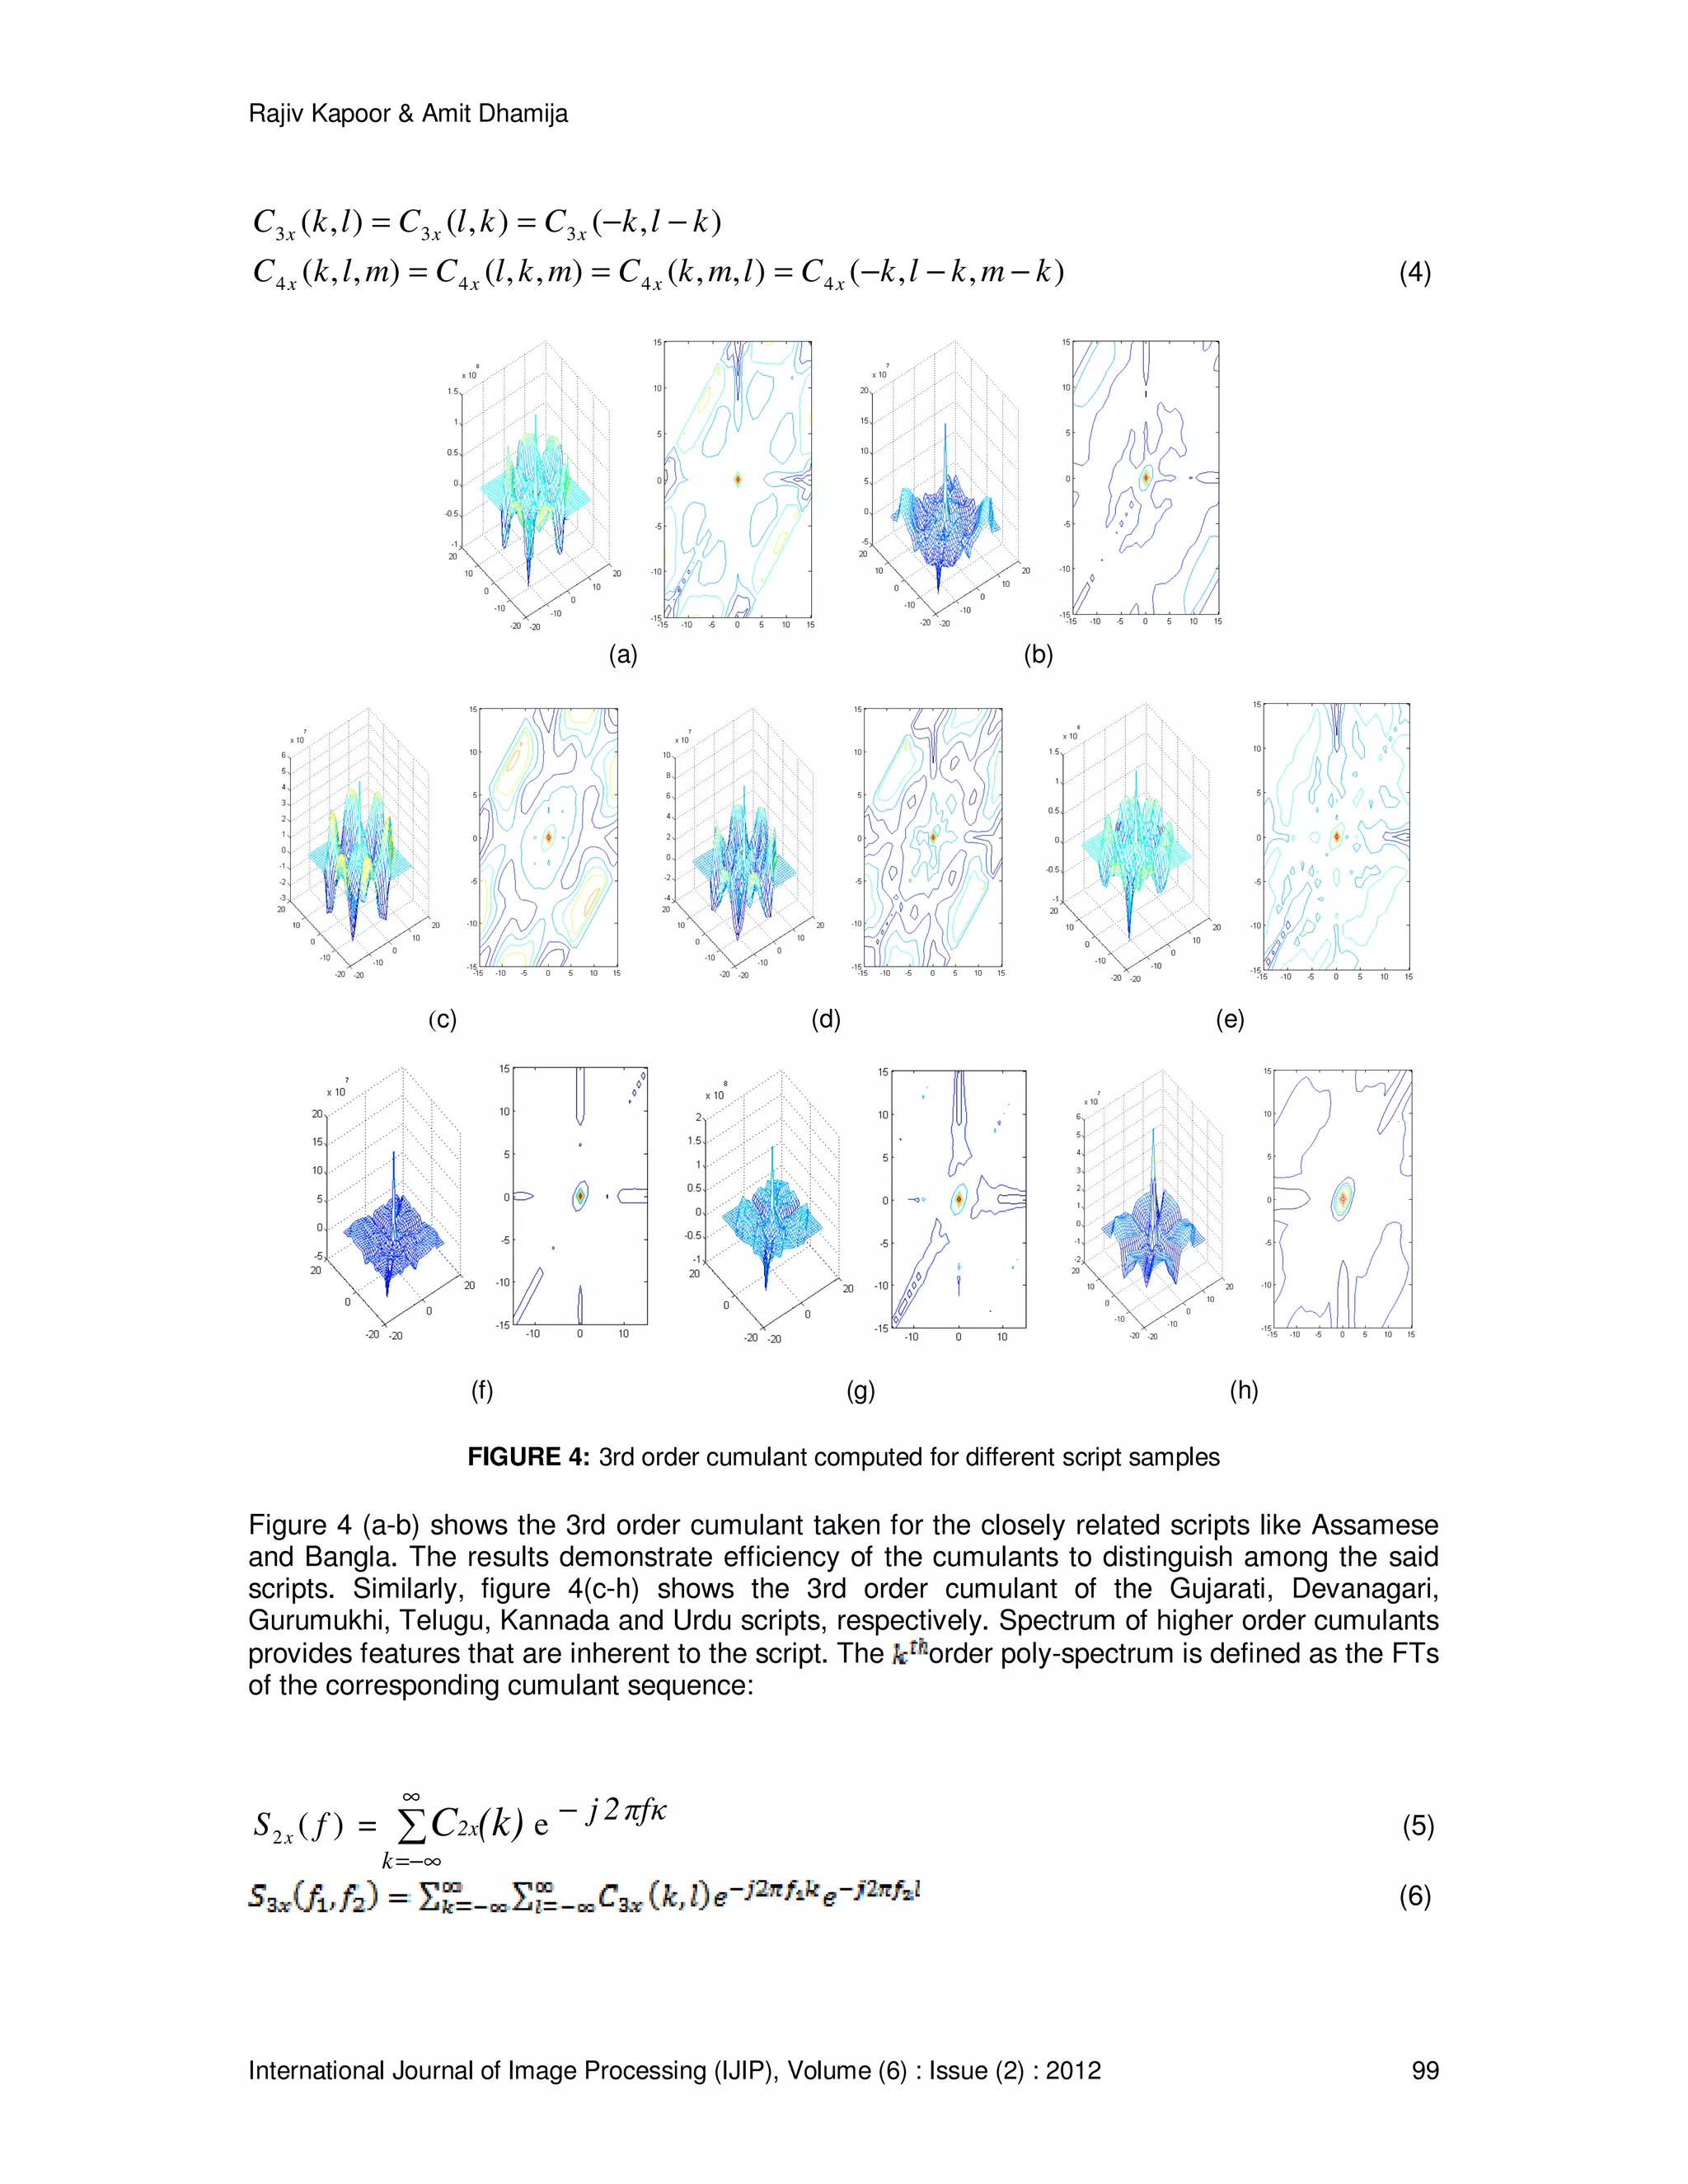
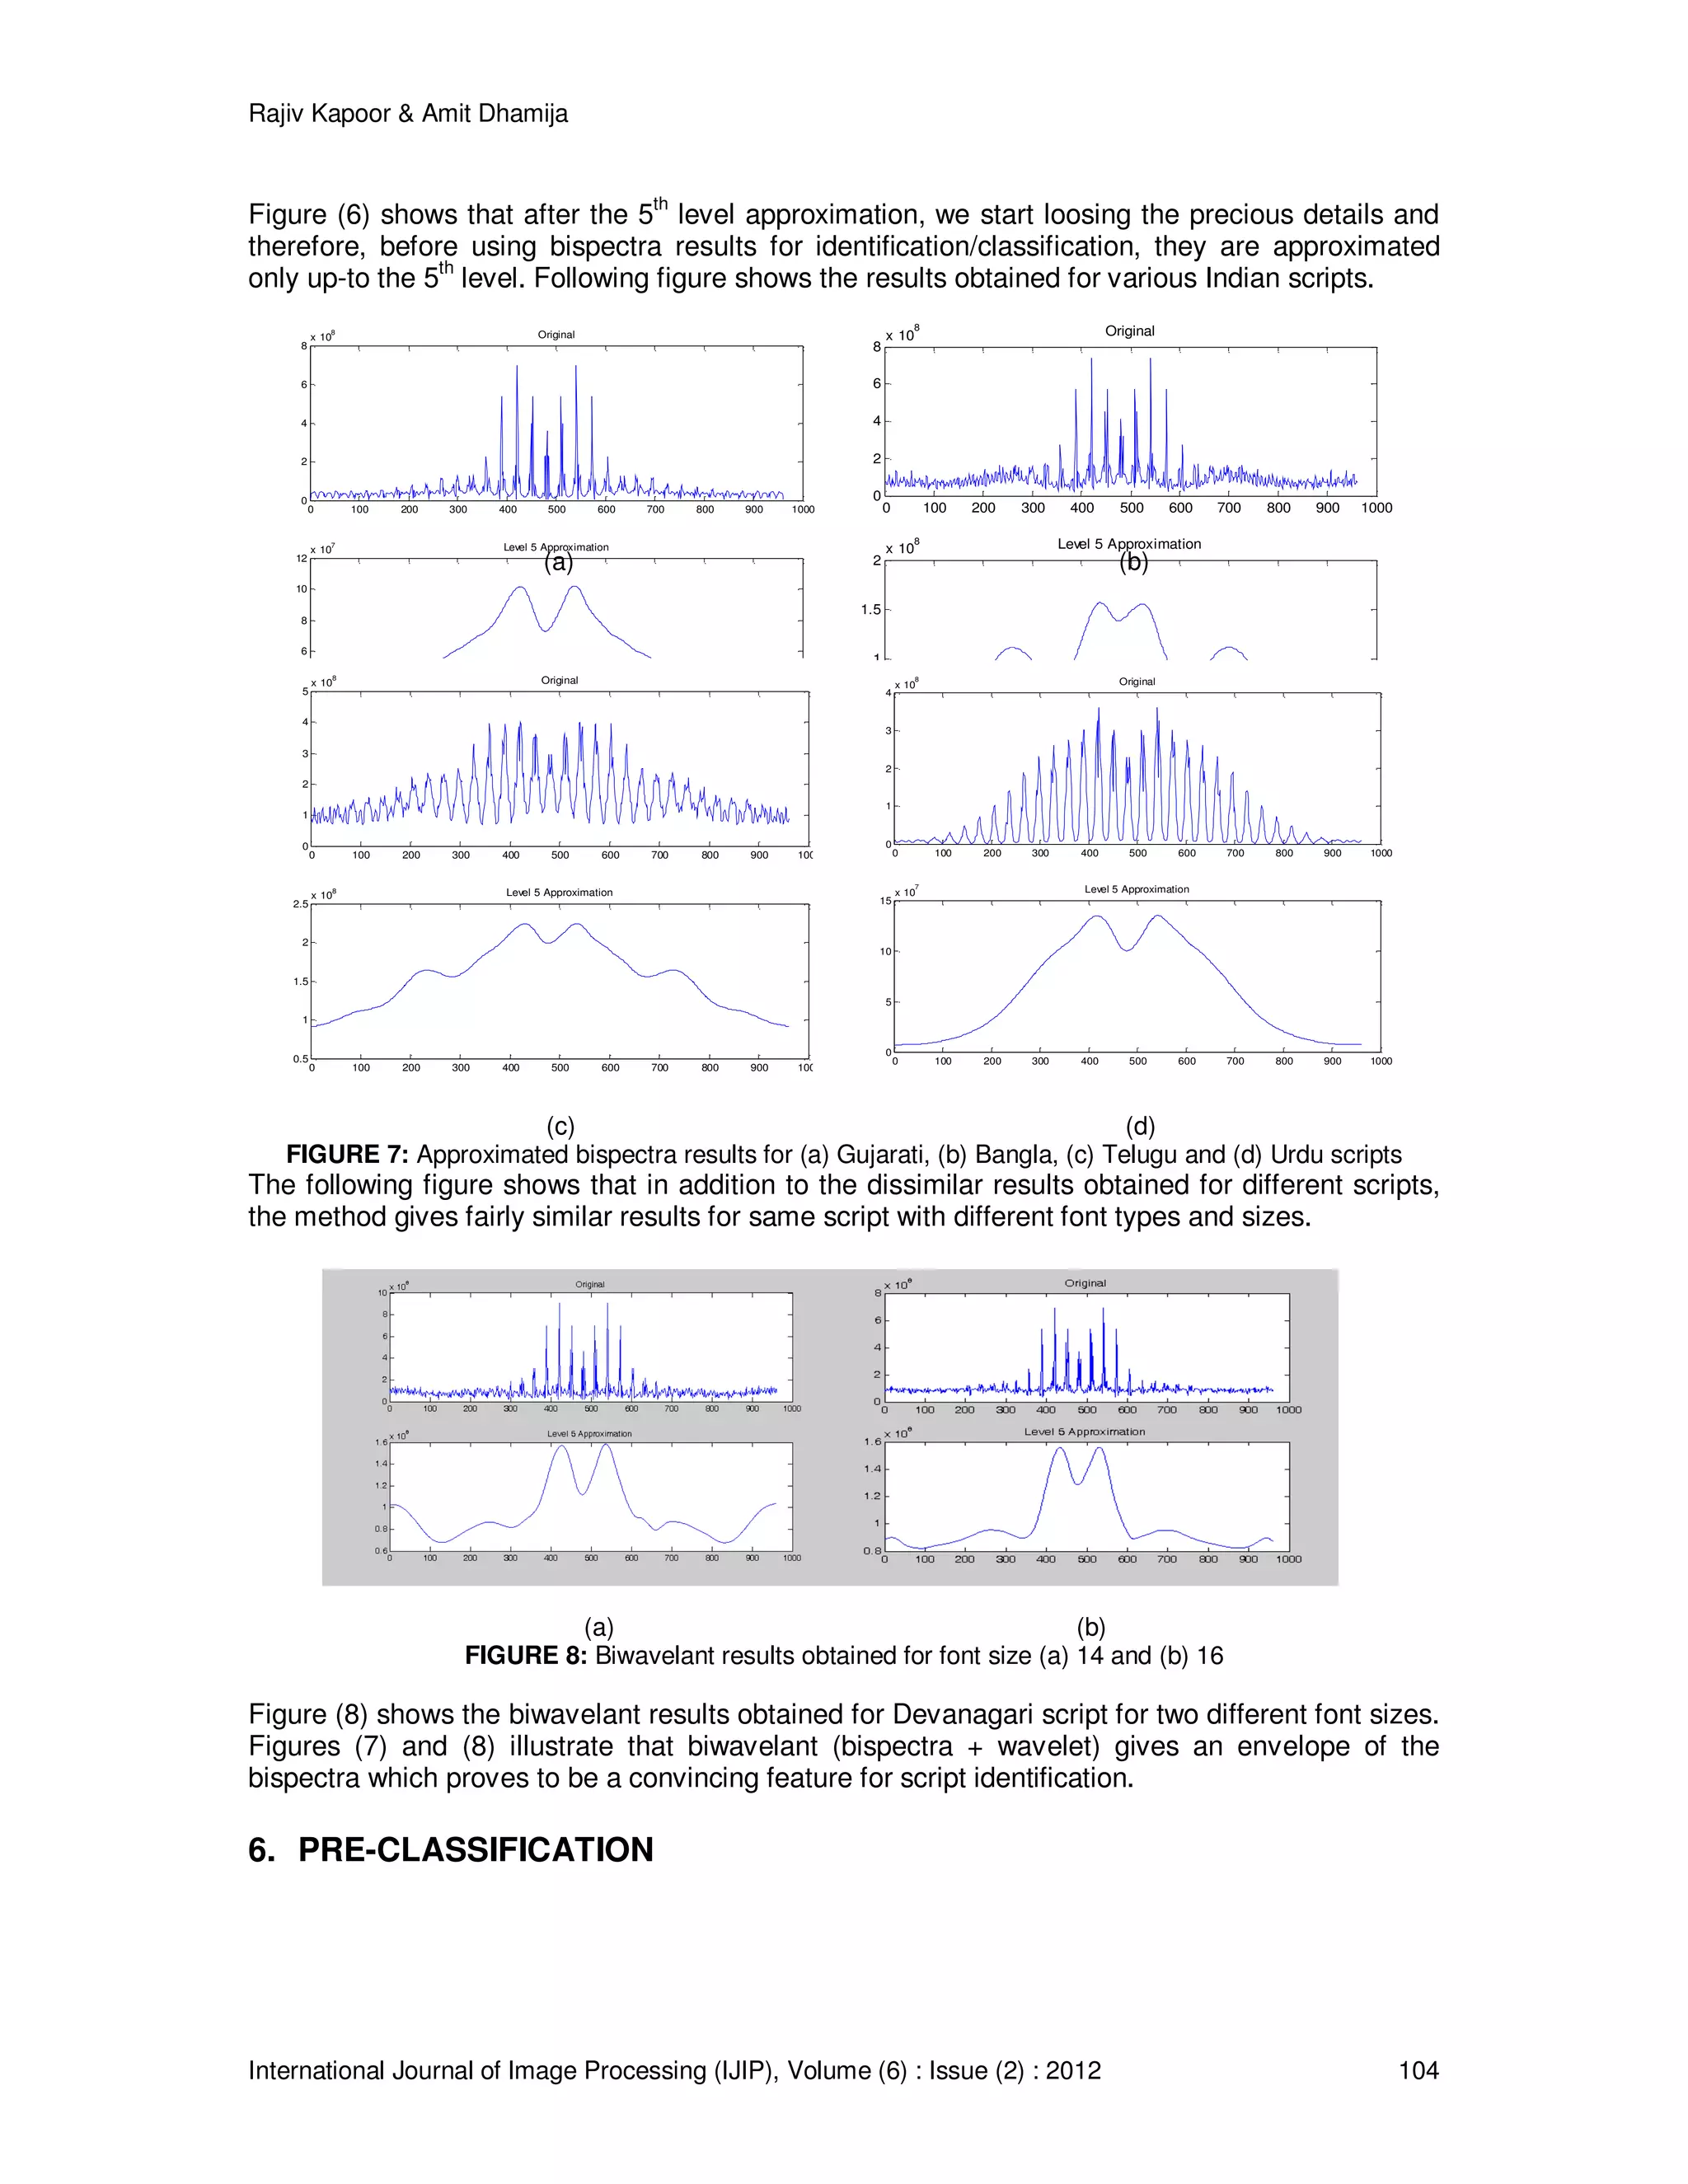
Figure (5) shows that bispectra can completely distinguish the partially similar Indian scripts.
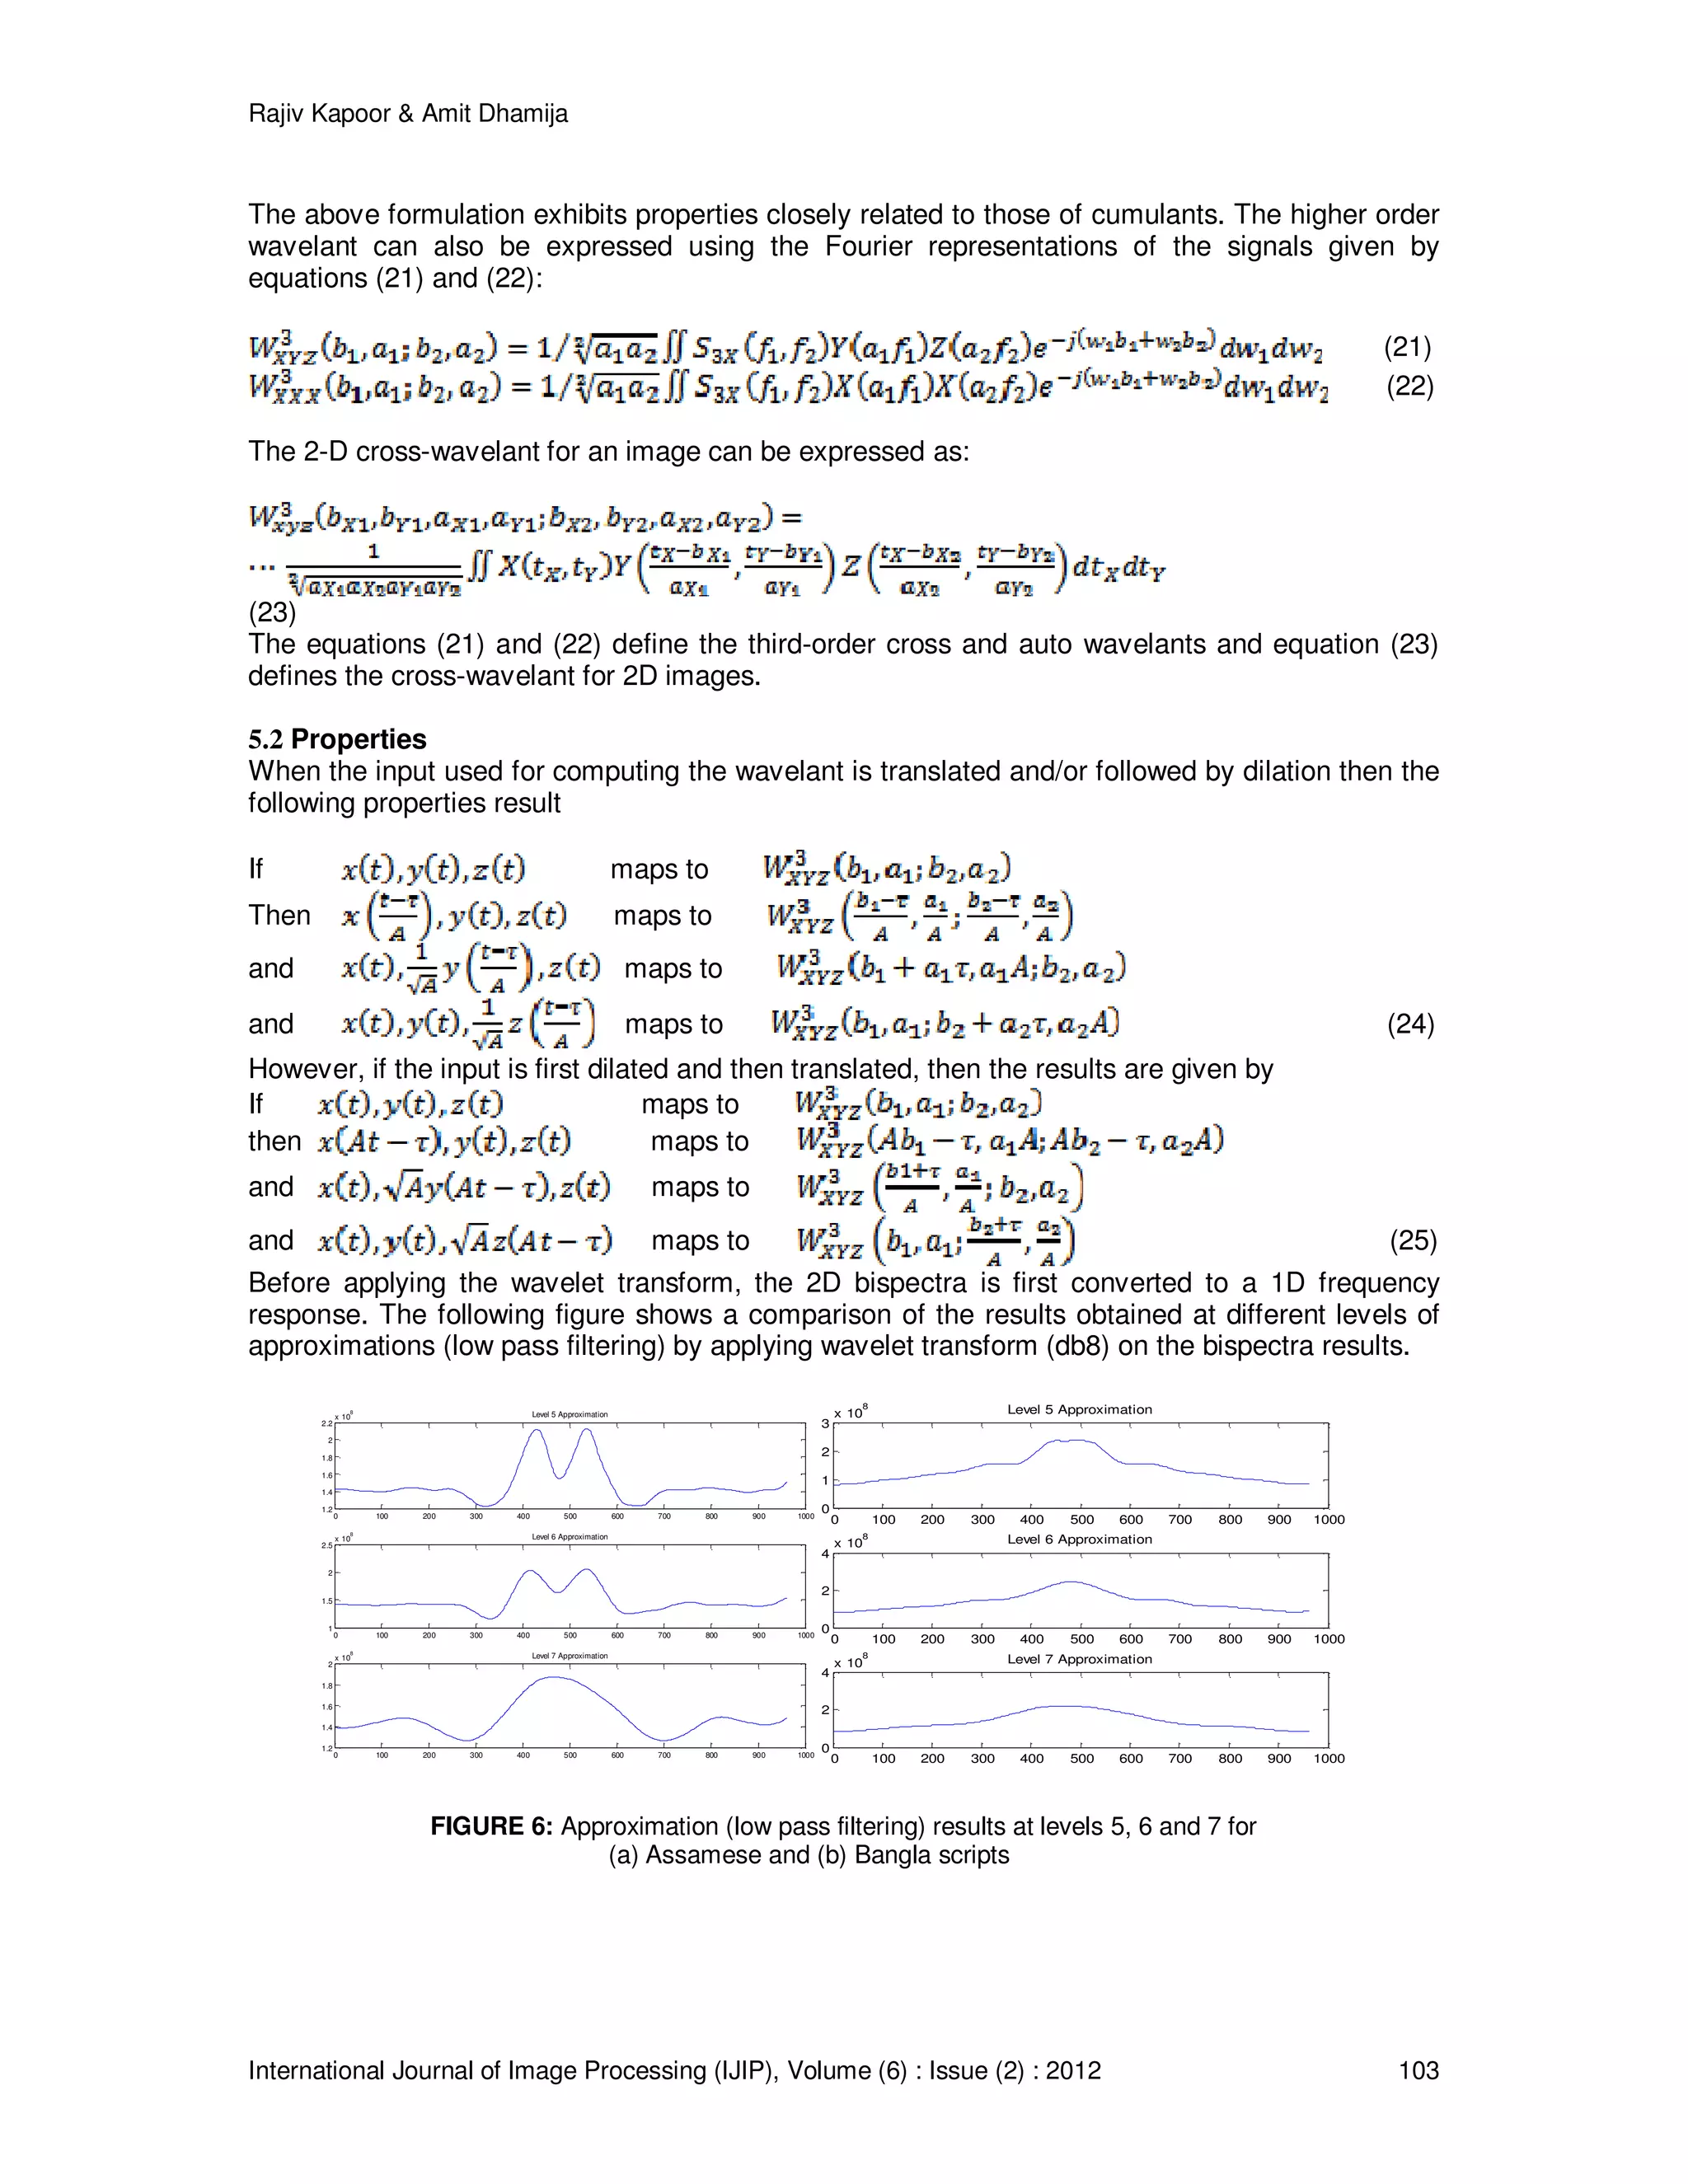
5. BIWAVELANT
As the Indian scripts are partially similar to each other, in order to identify them, the samples must
include more number of dissimilar characters. The features of individual lines are added
repeatedly to enhance the dissimilarity until it reaches to a saturation level. The experimental
results provided in figure (4) and (5) show that a sample size of 100 lines is sufficient to get the
expected results. In order to use bispectra for script identification, the redundant information (high
frequency components) is removed keeping only the prominent features (low pass information)
which is described further.
5.1 Smoothing Filter vs. Wavelet
Both smoothing filter and wavelet transform can be used to remove the high frequency
components from bispectra. But a smoothing filter can’t protect the precious details while
removing the high pass information, therefore wavelet transform is used. The wavelet transform
was introduced in [21], [22], [23] and defined as
∫
−
= dt
a
bt
ytx
a
abWxy )()(
1
),( (20)
where is the signal being transformed and is the ‘analyzing wavelet’. satisfies the
admissibility condition which is equivalent to i.e. a wavelet has zero
mean. The use of the wavelet transform as a multi-resolution analysis tool has been widespread
involving many applications such as fractal signal analysis, pitch detection and image
compression. However, Frisch [24] and Messer [25] took a different interpretation of the
continuous wavelet transform and considered it as a two parameter correlation operation where
time and dilation are the correlation parameters i.e. is considered as a received noisy signal
with known amplitude, delay and dilated factor. is the template of the known shape.
Therefore using the continuous wavelet transform and an appropriate decision statistic, the
detection can be made for a signal buried in Gaussian noise. This interpretation will be later used
in the use of wavelants. Two important properties of the cumulants are:
1. The third order cumulant for a Gaussian (or any symmetrically distributed) random process is
zero.
2. If a subset of random variables is independent of the rest, then the third-order cumulant
is zero.](https://image.slidesharecdn.com/ijip-519-151230144954/75/A-New-Method-for-Identification-of-Partially-Similar-Indian-Scripts-9-2048.jpg)
![Rajiv Kapoor & Amit Dhamija
International Journal of Image Processing (IJIP), Volume (6) : Issue (2) : 2012 110
FIGURE 14: Samples of Devanagari script with different font types and sizes
The comparison of identification results obtained with various classifiers mentioned in the
previous section is given in table (9).
Sr. No. Classifier Type Classification Accuracy (%)
1 Bayes Quadratic 90
2 Decision Layer 91
3 Nearest Neighbour Classifier 87
4 Multi Layer Perceptron 94
5 Support Vector Machine 95
TABLE 9: Classification accuracy with various classifiers
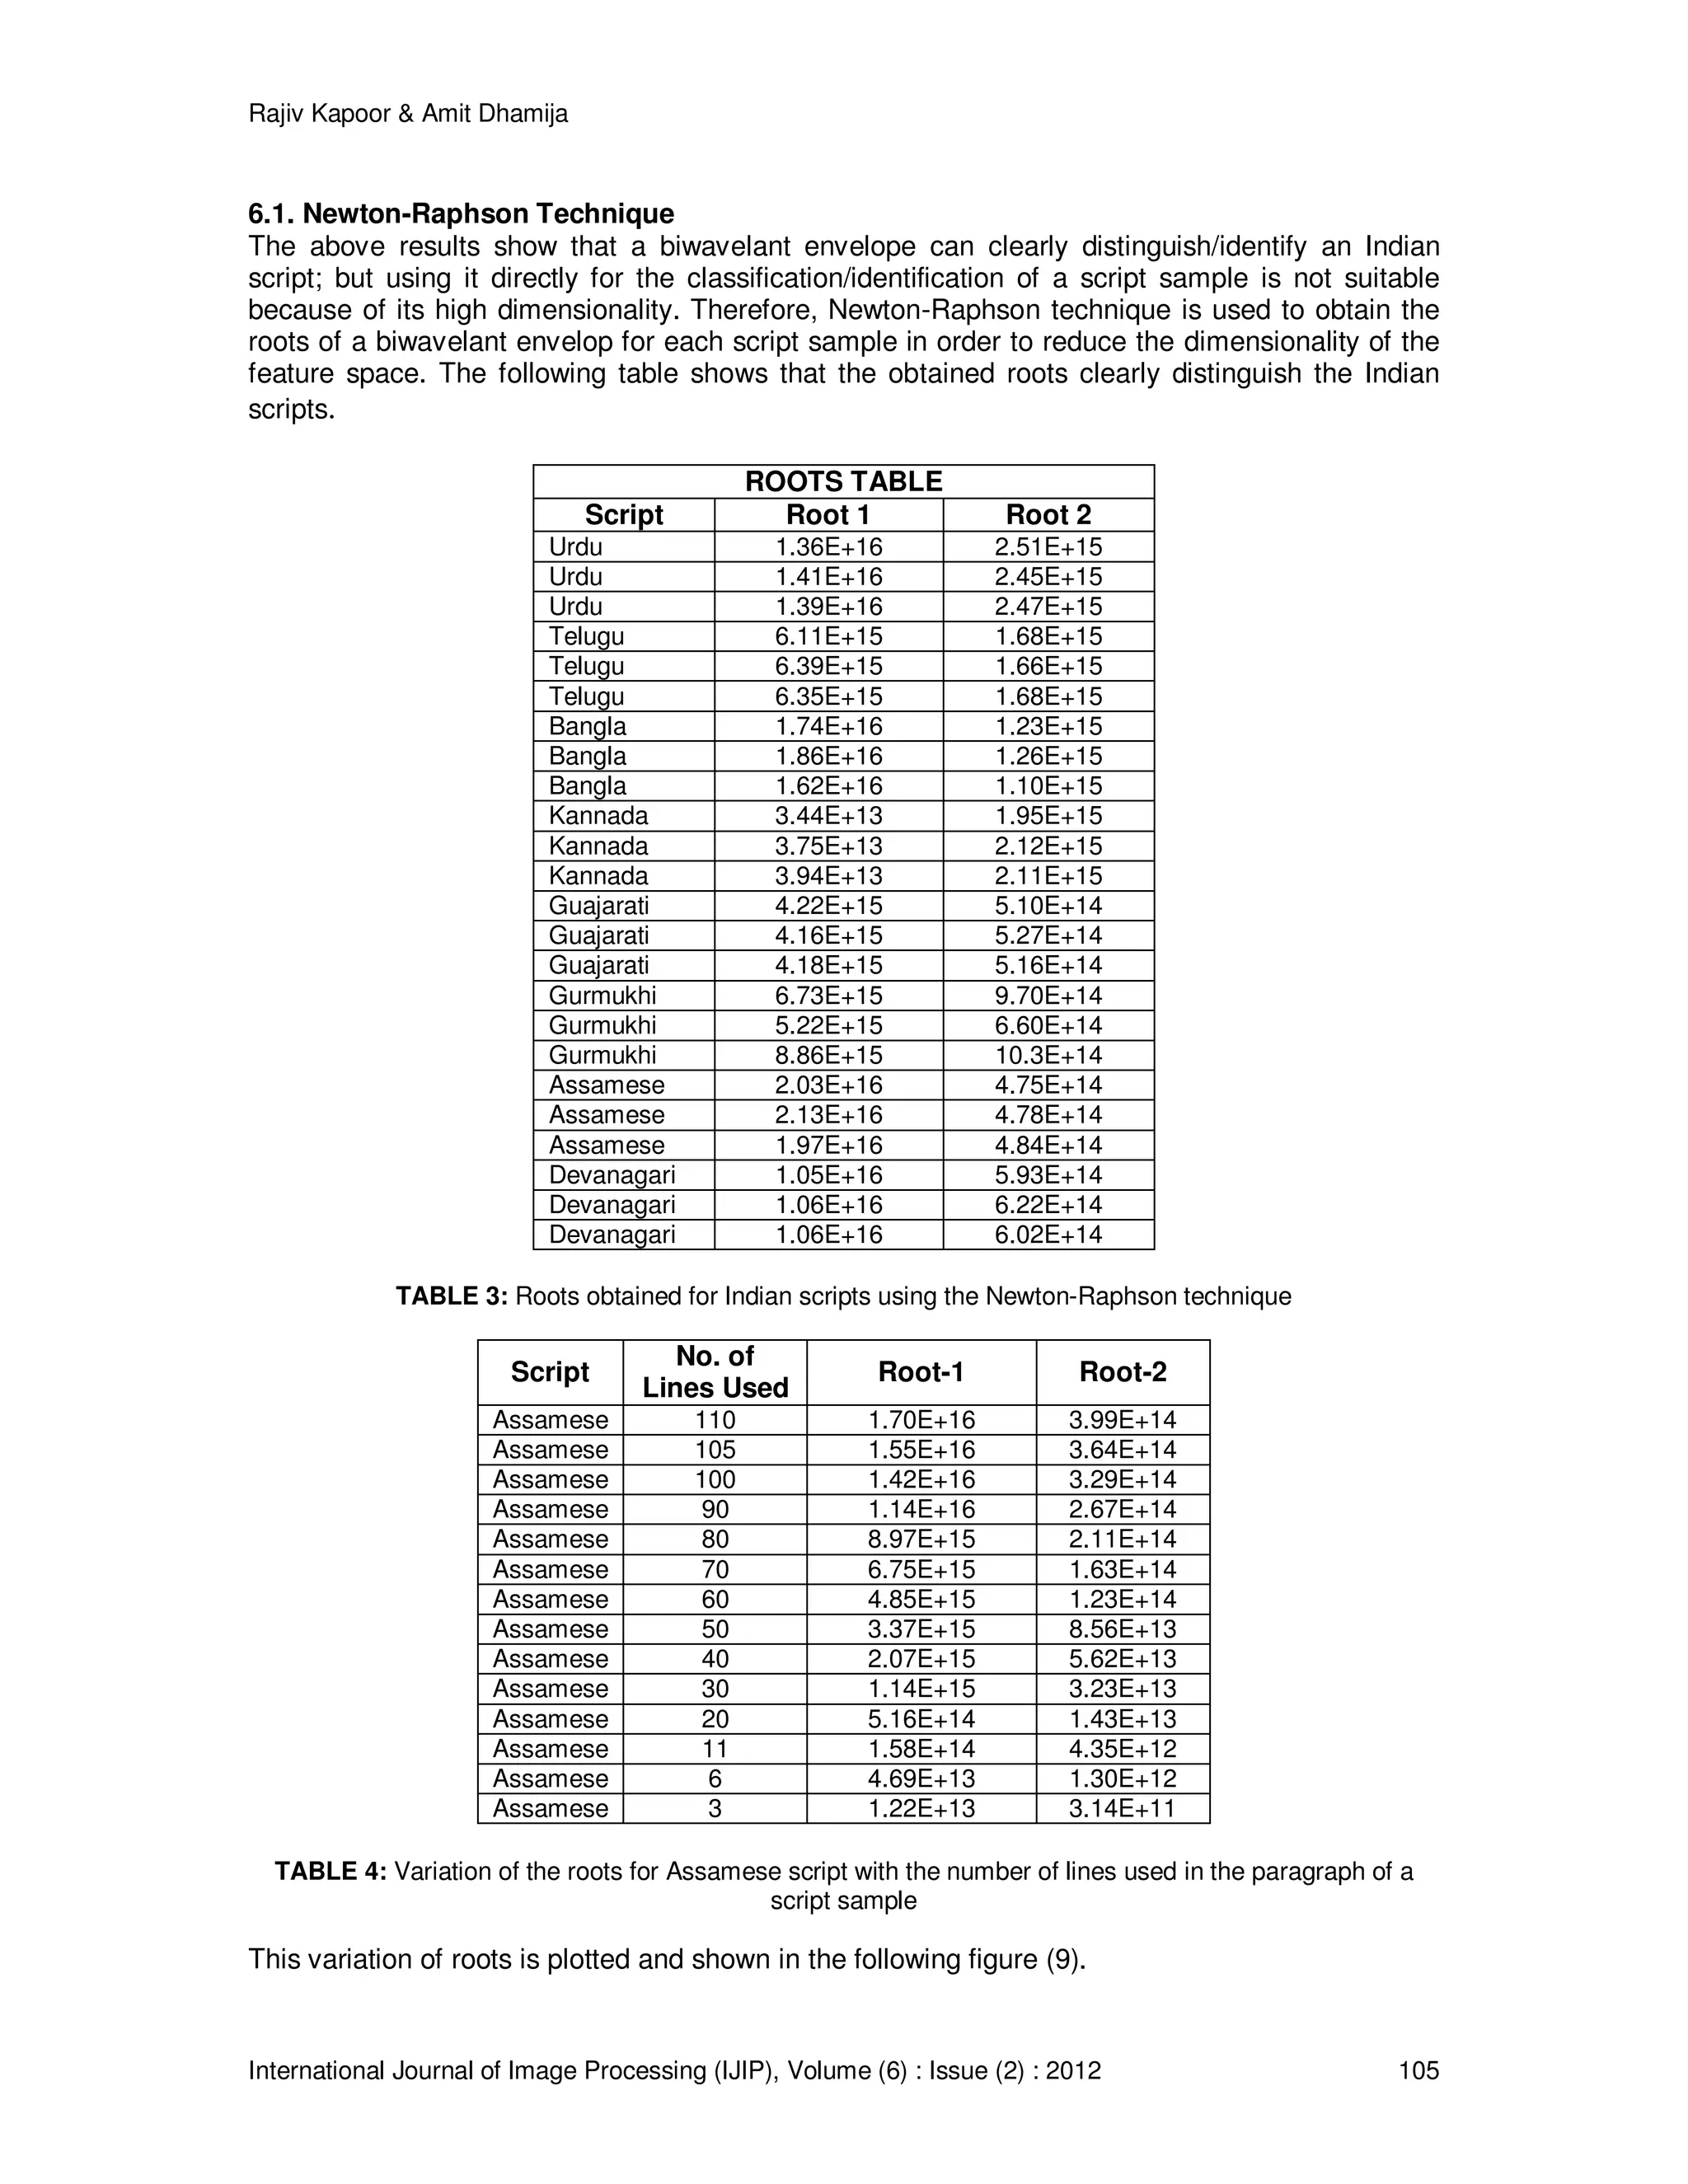
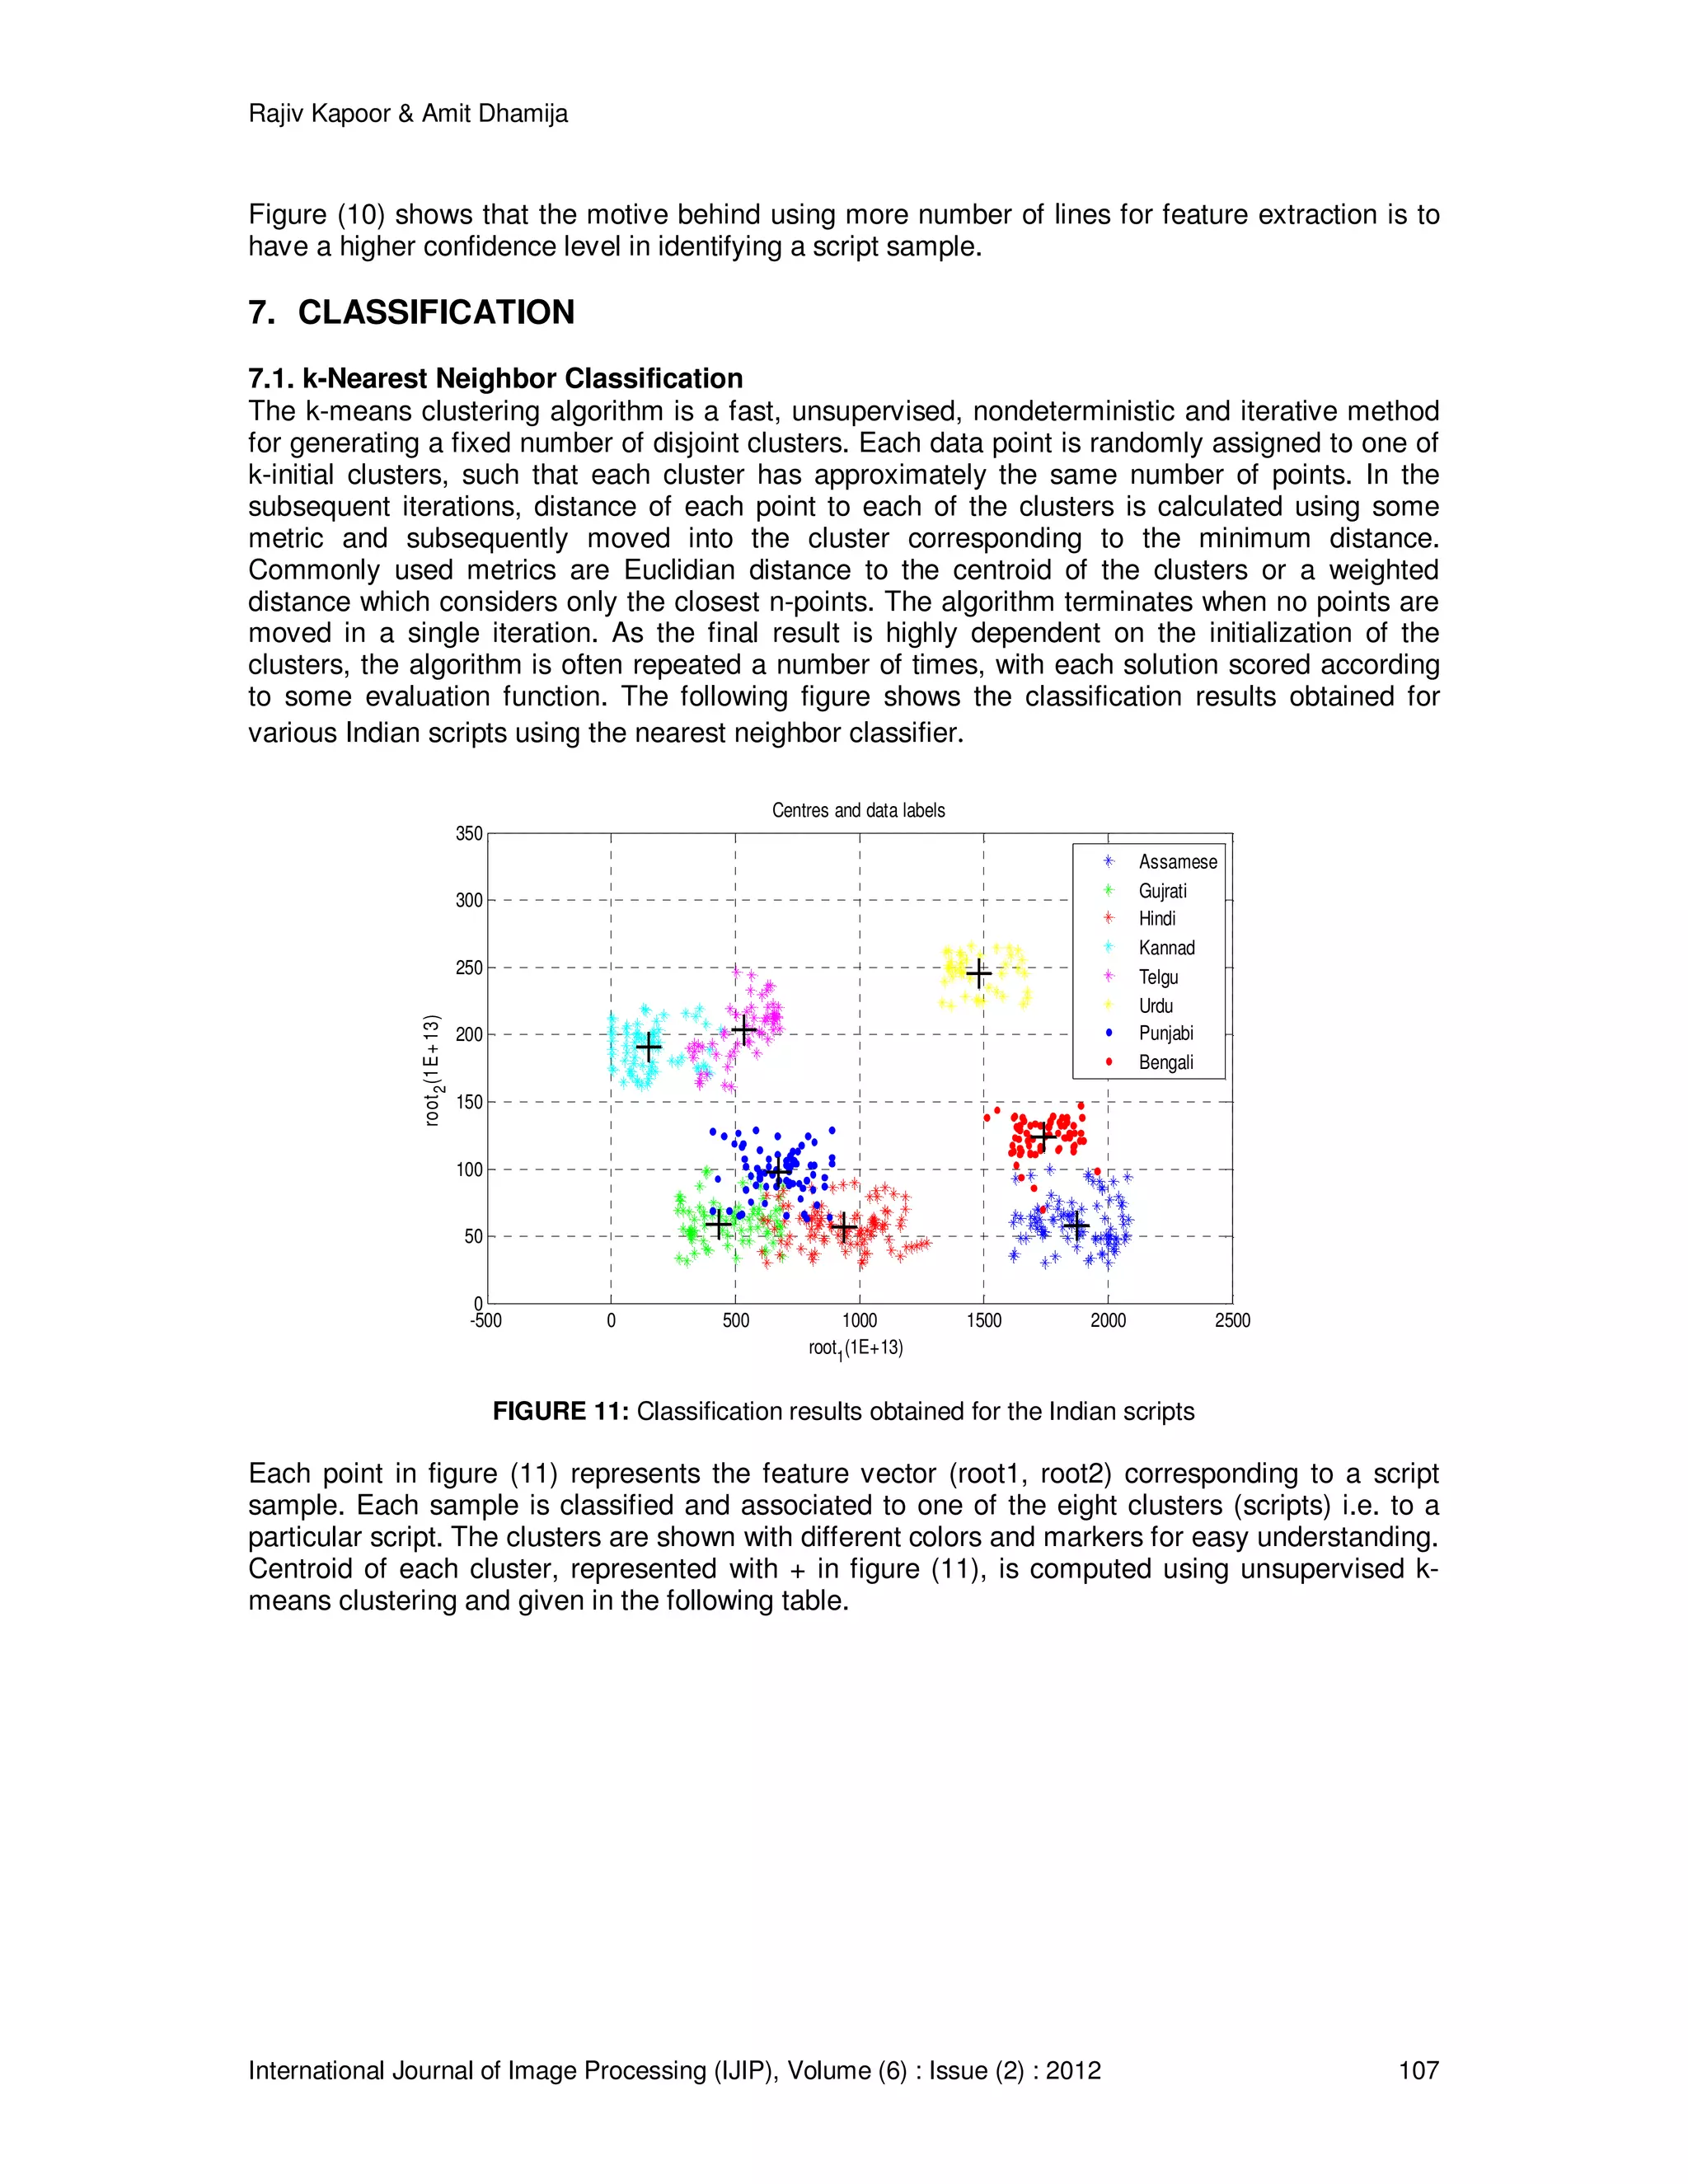
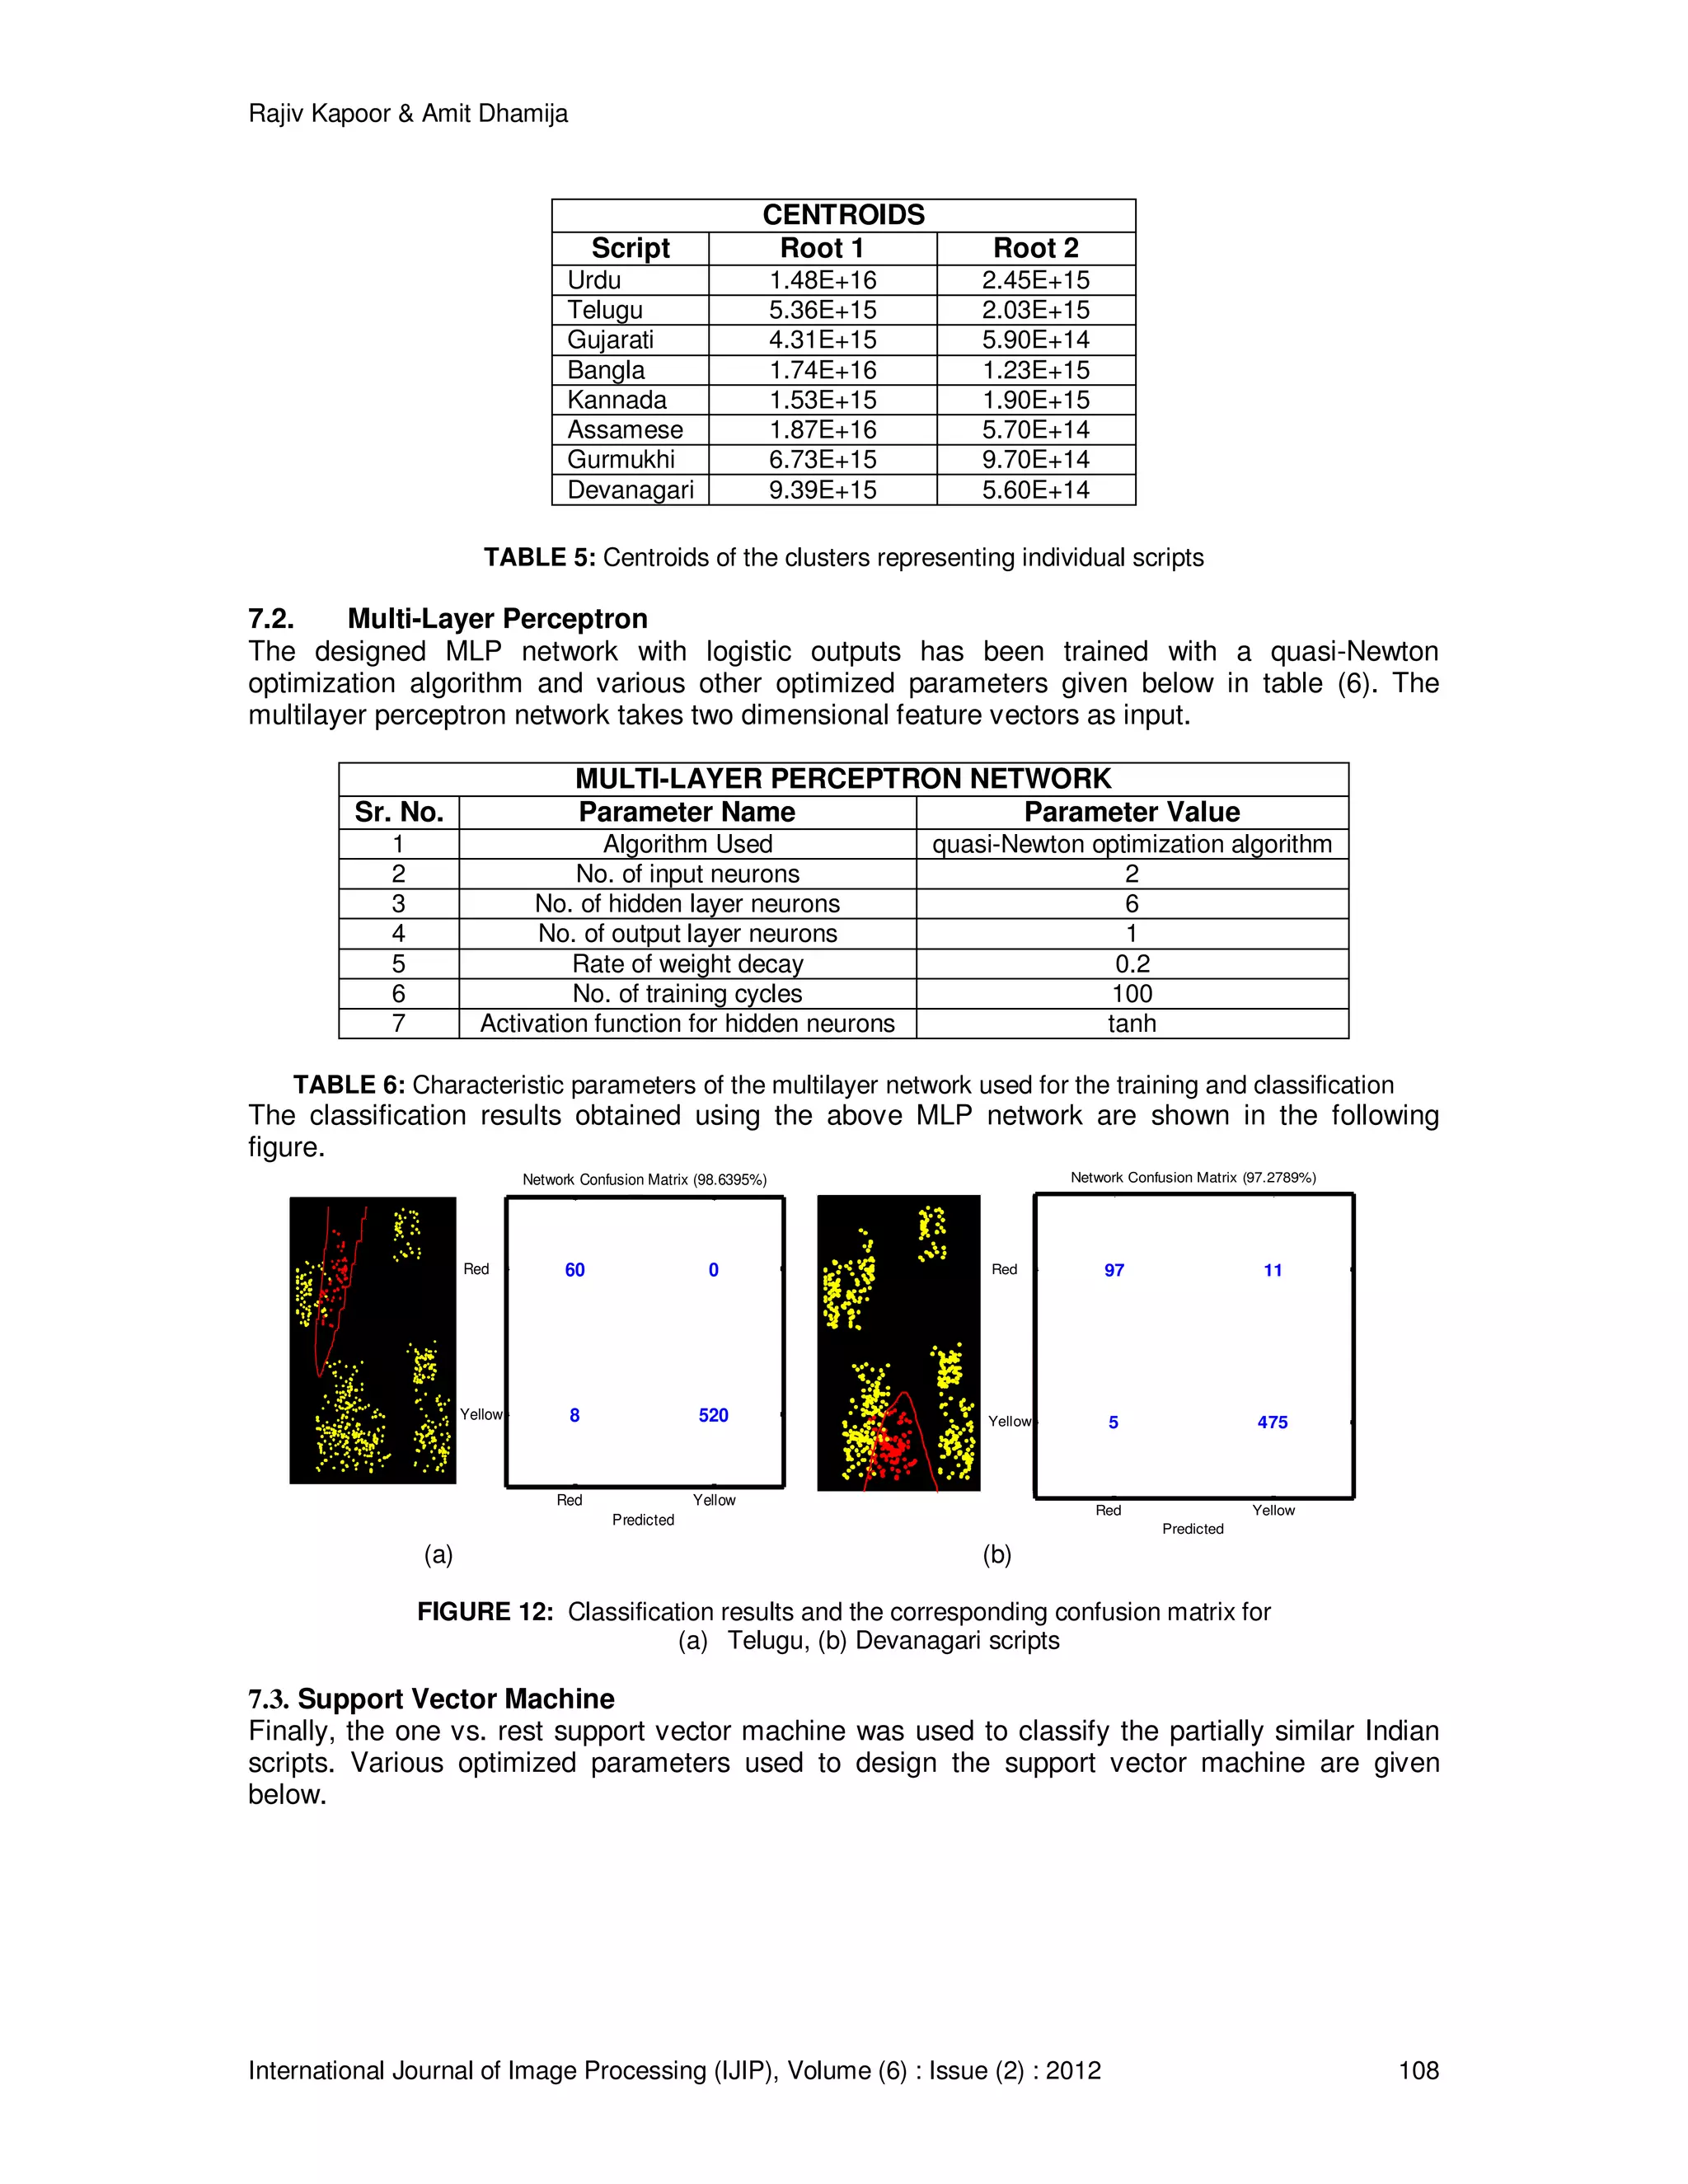
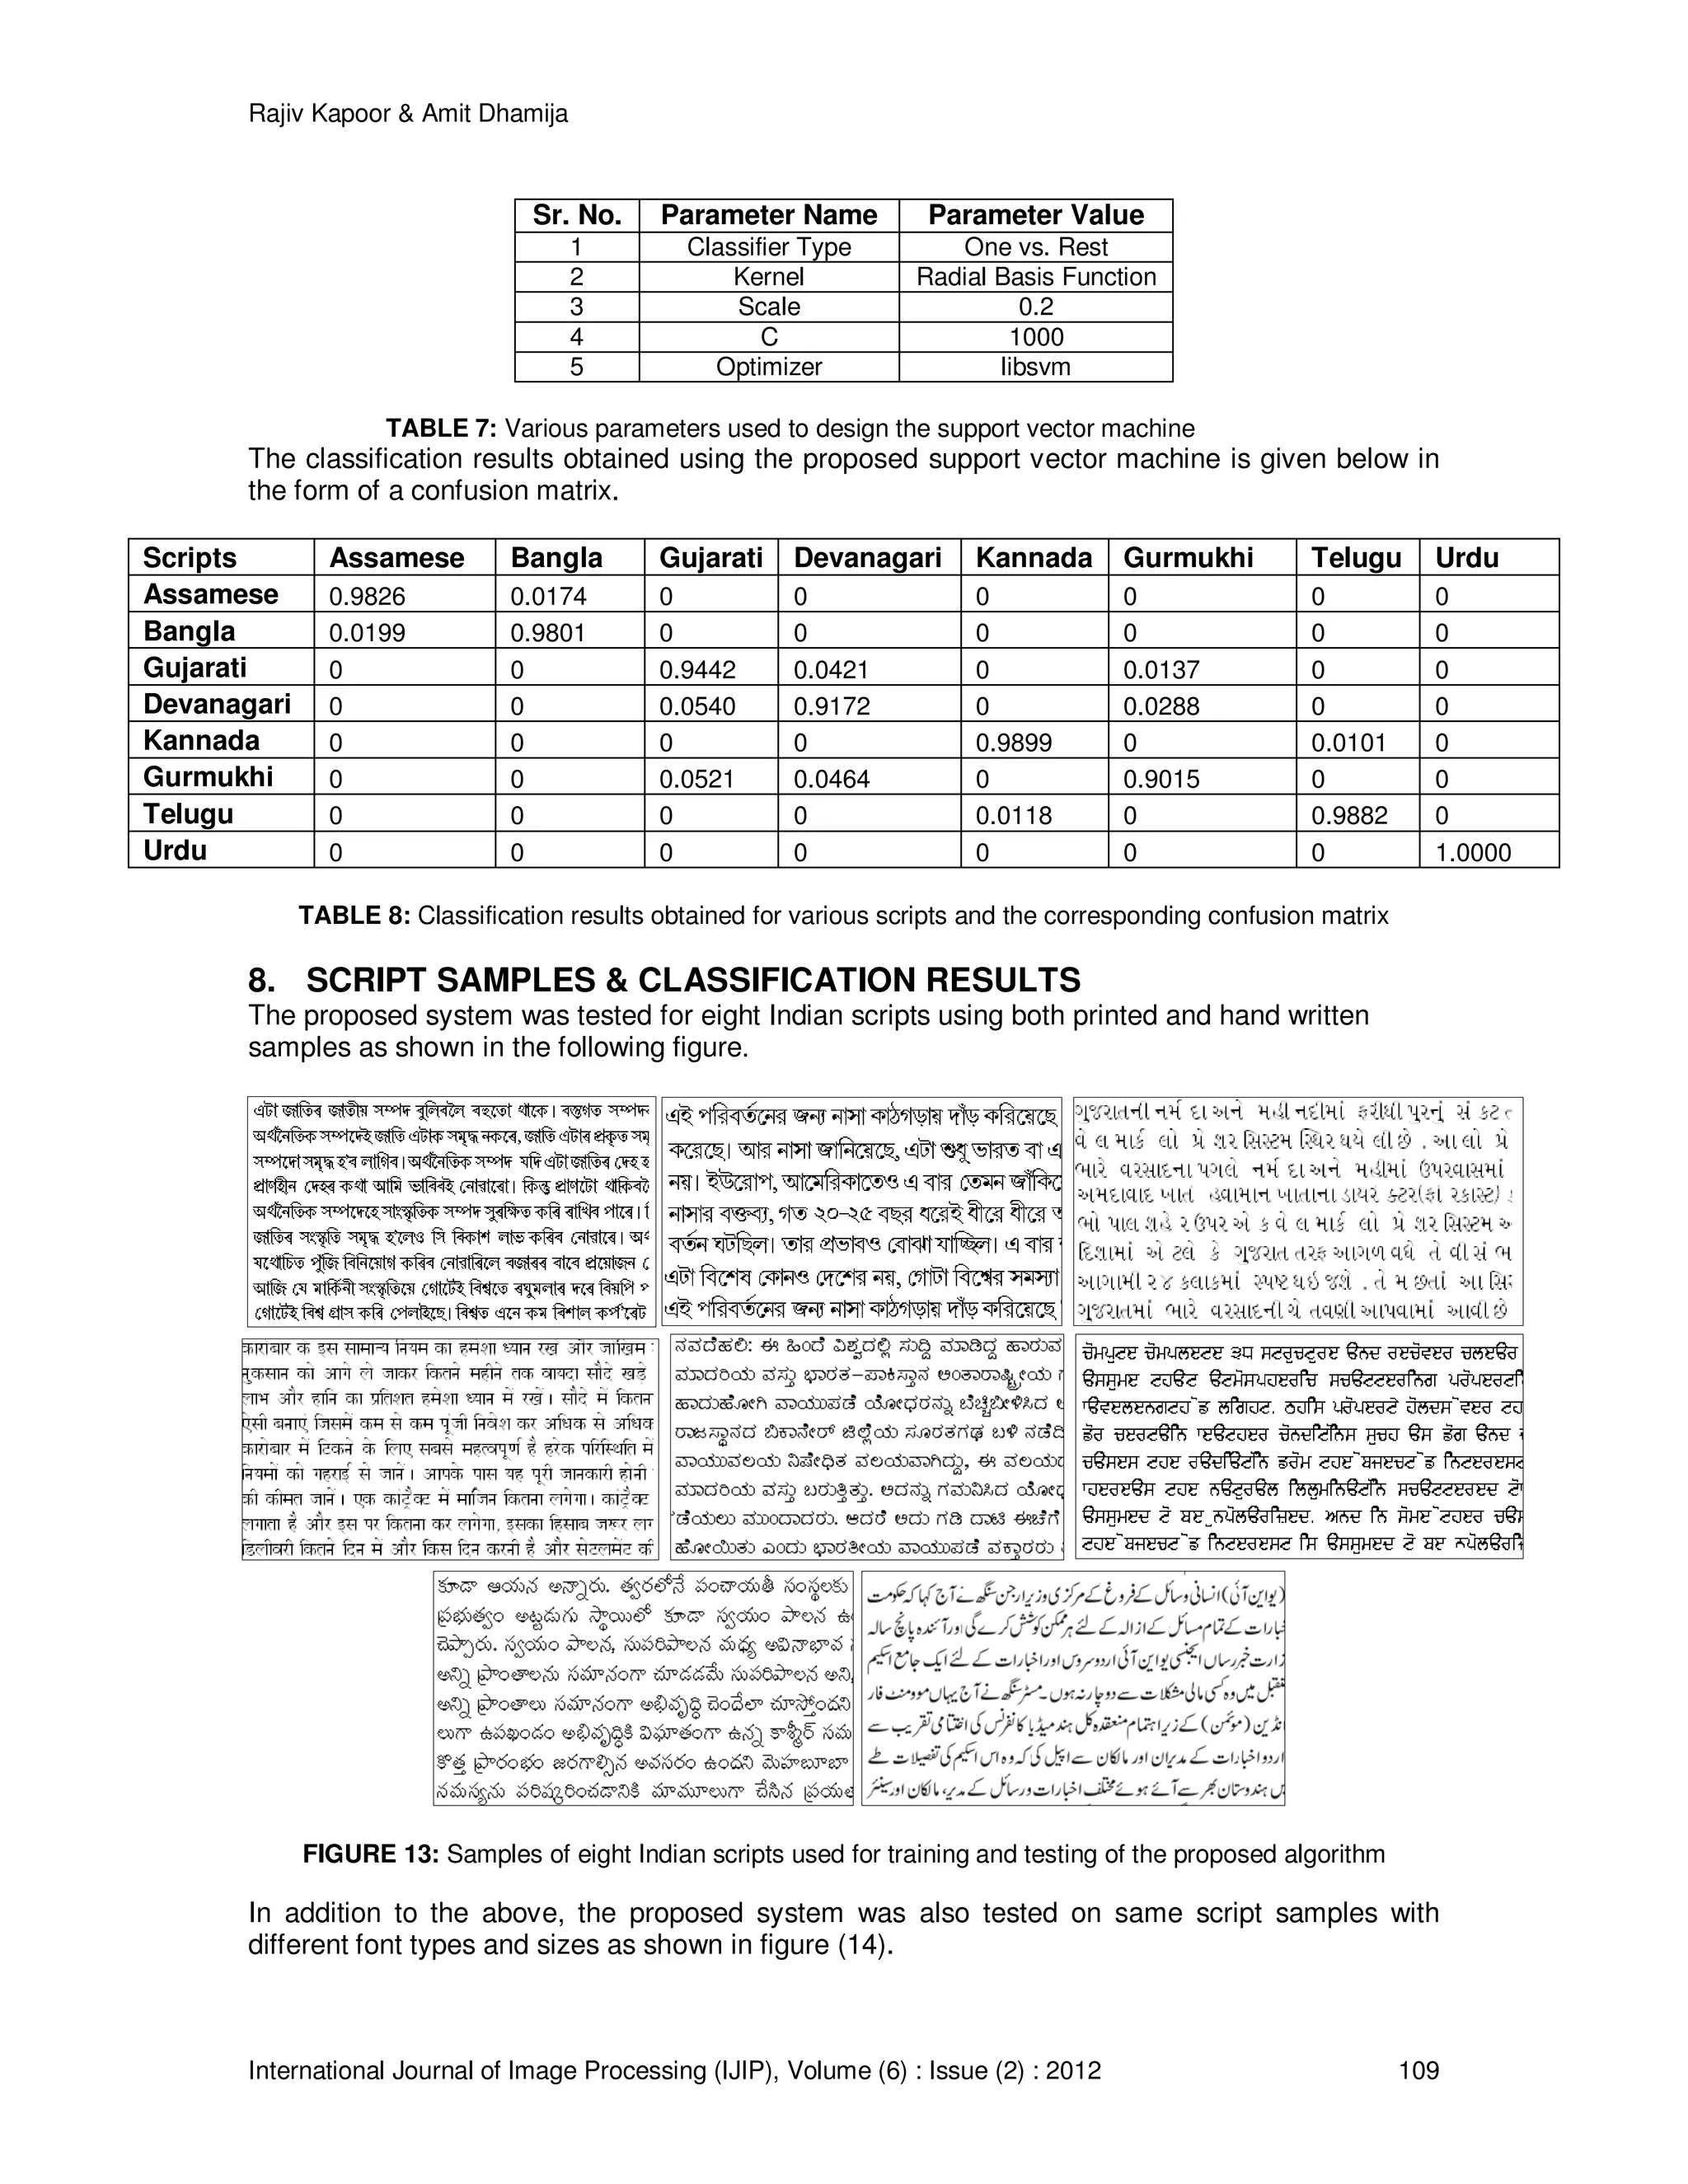
9. CONCLUSION
The method has successfully identified eight Indian scripts and is expected to work for scripts
from other nations also. Indian scripts are closely related to each other and as the proposed
technique is sensitive to the structural changes in the script, it is able to distinguish them
successfully. But, the same sensitivity makes the method vulnerable to noise in the samples, so
the document has to be noise free for expected results. However, the pre-processing becomes
very complex for the removal of noise from the samples. The features of individual lines were
added until they reach to a saturation level. This saturation level in turn helped in determining the
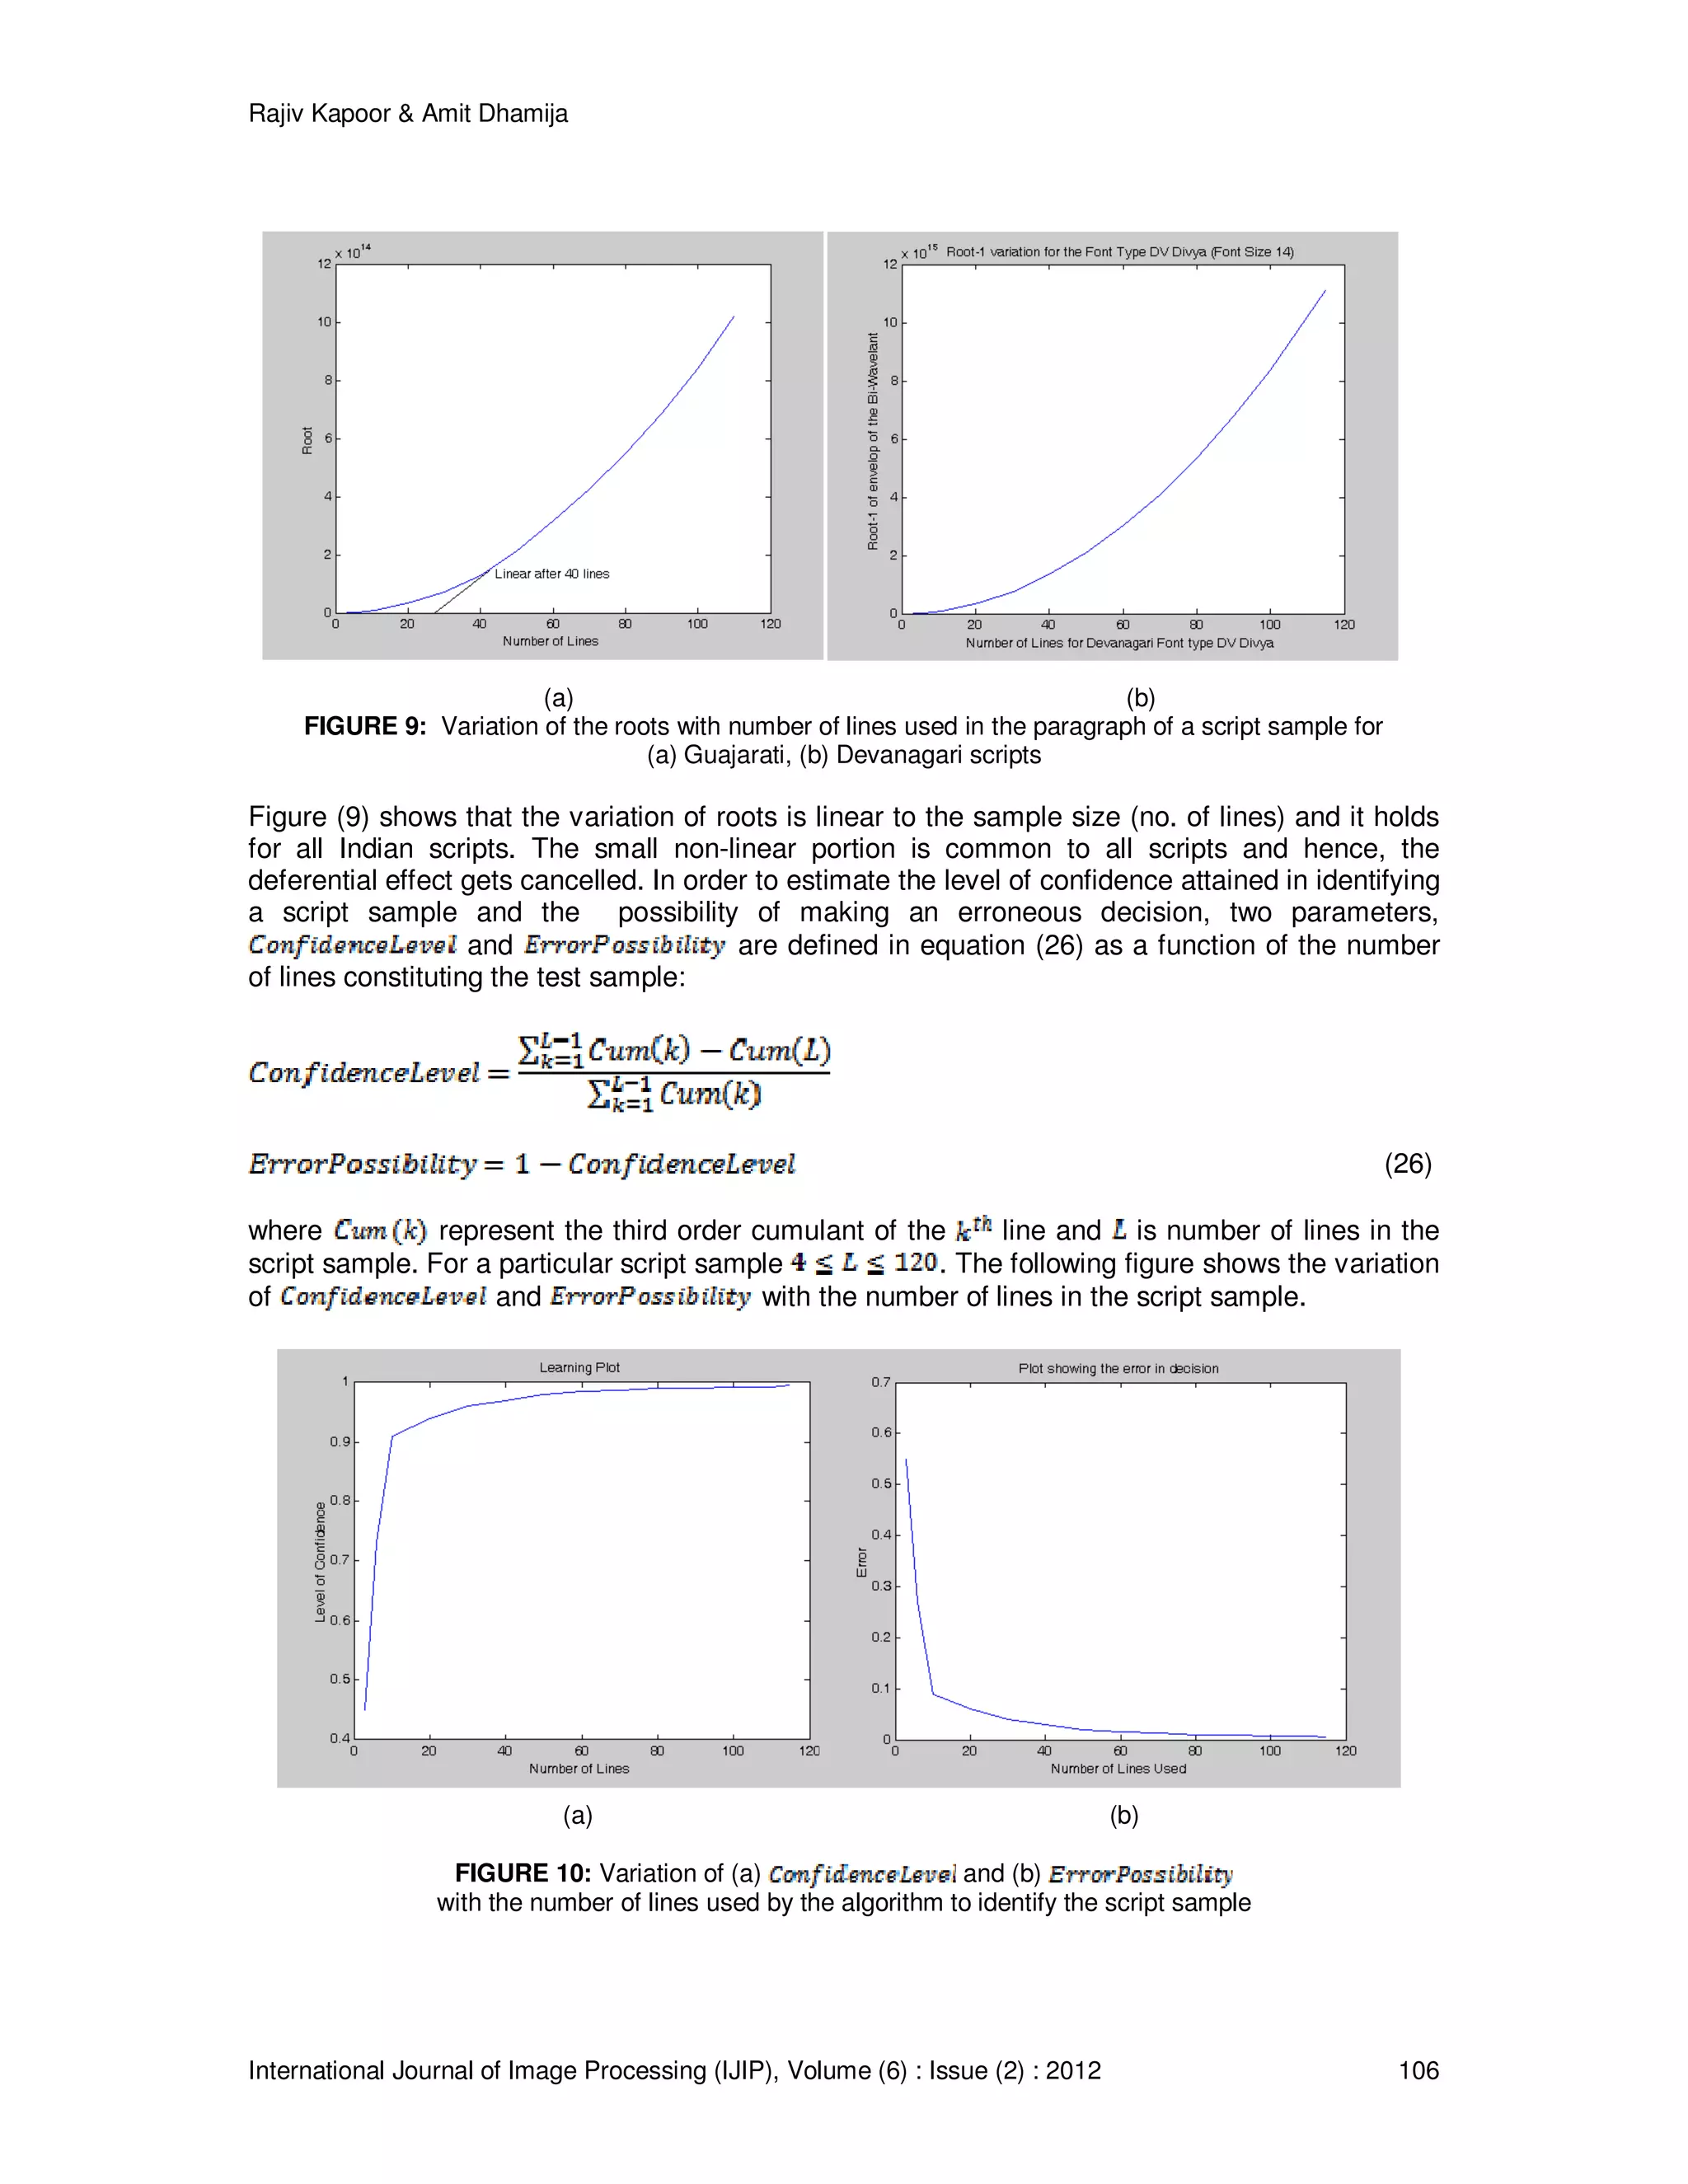
confidence level for indentifying a sample. The variation in confidence level with the number of
lines in the sample was used to determine an optimum number of lines required in identifying a
script. A sample size of 100 lines gives the best result as it considers most of the features in the
script. The method works well for both the printed and hand written samples of the scripts,
independently. However, it does not work for the sample with a mixture of printed and hand-
written lines of a script. Pre-processing of hand-written scripts also adds to the complexity of the
method. In such a case of mixed characters, cumulants are not useful as being very sensitive to
the curvatures. Indian scripts are partially similar to each other. Because of the partial similarity,
we first consolidated on the number of words which enhances the partial dissimilarity and makes
it look significant. Then we used the method which is very sensitive to the curvatures and the
results were as expected.
REFERENCES
[1] S. B. Patil and N. V. Subbareddy, “Neural network based system for script identification in
Indian documents”, SADHNA, vol. 27, pp. 82-97, Feb. 2002.
[2] J. Hochberg, P. Kelly, T. Thomas and L. Kerns, “Automatic script identification from
document images using cluster-based templates”, IEEE Transactions on Pattern Analysis
and Machine Intelligence, vol. 19 (2), pp.176-181, Feb. 1997.
[3] D. Dhanaya, A. G. Ramakrishnan and P. B. Pati, “Script identification in printed bilingual
documents”, SADHNA, vol. 27, pp. 73-82, Feb. 2002.](https://image.slidesharecdn.com/ijip-519-151230144954/75/A-New-Method-for-Identification-of-Partially-Similar-Indian-Scripts-17-2048.jpg)
![Rajiv Kapoor & Amit Dhamija
International Journal of Image Processing (IJIP), Volume (6) : Issue (2) : 2012 111
[4] B. B. Chaudhuri and U. Pal, “Skew angle detection of digitized Indian script documents”,
IEEE Transactions on Pattern Analysis and Machine Intelligence, vol. 19 (2), pp.182-186,
Feb. 1997.
[5] S. Chaudhuri and R. Sheth, “Trainable script identification strategies for Indian languages”,
International Conference on Document Analysis and Recognition, pp. 657-660, Sep. 1999.
[6] U. Pal and B. B. Chaudhuri, “Script line separation from Indian multi-script documents”,
International Conference on Document Analysis and Recognition, pp. 406-409, Sep. 1999.
[7] A. Spitz, “Determination of the script and language content of document images”, IEEE
Transactions on Pattern Analysis and Machine Intelligence, vol.19 (3), pp. 235-245, 1997.
[8] T. N. Tan, “Rotation invariant texture features and their use in automatic script
identification”, IEEE Transactions on Pattern Analysis and Machine Intelligence, vol. 20 (7),
pp. 751-756, Jul. 1998.
[9] J. Hochberg, K. Bowers, M. Cannon and P. Kelly, “Script and language identification for
handwritten document images”, International Journal on Document Analysis and
Recognition, vol. 2, pp. 45-52, Feb. 1999.
[10] S. H. Srinivasan, K. R. Ramakrishnan and S. Budhlakoti, “Character decomposition”, Indian
Conference on Vision Graphics and Image Processing at ISRO Ahmedabad, 2002.
[11] V. Bansal and R. M. K. Sinha, “On how to describe shapes of Devanagari characters and
use them for recognition”, International Conference on Document Analysis and
Recognition, pp. 410-413, Sep. 1999.
[12] S. Antani and L. Agnihotri, “Gujarati character recognition”, International Conference on
Document Analysis and Recognition, pp. 418-421, Sep. 1999.
[13] A. M. Namboodiri and A. K. Jain, “Online handwritten script recognition”, IEEE Transactions
on Pattern Analysis and Machine Intelligence, vol. 26 (1), pp. 124-130, Jan. 2004.
[14] A. Busch, W. W. Boles and S. Sridharan, “Texture for script identification”, IEEE
Transactions on Pattern Analysis and Machine Intelligence, vol. 27 (11), pp. 1720-1732,
Nov. 2005.
[15] B. V. Dhandhra, P. Nagabhushan, M. Hangarge, R. Hegadi and V. S. Malemath, “Script
identification based on morphological reconstruction in document images”, International
Conference on Pattern Recognition, vol. 2, pp. 950-953, 2006.
[16] S. Sural and P. K. Das, “Recognition of an Indian script using MLP and Fuzzy features”,
International Journal on Document Analysis and Recognition, pp. 1120-1124, 2001.
[17] T. K. Bhowmik, P. Ghanty, A. Roy and S. K. Parui, “SVM based hierarchical architectures
for handwritten Bangla character recognition”, International Journal on Document Analysis
and Recognition, vol. 12(2), pp. 97-108, July, 2009.
[18] D. Lopresti, S. Roy, K. Schulz and L. V. Subramaniam, “Special issue on noisy text
analytics”, International Journal on Document Analysis and Recognition, vol. 12(3), Sept.
2009.
[19] R. Kapoor, D. Bagai and T. S. Kamal, “A new technique for skew detection”, Pattern
Recognition Letters, Elsevier Science Direct, vol. 25(11), pp. 1215-1229, 2004.](https://image.slidesharecdn.com/ijip-519-151230144954/75/A-New-Method-for-Identification-of-Partially-Similar-Indian-Scripts-18-2048.jpg)
![Rajiv Kapoor & Amit Dhamija
International Journal of Image Processing (IJIP), Volume (6) : Issue (2) : 2012 112
[20] I. O. Kyrgyzov, H. Maitre and M. Campedel, “Kernel mdl to determine the number of
clusters”, International Conference on Machine Learning and Data Mining, Jul. 2007.
[21] J. M. Combes, A. Grossman and P. Tchamitchan, “Wavelets, time-frequency methods and
phase space”, Springer-Verlag, 1989.
[22] A. Grossman and R. Kronland-Martinet, “Time and scale representation obtained through
[23] continuous wavelet transform”, Signal Processing IV, Theories and Applications, vol.
Elsevier Science Pub. B. V. 1988, pp. 475-482.
[24] S. G. Mallat, “A theory for multiresolution signal decomposition”, IEEE Transactions on
Pattern Analysis and Machine Intelligence, vol. 11 (7), Jul. 1989.
[25] M. Frisch and H. Messer, “The use of the wavelet transform in the detection of an unknown
transient signal”, IEEE Transaction on Information Theory, Special Issue on Wavelet
Transforms and Multiresolution Signal Analysis, vol. 38(2), pp. 892-897, Mar. 1992.
[26] M. Frisch and H. Messer, “Detection of a transient signal of unknown scaling and arrival
time using the discrete wavelet transform”, International Conference on Acoustics, Speech
and Signal Processing, vol. 2, pp. 1313-1316, Apr. 1991.](https://image.slidesharecdn.com/ijip-519-151230144954/75/A-New-Method-for-Identification-of-Partially-Similar-Indian-Scripts-19-2048.jpg)


