Study of
consolidation
parameters
• Content
Diffusion parameters
Dissolution parameters
Pharmacokinetic
parameters
Heckel plot
Similarity factors f1 and f2
DIFFUSION PARAMETERS
• This is given by Higuchi.
𝑄 = 𝐾 𝑻
• Where Q is the amount of drug released in time‘t’ per unit
area, K is higuchi constant
T is time in hr.
• Plot: The data obtained is to be plotted as cumulative
percentage drug release versus Square root of time.
• Application: modified release pharmaceutical dosage
forms, transdermal systems and matrix tablets with water
soluble drugs.
Dissolution parameters
• Dissolution is a process in which a solid
substance solubilizes in a given solvent
i.e. mass transfer from the solid surface to
the liquid phase.
• Dissolution parameters
a) Effect of agitation
b) Effect of dissolution fluid
c) Influence of pH of dissolution fluid
d) Effect of surface tension of the
dissolution medium
e) Effect of viscosity of the dissolution medium
f)Effect of the presence of unreactive and
reactive additives in the dissolution medium.
g)Volume of dissolution medium and
sink conditions
h) Deaeration of the dissolution medium
i) Effect of temperature of the dissolution
medium
Effect ofagitation
• The relationship between the intensity of agitation and
the rate of dissolution varies considerably according to
the type of agitation used, degree of laminar and
turbulent floe in the system, the shape and design of the
stirrer and the physicochemical properties of the solid.
• Dissolution test using high speed agitation may lack
discriminative value and can yield misleading results.
• Accordingly, the compendial methods in general, are
conducted under relatively low agitation.
• For the basket method, 100 rpm usually is utilized, while for
the paddle procedure, a 50 – 75 rpm is recommended.
• In case of the non official continuous flow, column type
methods, a flow rate of 10 – 100 Ml/ min commonly is
employed.
Effect of dissolution fluid
• Selection of proper medium for dissolution testing depends
largely on the physicochemical properties of the drug.
• In the early 1960s, when dissolution was still in its infancy,
great effort was spent on emulatingthe in vivo conditions in
the gastrointestinal tract, especially pH, surface tension,
viscosity and sink conditions.
Influence of pH of dissolution
fluid
• In 1949, a committee assigned by the American drug and
pharmaceutical manufacturers associations
recommended the use of distilled water as the test
medium for the distengration test.
• It was observed that in many instances water and dilute
acid gave closely comparable results.
• USP XV included simulated gastric fluid as the test
medium for tablets containing ingredients which
reacted more readily in acid solution than in water
(e.g., calcium carbonate).
• The medium again was changed to water in the USP
XVIII.
• Changes in pH exert the greatest effect in terms of
drug solubility.
• For weak acids, the dissolution rate increases with
increasing pH, whereas, for weak bases, the
dissolution rate increases with decreasing ph.
• [ average pH of stomach in men is 1.9 and 2.5 in
women].
• Therefore for acetylsalicylic acid (pKa=3.5) tablets and
capsules, the dissolution rate would be expected to
increase if the pH of the dissolution medium was higher
than 3.
• For tablets containing active ingredients, whose
solubilities are independent of pH, the dissolution rate
does not vary significantly with changes in pH of the
dissolution medium unless they contain certain
excipients that are influenced by pH.
• For example, Tablets that are formulated with carbon
dioxide producing compounds, such as sodium
bicarbonate, magnesium carbonate or calcium
carbonate, tend to have slightly faster dissolution rate in
acid medium than in water because rapid disintegration
increases the effective surface area.
Effect of surface tension of
the dissolution medium
• According to the diffusion film theory, dissolution of the
drug is governed by the interplay between two
processes, the release of the drug from the solid
surface and its transfer throughout the bulk of the
dissolution medium.
• If the drug is hydrophobic the dissolution rate is
influenced primarily by the release processes, whereas,
for hydrophilic drugs the transfer process is more likely
to be the rate limiting step.
• Incorporation of surface active agents in the
dissolution medium, is expected to enhance the
dissolution rate of a poorly soluble drug in solid
dosage forms by reducing the interfacial tension and
micelle formation.
• Addition of surfactant below the Critical micelle
concentration (CMC) can increase significantly the
dissolution rate because of better penetration of the
solvent into the tablet resulting in greater avaibility if
drug surface.
Effect of viscosity of the dissolution
medium
• If the interaction at the interfaces, occurs much faster
than the rate of transport, such as in the case of
diffusion controlled dissolution processes, it would be
expected that the dissolution rate decreases with an
increase in viscosity.
• The rate of dissolution of zinc in HCl solution containing
sucrose was inversely proportional to the viscosity of
solution.
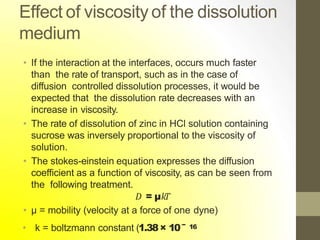
• The stokes-einstein equation expresses the diffusion
coefficient as a function of viscosity, as can be seen from
the following treatment.
𝐷 = µ𝑘𝑇
• µ = mobility (velocity at a force of one dyne)
• k = boltzmann constant (1.38× 10− 16
Effect of thepresence of unreactiveand
reactive additives in the dissolution
medium.
• When neutral ionic compounds, such as sodium chloride and
sodium sulfate, or non ionic organic compounds, such as
dextrose, were added to the dissolution medium the
dissolution of benzoic acid was dependent linearly upon its
solubility in the particular solvent.
• When certain buffers or bases were
added to the aqueous solvent , an increase in the
dissolution rate was observed.
Volume of dissolution medium
and sink conditions
• The proper volume of the dissolution medium depends
mainly on the solubilty of the drug in the selected fluid.
• If the drug is poorly soluble in water, a relatively large
amount of fluid should be used if complete dissolution is
to be expected.
• In order to maintain the effect of the concentration
gradient and maintain sink conditions, the
concentration of the drug should not exceed 10 – 15%
of its maximum solubility in the dissolution medium
selected.
Deaeration of the dissolution
medium
• Presence of dissolved air or other gases in the
dissolution medium may influence the dissolution rate
of certain
formulations and lead to variable and unreliable results.
• Example, the dissolved air in distilled water could
significantly lower its pH and consequently affect the
dissolution rate of drugs that are sensitive to pH changes,
e.g., weak acids.
• Another serious effect is the tendency of the dissolved air
to be released from the medium in the form of tiny air
bubbles that circulate at random and invariably affect the of
the hydrodynamic flow pattern generated by the stirring
mechanism.
• The gathering of air bubbles on the solid surface could
also lead to a reduction in the specific gravity to the
point where the tablet, or its disintegrating powder bed,
float to the top of he basket in the liquid medium with a
minimum chance of being wetted efficiently.
Effect of temperature ofthe
dissolution medium
• Drug solubility is temperature dependent, therefore careful
temperature control during the dissolution process is
extremely important.
• Generally a temperature of 37°±0.5 is maintained during
dissolution determination of oral dosage forms and
suppositories.
• For topical preparations as low as 30° and 25°have been
used.
• The effect of temperature variations of the dissolution
medium depends on the temperature/ solubility curves of the
drug and the excipients in the formulation.
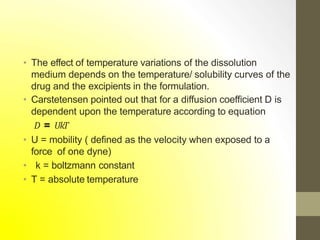
• Carstetensen pointed out that for a diffusion coefficient D is
dependent upon the temperature according to equation
𝐷 = 𝑈𝑘𝑇
• U = mobility ( defined as the velocity when exposed to a
force of one dyne)
• k = boltzmann constant
• T = absolute temperature
Hixson-Crowells cube root
law
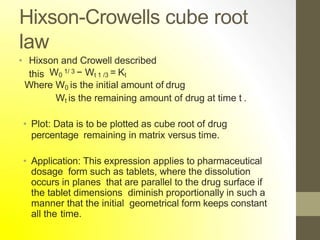
• Hixson and Crowell described
this W0
1/ 3 − Wt 1 /3 = Kt
Where W0 is the initial amount of drug
Wt is the remaining amount of drug at time t .
• Plot: Data is to be plotted as cube root of drug
percentage remaining in matrix versus time.
• Application: This expression applies to pharmaceutical
dosage form such as tablets, where the dissolution
occurs in planes that are parallel to the drug surface if
the tablet dimensions diminish proportionally in such a
manner that the initial geometrical form keeps constant
all the time.
Pharmacokinetic parameters
• Pharmacokinetics is defined as the kinetics of
drug absorption, distribution, metabolism, and
excretion and their relationship with
pharmacologic, therapeutic or toxicologic
response in mans and animals.
Plasma drugconcentration-time
profile
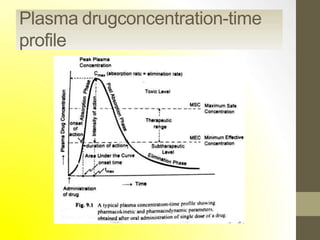
• Three important
pharmacokinetic parameters:
1. Peak plasma concentration
(Cmax)
2. Time of peak concentration
(tmax)
3. Area under the curve (AUC)
Peak plasma
concentration(Cmax)
• The point of maximum concentration of a
drug in plasma is called as peak and the
concentration of drug at peak is known as
peak plasma concentration.
• It is also called as peak height concentration
and maximum drug concentration.
• Cmax is expressed in mcg/ml.
Time of peak concentration (tmax)
• The time for drug to reach peak concentration in
plasma ( after extravascular administration) is
called the time of peak concentration.
• It is expressed in hours.
• Onset time and onset of action is dependent
upon tmax.
• The parameter is of particular importance in
assessing the efficacy of drugs used to treat
acute conditions like pain and insomnia.
Area under the curve(AUC)
• It represents the total integrated area under
the plasma level-time profile and expresses
the total amount of drug that comes into the
systemic circulation after its administration.
• AUC is expressed in mcg/ml X HRS.
• It is important for the dugs that are
administered repetitively for the treatment of
chronic conditions like asthma or epilepsy.
Similarity factorsf1
and f2
 DIFFERENCE FACTOR (f1) & SIMILARITY FACTOR(f2)
 The difference factor (f1) as defined by FDA
calculates the % difference between 2 curves at each
time point and is a measurement of the relative error
between 2 curves.
×
100
where, n = number of time points
Rt = % dissolved at time t of reference product (pre
change)
Tt = % dissolved at time t of test product (post change)
3
0
/7
 
 
 
  
n
Rt  Tt
R t
1
f
=






 t 1 
n

t 1
 The similarity factor (f2) as defined by FDA is
logarithmic reciprocal square root transformation of sum
of squared error and is a measurement of the similarity
in the percentage (%) dissolution between the two
curves



 



100
f2 = 50 ×
log1
1 n
wt(RtTt)
0.5


nr1
3
1
/7
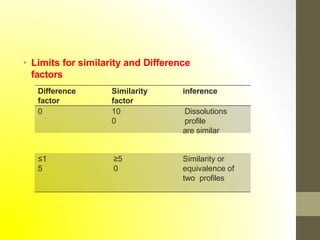
• Limits for similarity and Difference
factors
Difference
factor
Similarity
factor
inference
0 10
0
Dissolutions
profile
are similar
≤1
5
≥5
0
Similarity or
equivalence of
two profiles
• Data structure and steps to follow:
• This model-independent method is most suitable for
the dissolution profile comparison when three to four
or more dissolution time points are available.
• Determine the dissolution profile of two products (12
units each) of the test (post-change) and reference
(pre-change) products.
• Using the mean dissolution values from both curves at
each time interval, calculate the difference factor (f1)
and similarity factor (f2) using the above equations.
• For curves to be considered similar, f1 values should be
close to 0, and f2 values should be close to 100.
Generally, f1 values up to 15 (0-15) and f2 values
greater than 50 (50-100) ensure sameness or
equivalence of the two curves and, thus, of the
performance of the test (post-change) and reference
(pre- change) products.
• In dissolution profile comparisons, especially to assure
similarity in product performance, the regulatory interest
is in knowing how similar the two curves are, and to
have a measure which is more sensitive to large
differences at any particular time point. For this reason,
the f2 comparison has been the focus in agency
guidance and used to make a decision.
• Some recommendations:
• The dissolution measurements of the test and
reference batches should be made under exactly the
same conditions.
• The dissolution time points for both the profiles should be
the
same (e.g. 15, 30, 45, 60 minutes).
• The reference batch used should be the most
recently manufactured pre-change product.
• Only one measurement should be considered after
85% dissolution of both the products (when
applicable).
• Toallow use of mean data, the percent coefficient of
variation (% CV) at the earlier time points (e.g. 15
minutes) should not be more than 20%, and at other
time points should not be more than 10%.
• The mean dissolution values for reference can be
derived either from last pre-change batch or the last
two or more consecutively manufactured pre-change
batches.
• Applications
• • This method is more appropriate when more than
three or four dissolution time points are available.
• • The f2 may become invariant with respect to the
location change and the consequence of failure to
take into account the shape of the curve and the
unequal spacing between sampling time points lead
to errors.
• • Nevertheless, with a slight modification in the
statistical analysis, similarity factor would definitely
serves as an efficient tool for reliable comparison of
dissolution profiles.
• • Nevertheless, with a slight modification in the
statistical analysis, similarity factor would definitely
serves as an efficient tool for reliable comparison of
dissolution profiles.
• Advantages
• 1. They are easy to compute.
• 2. They provide a single number to describe the
comparison of
dissolution profile data.
• Disadvantages
• 1. The values of f1 and f2 are sensitive to the number of
dissolution time points used.
• 2. The basis of the criteria for deciding the
difference or similarity between dissolution profile
is unclear.
Heckel plot
• The heckel analysis is a most popular method of
deforming reduction under compression pressure .
• Powder packing with increasing compression load is
normally attributed to particles rearrangement , elastic
& plastic deformation & particle fragmentation.
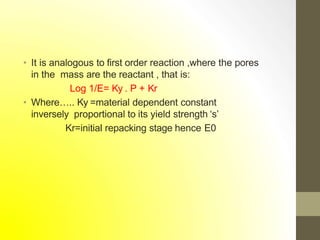
• It is analogous to first order reaction ,where the pores
in the mass are the reactant , that is:
Log 1/E= Ky . P + Kr
• Where….. Ky =material dependent constant
inversely proportional to its yield strength ‘s’
Kr=initial repacking stage hence E0
• The applied compressional force F & the movement
of the punches during compression cycle & applied
pressure P , porosity E.
• For a cylindrical tablets p=4F/л. D2 Where… D is the
tablet diameter similarly E can be calculated by
E=100.(1-4w/ρt
.л.D2.H) Where…w is the weight of the tableting mass
, ρt is its true density , H is the thickness of the tablets.
• Heckel plot is density v/s applied pressure
• Follows first order kinetics
• As porosity increases compression force also
increases
• Thus the Heckel’s plot allows for the interpretation of
the
mechanism of bonding.
• Materials that are comparatively soft & that readily
undergo plastic deformation retain different degree of
porosity , depending upon the initial packing in the die.
This in turn is influenced by the size distribution , shape
etc of the original particles.
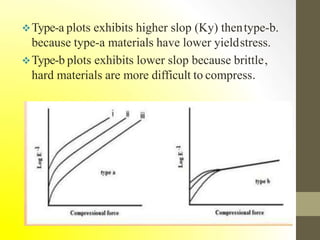
• Ex: sodium chloride (shown by type a in graph)
Harder material with higher yield pressure values
usually undergo compression by fragmentation first ,
to provide a denser packing.
• Ex: Lactose, sucrose ( shown in type b in graph).
Type-a plots exhibits higher slop (Ky) thentype-b.
because type-a materials have lower yieldstress.
Type-b plots exhibits lower slop because brittle,
hard materials are more difficult to compress.
• References:
• • Dissolution, bioavaibility and bioequivalence by Hamed
M. Abdou.
• • The theory and practice of industrial pharmacy by
Lachmann Liberman.
• • Biopharmaceutics and pharmacokinetics by
D.M. Bhramankar and Sunil b. Jaiswal