Download to read offline


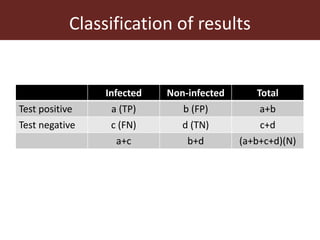


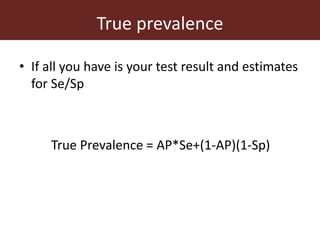


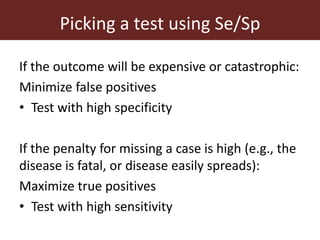


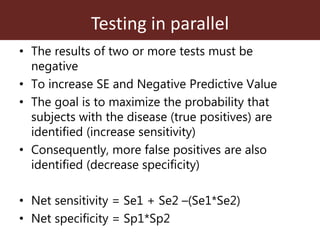
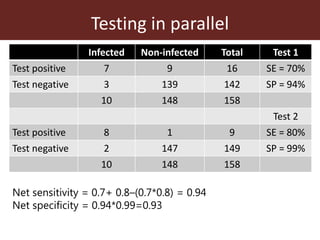

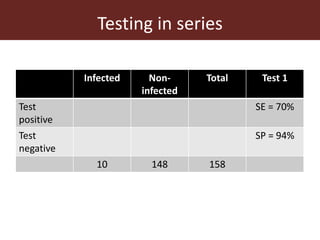

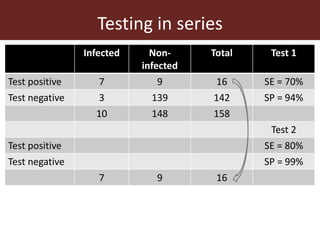

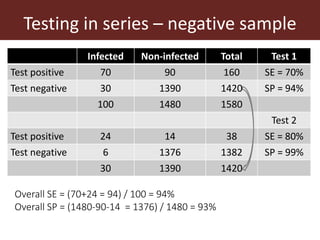


This document summarizes key points from a presentation on assessing the performance of diagnostic tests: 1. Screening tests are used to distinguish healthy from infected animals for disease surveillance and certification of disease-free herds. Issues include false positives and false negatives. 2. The accuracy, sensitivity, specificity, and predictive values of diagnostic tests are important metrics to consider. Sensitivity measures the ability to detect true infections, while specificity measures ability to detect true non-infections. 3. Testing multiple animals in parallel or series can impact overall test sensitivity and specificity. Testing in parallel increases sensitivity but decreases specificity, while testing in series has the opposite effect.


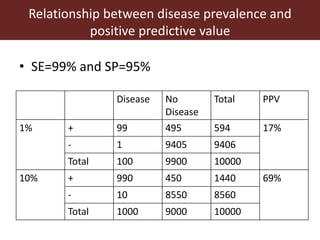
![Human Reproduction [ Reproductive System ] Notes @irfanullah_mehar Irfanullah...](https://cdn.slidesharecdn.com/ss_thumbnails/humanreproductionreproductivesystemnotesirfanullahmeharirfanullahmeharjanantantra-260111172350-56e85778-thumbnail.jpg?width=640&height=640&fit=bounds)


