Download to read offline
![Temperature Fields During the Development of Combustion
in a Rapid Compression Machine
J. CLARKSON, J. F. GRIFFITHS*, J. P. MACNAMARA, and B. J. WHITAKER
School Of Chemistry, The University, Leeds, LS2 9JT UK
Temperature and concentration fields have been imaged by Rayleigh scattering in one-dimension on a line and
by laser induced fluorescence (LIF) of acetone in a 2-D sheet across the diameter of the cylindrical combustion
chamber in a rapid compression machine. Experiments were performed in non-reactive and reactive conditions.
To investigate the development of combustion, the exothermic decomposition of di-t-butyl peroxide vapor
diluted by inert gas was studied. This reaction is characteristic of a conventional thermal ignition. Acetone is
a major product. Inert gas mixtures, to study the temperature field in the absence of reaction, were seeded with
acetone. The evidence from the experimental results supports the following interpretation. As the piston of the
machine moves, it shears gas off the walls of the chamber. This probably creates a roll-up vortex, but more
importantly it also collects cool gas from the walls and moves this gas across the cylinder head pushing it forward
into a plug at the center. Once the piston stops, there is a stratified component at the center, which is slightly
colder than the bulk of the gas, and for a short time afterwards there is very limited mixing by bulk transport
of gas from one part to another, because the gas velocity is not very high. Diffusive transport will occur, but the
timescale is relatively slow, and the effect hardly shows before 20 to 25 ms after the end of compression. The
effect (on the combustion of di-t-butyl peroxide) of this “temperature stratification” at the core of the cylinder
is that the reaction develops more slowly in the center than elsewhere. The onset of reaction in a toroidal region
is shown unambiguously, and thermal runaway is initiated there. This is demonstrated by LIF measurements
through the central plane of the reaction cylinder. From the study of inert mixtures seeded with acetone, it is
shown also that the colder core lies just ahead of the piston crown, but it does not reach the central plane until
1 ms after the piston has stopped. Rayleigh scattering on a 1-D line in the central plane proved to be
insufficiently sensitive to show the presence of the cooler zone resulting solely from the physical compression.
However, the evidence for temperature stratification becomes unequivocal from Rayleigh scattering measure-
ments made in the later stages of the peroxide decomposition. Limits of sensitivity of the scattering technique
may be inferred from this. The physical characteristics of the compression are likely to be replicated in other
rapid compression machines and are relevant to understanding the spatial development of autoignition in such
systems, which has implications also for numerical modeling. There are rather more complicated consequences,
than is the case for thermal ignition, for chain-thermal interactions which involve development through the
negative temperature-dependent regimes, as occurs in combustion of the alkanes and that of other organic
compounds. © 2001 by The Combustion Institute
INTRODUCTION
The development of the temperature field in the
combustion chamber of rapid compression ma-
chines (RCM) has been a subject of interest
over many years and the way in which temper-
atures of gases develop during reaction after the
piston has stopped has been a matter of debate.
This is particularly relevant to the quantitative
validity of numerical modeling using compre-
hensive kinetic schemes because, in such cases,
the assumption of a spatially uniform tempera-
ture throughout the combustion chamber is a
pre-requisite [1, 2]. Such modeling is used for
the kinetic understanding of the onset of engine
knock [3], and experiments in rapid compres-
sion machines are important in their own right
for validation of these numerical studies.
Until recently the only thermometric infor-
mation, which could be extracted from experi-
mental measurements in RCMs related to an
average gas temperature determined from the
measured pressure [2, 4–6] Griffiths and co-
workers have asserted that fast compression
(such as at a piston speed of 10 m sϪ1
) is very
close to being adiabatic, so that at the end of the
compression stroke the temperature should be
uniform throughout the chamber, and they have
given indirect evidence for this [4]. Minetti and
co-workers, at Lille, have also established that
even when compression occurs at a lower rate,
there is a very substantial “core gas” which is at
the adiabatic temperature [5]. In either case,
during the post compression period heat loss to*Corresponding author. E-mail: johng@chem.leeds.ac.uk
COMBUSTION AND FLAME 125:1162–1175 (2001)
0010-2180/01/$–see front matter © 2001 by The Combustion Institute
PII 0010-2180(01)00236-X Published by Elsevier Science Inc.](https://image.slidesharecdn.com/temperaturefieldsduringthedevelopmentofcombustioninarapidcompressionmachine-150806102355-lva1-app6891/75/Temperature-fields-during-the-development-of-combustion-in-a-rapid-compression-machine-1-2048.jpg)
![the combustion chamber walls must cause the
core gas volume to contract. Exothermic oxida-
tion of reactive mixtures after the end of com-
pression competes with these losses, but there is
little known about the way in which the temper-
ature field evolves.
Recently, the Lille group have made direct
measurements of the temperature at the end of
and following compression using both single
point Rayleigh scattering from a laser beam and
thermocouple measurements [7, 8]. They traced
the thermal history of the core gas by both
techniques over a considerable post-compres-
sion period in a non-reactive gas, after its
compression to an adiabatic gas temperature of
about 700 K. The Rayleigh scattered signals
were calibrated from the signal/incident beam
intensity ratio at known, adiabatic, end-of-com-
pression temperatures and pressures, and the
(slower response) thermocouple measurements
were validated against these data. The temper-
ature field associated with combustion of 2.2.4
trimethyl pentane (iso-octane) was then ex-
plored using the thermocouple.
Laser Rayleigh scattering has, for some time,
been used as a combustion diagnostic tool but
commonly the technique has been applied to
open, low pressure flames [9]. Other than single
point measurements, there are relatively few
reports of its application to high-pressure sys-
tems such as engines [10]. However, 2-D, laser
sheet, Rayleigh scattering in a combustion
bomb has been described by Kim et al. [11].
Espey et al. [12] have reported planar Rayleigh
imaging of fuel vapor in a diesel jet and Koch et
al. [13] have applied UV Rayleigh imaging to an
automobile engine.
In the present work, the potential for Rayleigh
scattering as a diagnostic for temperature mea-
surement along a line spanning the central plane
of the cylindrical combustion chamber of an RCM
was further investigated. The major interference is
from Mie scattering and also from specular reflec-
tions of the incident laser light. The study of the
spatial development of the temperature fields in
the RCM by Rayleigh scattering, under both
non-reactive and reactive conditions, was sup-
ported by laser induced fluorescence (LIF) of
acetone (2-propanone) to characterize the tem-
perature and concentration fields.
The first order, exothermic decomposition of
di-t-butyl peroxide (DTBP), following compres-
sion to 0.6 MPa at temperatures of 530 K and
570 K, was exploited as the reactive medium
because this combustion process develops in a
“classical” thermal ignition mode. That is, reac-
tion is initiated from the hottest regions of the
compressed gas, thereby causing an augmenta-
tion of any temperature inhomogeneities.
Moreover, acetone is a primary product of
reaction. The LIF of acetone, at 266 nm, was
studied in a thin sheet in the vertical plane
across the central cross-section of the combus-
tion chamber. Acetone was seeded at 1% by
volume in inert gases to investigate the behavior
of non-reactive mixtures.
Neither Rayleigh nor LIF measurements
were fully calibrated so we cannot report quan-
titative data. Nevertheless, novel qualitative fea-
tures are evident from the experimental results
and the limits of sensitivity that might be ex-
pected of Rayleigh scattering in this environ-
ment are shown. We believe that the results may
have important implications for modeling stud-
ies and may enhance the understanding of spa-
tial development of autoignition in rapid com-
pression machines.
APPARATUS, EXPERIMENTAL METHODS
AND DATA PROCESSING
A full description of the RCM and its operation
can be found elsewhere [4, 14]. A diagram of the
apparatus is given in [15]. In summary, to attain
a range of compressed gas temperatures, fuel
vapor was pre-mixed with various proportions
of inert diluents (nitrogen, argon or carbon
dioxide) so that ␥ (ϭCp/Cv) could be controlled.
In the present work, DTBP decomposition was
studied in two mixtures comprising DTBP vapor
(3.3 mol %) in N2 ϩ CO2, to achieve a com-
pressed gas temperature of 530 and 570 K
respectively when the chamber wall was heated
to 315 K. The compression ratio was 10.50
(Ϯ 0.15).
Pressure-time data during the compression
stroke and throughout the post-compression
period were measured by a pressure transducer
(Kistler 601A, natural frequency 100 kHz).
High-resolution records of the pressure history
and the timing mark for the laser firing se-
1163TEMPERATURES IN RAPID COMPRESSION](https://image.slidesharecdn.com/temperaturefieldsduringthedevelopmentofcombustioninarapidcompressionmachine-150806102355-lva1-app6891/75/Temperature-fields-during-the-development-of-combustion-in-a-rapid-compression-machine-2-2048.jpg)
![quence were recorded on a digital oscilloscope
(Tektronix, TDS 220). The gaseous reactants
were admitted to the combustion chamber at an
initial pressure of 33 kPa, then compressed by a
piston driven by compressed air. The compres-
sion took 22 Ϯ 1 ms and the final, cylindrical
volume was about 30 cm3
, the combustion
chamber then being 4.5 cm dia. ϫ 1.9 cm depth.
To allow a laser beam to traverse the diame-
ter of the combustion chamber, two 1.0 cm
diameter, optically flat, fused silica windows
were located on opposite sides of the chamber.
The end of the chamber was fitted also with an
optically flat, fused silica window (5.0 cm diam-
eter ϫ 3.0 cm thick) which allowed a full view of
the chamber cross-section for imaging the scat-
tered laser light or the laser induced fluores-
cence. An intensified charge coupled device
(ICCD) camera (Princeton Instruments, 576-G)
was used to collect photons. The piston crown
was highly polished to an optically flat, mirror
finish. This gave less interference from scattered
light than a piston crown made from brushed,
black anodized, aluminum.
Particular attention was paid to the design of
the firing sequence to maintain a stable laser
mode of operation, via its continuous firing at a
constant repetition rate while coping with the
long duty cycle of the RCM and the shot-to-shot
variation (ϳ1 ms) resulting from the electro-
mechanical operation. The solution for compat-
ibility was to externally clock the laser flashlamp
and Q-switch at a constant 10 Hz. An “en-
abling” signal was generated from the initial
trigger of the RCM, which was used to activate
the machine simultaneously with the next laser
trigger pulse. Normally two or three laser shots
would occur during the machine operation. The
following laser shot would then take place
sometime during the chemical reaction period.
The external clock was intercepted at this stage
with a pre-set, variable delay to synchronize this
particular laser pulse to the required image
point. This pulse also triggered the ICCD gating
electronics so that the camera was exposed only
for the duration of the laser pulse as it passed
through the chamber (140 ns). Once the camera
had been triggered the external clock reverted
to the normal frequency of 10 Hz.
The laser system was a frequency doubled
Nd:YAG (Quantel 680) which had been retro-
fitted with a seed diode laser (Lightwave Elec-
tronics) so as to operate on a single longitudinal
mode. Single-mode operation and linewidth
(ϳ500 MHz) were monitored by means of a
high finesse etalon placed in a reflected portion
of the main beam. Typically, the laser output at
532 nm was 300 mJ pulseϪ1
, and pulse-to-pulse
fluctuations in the laser output were estimated
to be less than 1%.
There was always some condensation of reac-
tion products within the combustion chamber.
Consequently, before each experiment it was
essential to clean all surfaces scrupulously with
the windows removed. The laser beam was
realigned after their replacement to ensure a
laser beam path through the cell that was per-
pendicular to the windows.
Rayleigh Scattering from a 1-D Line
The main beam was steered into the combustion
chamber by three, high quality, dichroic mirrors
to remove any residual IR radiation in the
beam. A Galilean telescope arrangement was
used to condense the beam before it entered the
chamber. Each single-shot pass (6–7 ns) formed
a beam (ϳ100 m dia. at 1 ) in the horizontal
diameter of the combustion chamber close to its
central, cylindrical plane. Neutral density filters
placed in the beam path were used to control
the intensity of the beam, and a series of irises
were located along the beam path to reduce the
specularly scattered light entering the chamber.
For a fixed composition, the Rayleigh scattered
signal is an inverse function of gas temperature
[7–10].
To minimize the unwanted signal from Mie
scattering and specular reflections off the cham-
ber walls and the windows, a filtered Rayleigh
scattering technique was employed [16]. This
exploits the difference in Doppler line-broaden-
ing which arises from the differing speeds of
(potentially Mie scattering) particles and the
molecules themselves. Filtering out the peak of
the Gaussain in the scattered laser light inten-
sity and collecting only the Doppler-shifted light
from the extremity discriminates the molecular
scattering. By operating the Nd:YAG laser on a
single longitudinal mode it is possible to tune
the output of the Nd:YAG laser to coincide
with one of the absorption frequencies in mo-
1164 CLARKSON ET AL.](https://image.slidesharecdn.com/temperaturefieldsduringthedevelopmentofcombustioninarapidcompressionmachine-150806102355-lva1-app6891/75/Temperature-fields-during-the-development-of-combustion-in-a-rapid-compression-machine-3-2048.jpg)
![lecular iodine vapor which, thus, served admi-
rably as a filter. This was achieved by tuning the
frequency of the diode seed laser concomitantly
with the cavity length of the Nd:YAG oscillator.
In a temperature stabilized laboratory it was
then possible to hold the Nd:YAG laser output
on an I2 line for several hours before a mode
hop occurred. A heated glass cell 15 cm long ϫ
6 cm diameter containing resublimed iodine
vapor and fitted with good quality windows was
placed between the RCM end window and the
ICCD camera. A second smaller cell was used
on a portion of the main laser beam to check, by
means of the easily observed laser induced
fluorescence, that the laser was correctly tuned
to an I2 absorption feature.
The scattering cross-section is both tempera-
ture and composition sensitive. The cross-sec-
tions and their temperature sensitivity are
known for a range of substances, and from these
it would be possible to compute the overall
scattering cross-section for certain mixture (in-
deed this is often the case [11, 17]). In general,
such calculations for reactive mixtures are un-
likely to be very accurate, not only because
there are many molecular intermediates but
also because combustion processes evolve
through an extensive temperature range. This
limits the scope for calibration, although there
is some compensation to be gained from the
dominance of inert components (e.g., N2) when
combustion takes place in air. Because the
Rayleigh scattering cross-section depends on
the wavelength to the fourth power, the sensi-
tivity of our experiment would have been im-
proved by working with the fourth harmonic of
the Nd:YAG laser around 266 nm, if a suitable
molecular or atomic filter had been available.
For example, Golz and Andresen [18] have
employed Fe atoms as a filter for Rayleigh
imaging using the output of a tunable narrow
band KrF laser (248 nm).
The composition variation in the present
study is more simple than normally encountered
in combustion because the major components
were nitrogen and carbon dioxide, with the
reactant, DTBP, and the products ethane and
acetone being present at less than 10 mol% in
total at any stage of reaction. The scattering
cross-sections of the reaction components are
somewhat greater than those of N2 and CO2.
Although iterative calculations to match com-
position and temperature fields from measured,
or calculated, molecular polarizabilities and
their temperature dependences might be viable,
and could yield quantitative results, there are
particular complications in the present case.
That is, a falling scattering cross-section is likely
to accompany the conversion of DTBP to the
smaller product molecules, reducing the scat-
tered signal under isothermal conditions, and
the peroxide decomposition is accompanied by
heat release, which also reduces the overall
scattering cross-section as a result of the tem-
perature increase. However, this combination
has attendant benefits for interpretation of the
qualitative structure because changes of scatter-
ing cross-section, originating from these two
causes, have the potential to augment each
other and thereby enhance the signals that
identify the spatial variation in temperature
along the laser line.
LIF of Acetone from a 2-D Sheet
For the purpose of the LIF imaging, a laser
sheet (width 8 mm ϫ 100 m depth) was
formed by using a cylindrical beam expanding
telescope in conjunction with a spherical lens to
focus the beam in the horizontal plane with its
vertical face to the end window. For these
experiments the laser output at 532 nm was
further doubled using an external frequency
doubling crystal to obtain the fourth harmonic
of the Nd:YAG fundamental. No seeding by the
diode laser was necessary in these experiments.
The LIF signal is sensitive to temperature be-
cause the absorption cross-section falls as tem-
perature increases. At 266 nm there is a 50%
reduction in the fluorescence quantum yield
over the temperature range 500 to 800 K [19,
20]. There are two different types of response
from the LIF detection in the present work.
Spatial variations in temperature that arise in
compressed inert gas seeded with acetone are
shown as a diminished fluorescence signal in
hotter regions. By contrast, regions in which
acetone is generated by reaction show an en-
hancement in the fluorescence intensity. This
signal is proportional to the concentration in
isothermal conditions. However, there is a tem-
perature increase associated with the formation
1165TEMPERATURES IN RAPID COMPRESSION](https://image.slidesharecdn.com/temperaturefieldsduringthedevelopmentofcombustioninarapidcompressionmachine-150806102355-lva1-app6891/75/Temperature-fields-during-the-development-of-combustion-in-a-rapid-compression-machine-4-2048.jpg)
![This enhanced fluorescence signifies that gas
resident in the central region at this time is
colder than that in the “toroidal” zone sur-
rounding it. The extent of the enhancement in
intensity is approximately 20%, which would
suggest a temperature difference of approxi-
mately 50 K between the center and the toroid
surrounding it [16]. On this basis the gradient
on the right hand side of the temperature
depression is approximately 50 K cmϪ1
. There is
also a left to right decay in intensity imposed on
the signal as a result of absorption of the beam
intensity. By 30 ms post-compression there is no
evidence of the central depression in the tem-
perature (Fig. 2c), but the fluctuations of the
LIF signal (which are somewhat greater than
those in Fig. 2b at a similar magnitude for the
integrated signal) may suggest that there is a
quite complex pattern of minor temperature
variation across the central plane of the com-
bustion chamber. At 30 ms there is also an
increase of the fluorescence intensity at the
right hand side of the chamber, which suggests
the development of a cool zone close to the
wall, but this cannot be clearly distinguished at
the point of entry of the laser beam on the left
hand side. The signal intensity in this and
subsequent figures are representative of the
number of scattered photons. However, the
incident laser was not calibrated and (minor)
variations of the intensity in successive experi-
ments were not taken into account. For this
reason the ordinate is reported in arbitrary
units. Nonetheless, for comparison, the values
do give a meaningful indication of the relative
signal strength of the figures.
Combustion of DTBP Vapor at a Compressed
Gas Temperatures of 530 and 570 K and 0.6
MPa
The combustion of DTBP (3.3 mol %) was
investigated in two mixtures comprising 1.00
C4H9OOC4H9 ϩ 7.00 N2 ϩ 22.30 CO2 and 1.00
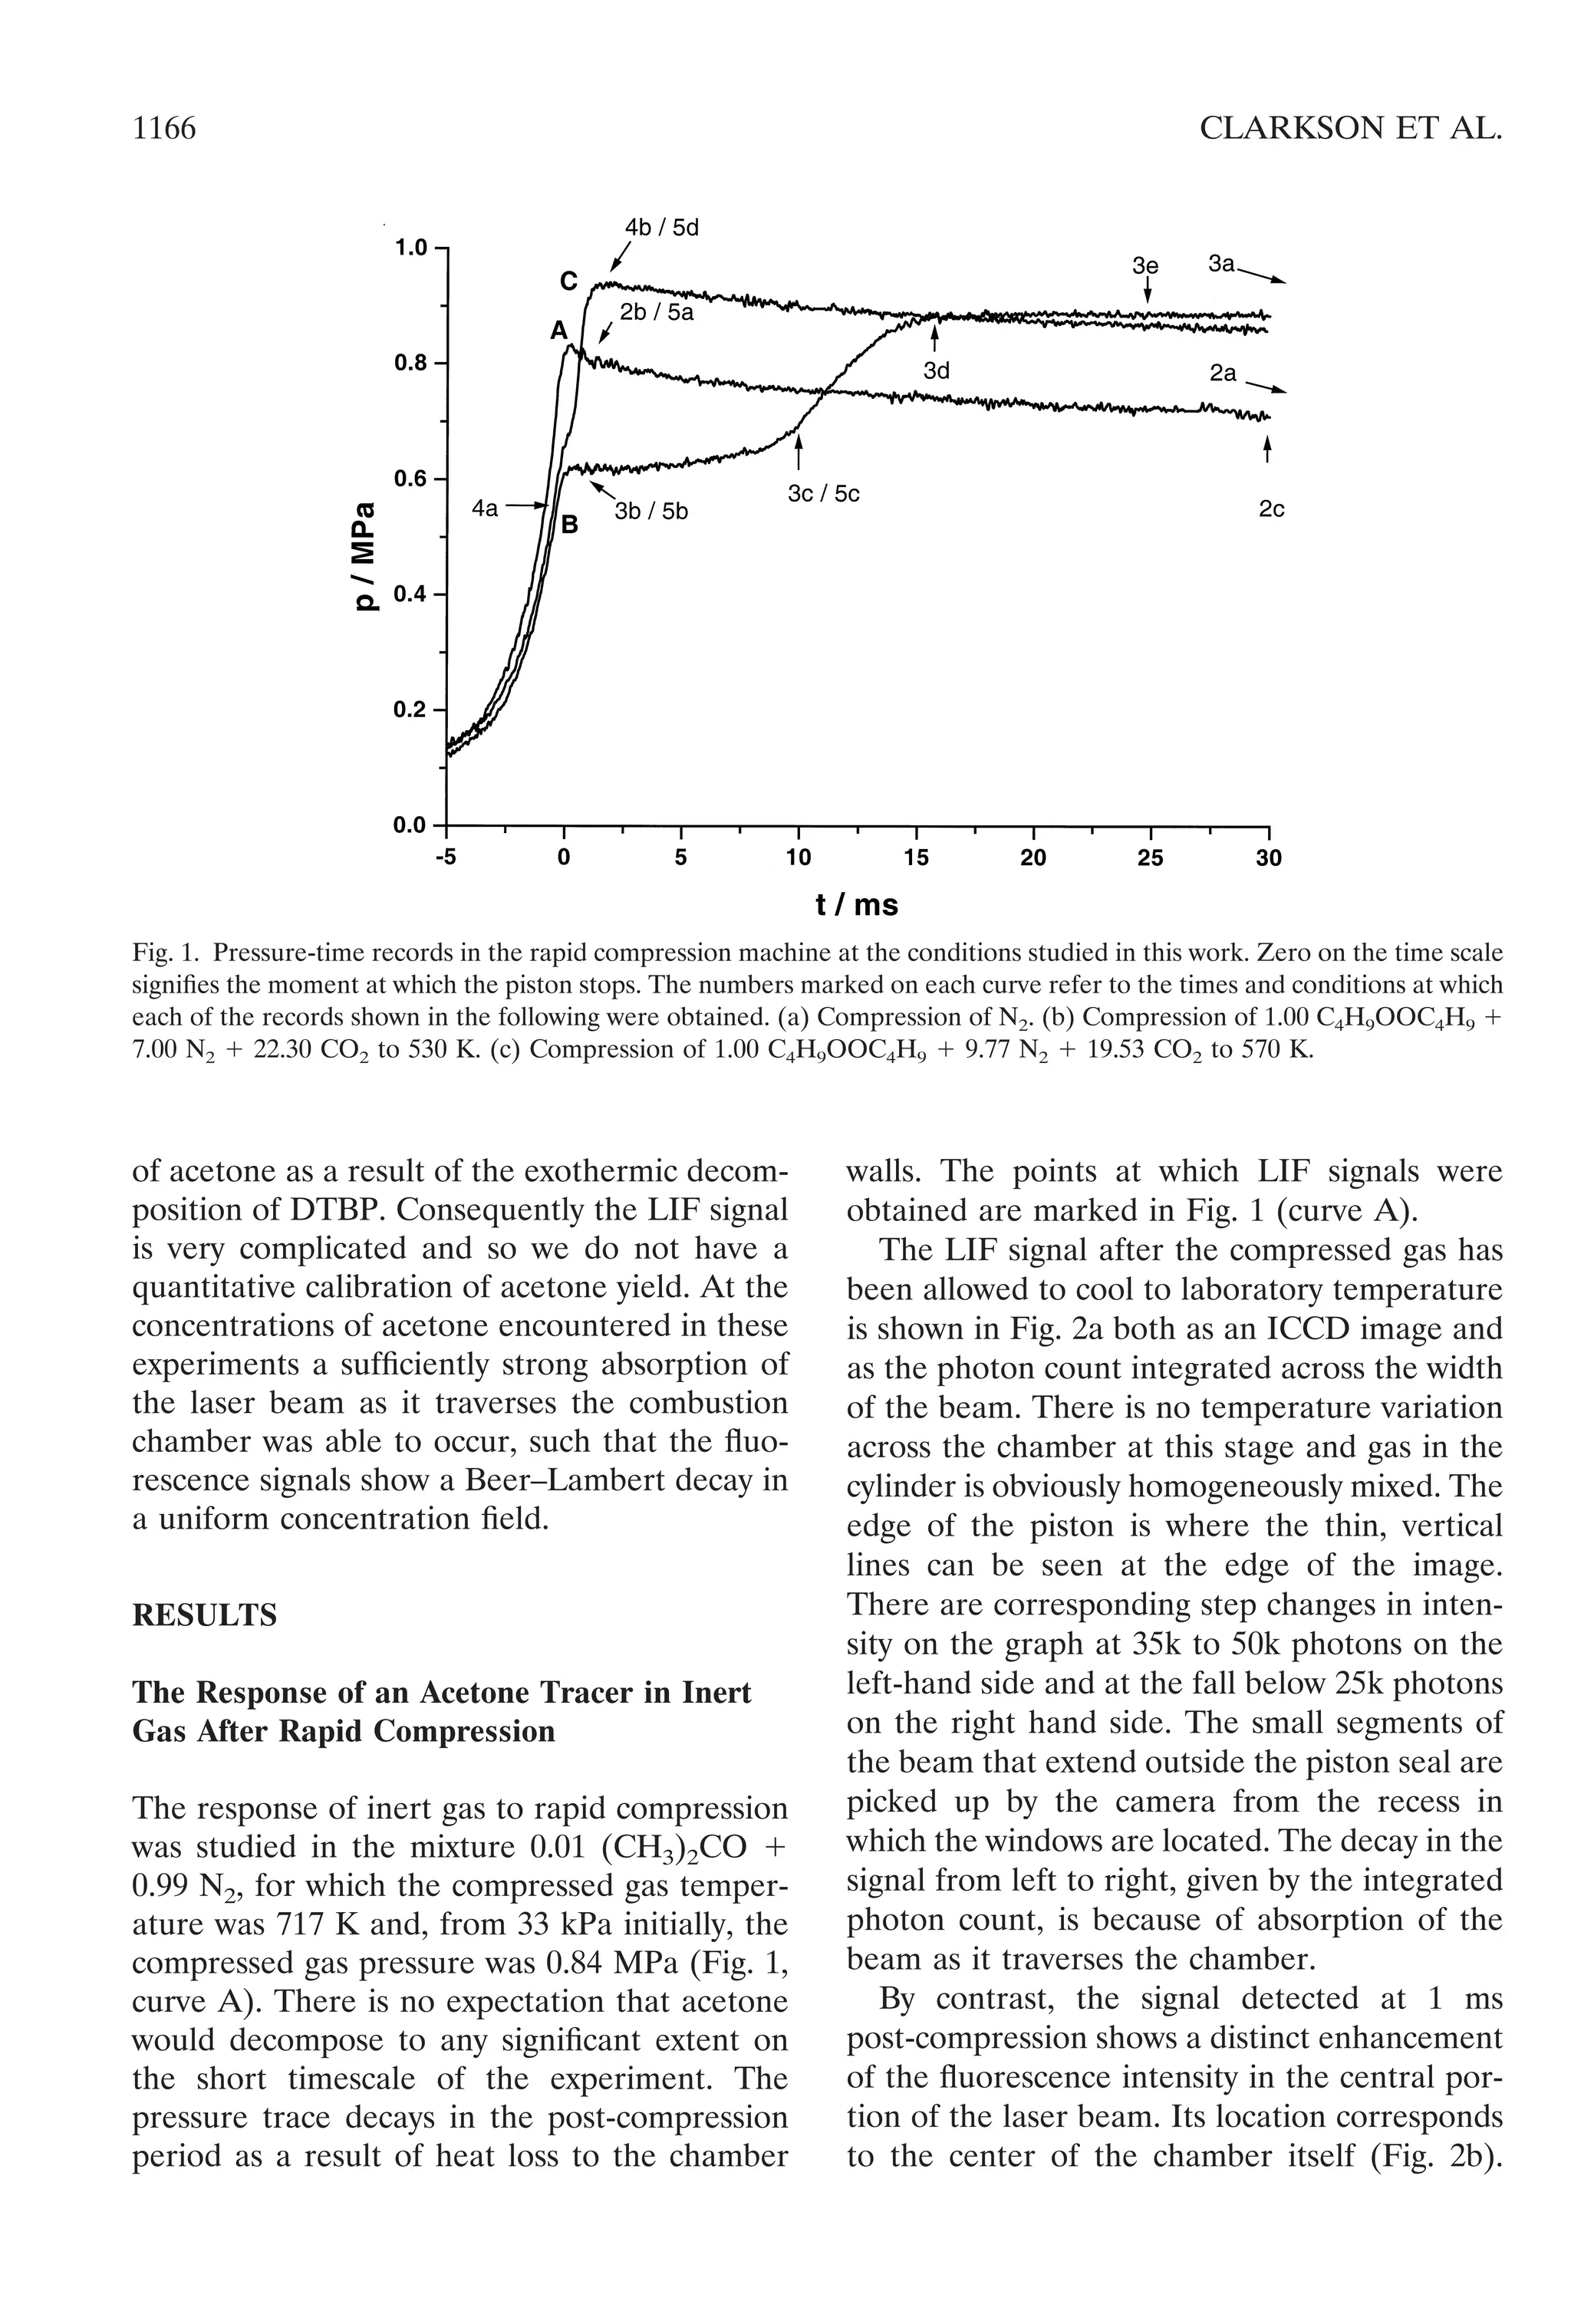
Fig. 2. The LIF signals from an acetone tracer (1 mol %) in
N2 imaged in a sheet across the central plane of the
combustion chamber. An ICCD image and the photon
count is shown. (a) Cold, compressed gas. (b) 1.1 ms
post-compression. (c) 30 ms post-compression. The ordi-
nate represents the photon count integrated across the
width of the beam, and is given as arbitrary units because
the intensity of the incident laser beam was not calibrated.
The pixel number on the abscissa is related to the position
in the field of view across the diameter of the chamber.
4™™™™™™™™™™™™™™™™™™™™™™™™™™™™™™™™™™™™™™™™™™™™™™™™™
1167TEMPERATURES IN RAPID COMPRESSION](https://image.slidesharecdn.com/temperaturefieldsduringthedevelopmentofcombustioninarapidcompressionmachine-150806102355-lva1-app6891/75/Temperature-fields-during-the-development-of-combustion-in-a-rapid-compression-machine-6-2048.jpg)
![C4H9OOC4H9 ϩ 9.77 N2 ϩ 19.53 CO2. On the
basis of adiabatic compression at CR ϭ 10.5,
these compositions ensured compressed gas
temperatures of 530 K and 570 K at the end of
compression when the cylinder is heated to 310
K. These conditions correspond to those used in
previous work [14]. The pressure records are
shown in Fig. 1 (lines B and C). Also marked in
each case are the points at which LIF images of
acetone (product) fluorescence in the 2-D plane
and thermal imaging by Rayleigh scattering on a
1-D line were obtained. Each of the optical
measurements were made in separate experi-
ments at the prescribed conditions.
The reaction developed in a single stage in
the post-compression period at both of the
selected compressed gas temperatures, but the
timescales were significantly different. The de-
velopment was relatively slow at the lower tem-
perature, the maximum pressure in the constant
volume chamber being reached only after about
15 ms (Fig. 1, curve B). The overall change in
mole numbers is relatively small (ca 6%) so this
pressure change is attributable almost entirely
to the temperature change resulting from the
exothermic reaction.
The compression is sufficiently rapid that
most of the temperature increase occurs within
the final few milliseconds of the compression
stroke and, unless excessive gas motion is arti-
ficially created [21], there is hardly any heat loss
associated with the compression stage [4]. Heat
loss in the post-compression period is inevitable
[5, 22], but the residual gas motion is not
sufficiently vigorous that the whole system could
be approximated to a spatially uniform, “well-
stirred” system [14]. Nevertheless, from the
extent of the post-compression pressure rise at
15 ms post-compression, on an ideal gas basis
the average increase in the gas temperature is
approximately 80 K.
The reaction occurred much more rapidly
when the compressed gas temperature was
raised to 570 K, with some decomposition being
possible even before the piston had stopped
(Fig. 1, curve C). In this case the maximum
pressure was reached ca 1 ms after the end of
compression. The average temperature rise cal-
culated from the pressure change is approxi-
mately 190 K, which is close to the predicted
adiabatic temperature rise for the mixture. Heat
losses over 1 ms post-compression would be
relatively insignificant. This rate of development
of the decomposition with thermal feedback is
to be expected since the half-life is 3 ms at 600
K, and by 650 K, t1/2 has diminished to less than
0.5 ms.
The respective LIF images of acetone gener-
ated as a reaction product following compres-
sion to 530 K are shown in Fig. 3. These are also
displayed both as the primary sheet image as
well as the statistical photon count integrated
across the image width. The cold, compressed,
reaction products cause a very strong Beer–
Lambert absorption because of the uniform
concentration of acetone that has been gener-
ated (Fig. 3a). The fluorescence signal intensity
is considerably stronger than that of the tracer
acetone in CO2 (Fig. 2a) because the concen-
tration of the product is much higher (ca. 6 mol
%) and the product has cooled to laboratory
temperature. The thin line of the piston seal is
just detectable on the right hand side of the
image, but it is masked by the window reflec-
tions on the beam entry side.
Although there has been no enhancement of
the gas pressure in the chamber at 1.1 ms
post-compression, there is already sufficient ac-
etone formed to create a weak fluorescence
signal (Fig. 3b). There is evidence in this result
that rather less acetone has been formed in the
center of the chamber as a consequence of the
reduced reaction rate in this cooler zone. The
pressure has begun to increase by 10 ms post-
compression (Fig. 1, line B) and, commensurate
with this development of reaction, there is a
somewhat stronger LIF signal from acetone
(Fig. 3c). The reduced intensity at the center is
clear, and (presuming that the temperature field
is qualitatively similar to that of the non-reac-
tive system) this signifies a lower temperature
simply because hardly any acetone has been
formed. We are not able to infer any magnitude
for the temperature variations across the cham-
ber because there are conflicting variations on
the intensity of the fluorescence signal owing to
changes both in the acetone concentration and
the gas temperature. The reaction is well devel-
oped at 15 ms post-compression and there is a
much greater fluorescence from acetone in con-
sequence (Fig. 3d). The effect of the laser beam
absorption, from left to right, is evident in the
1168 CLARKSON ET AL.](https://image.slidesharecdn.com/temperaturefieldsduringthedevelopmentofcombustioninarapidcompressionmachine-150806102355-lva1-app6891/75/Temperature-fields-during-the-development-of-combustion-in-a-rapid-compression-machine-7-2048.jpg)
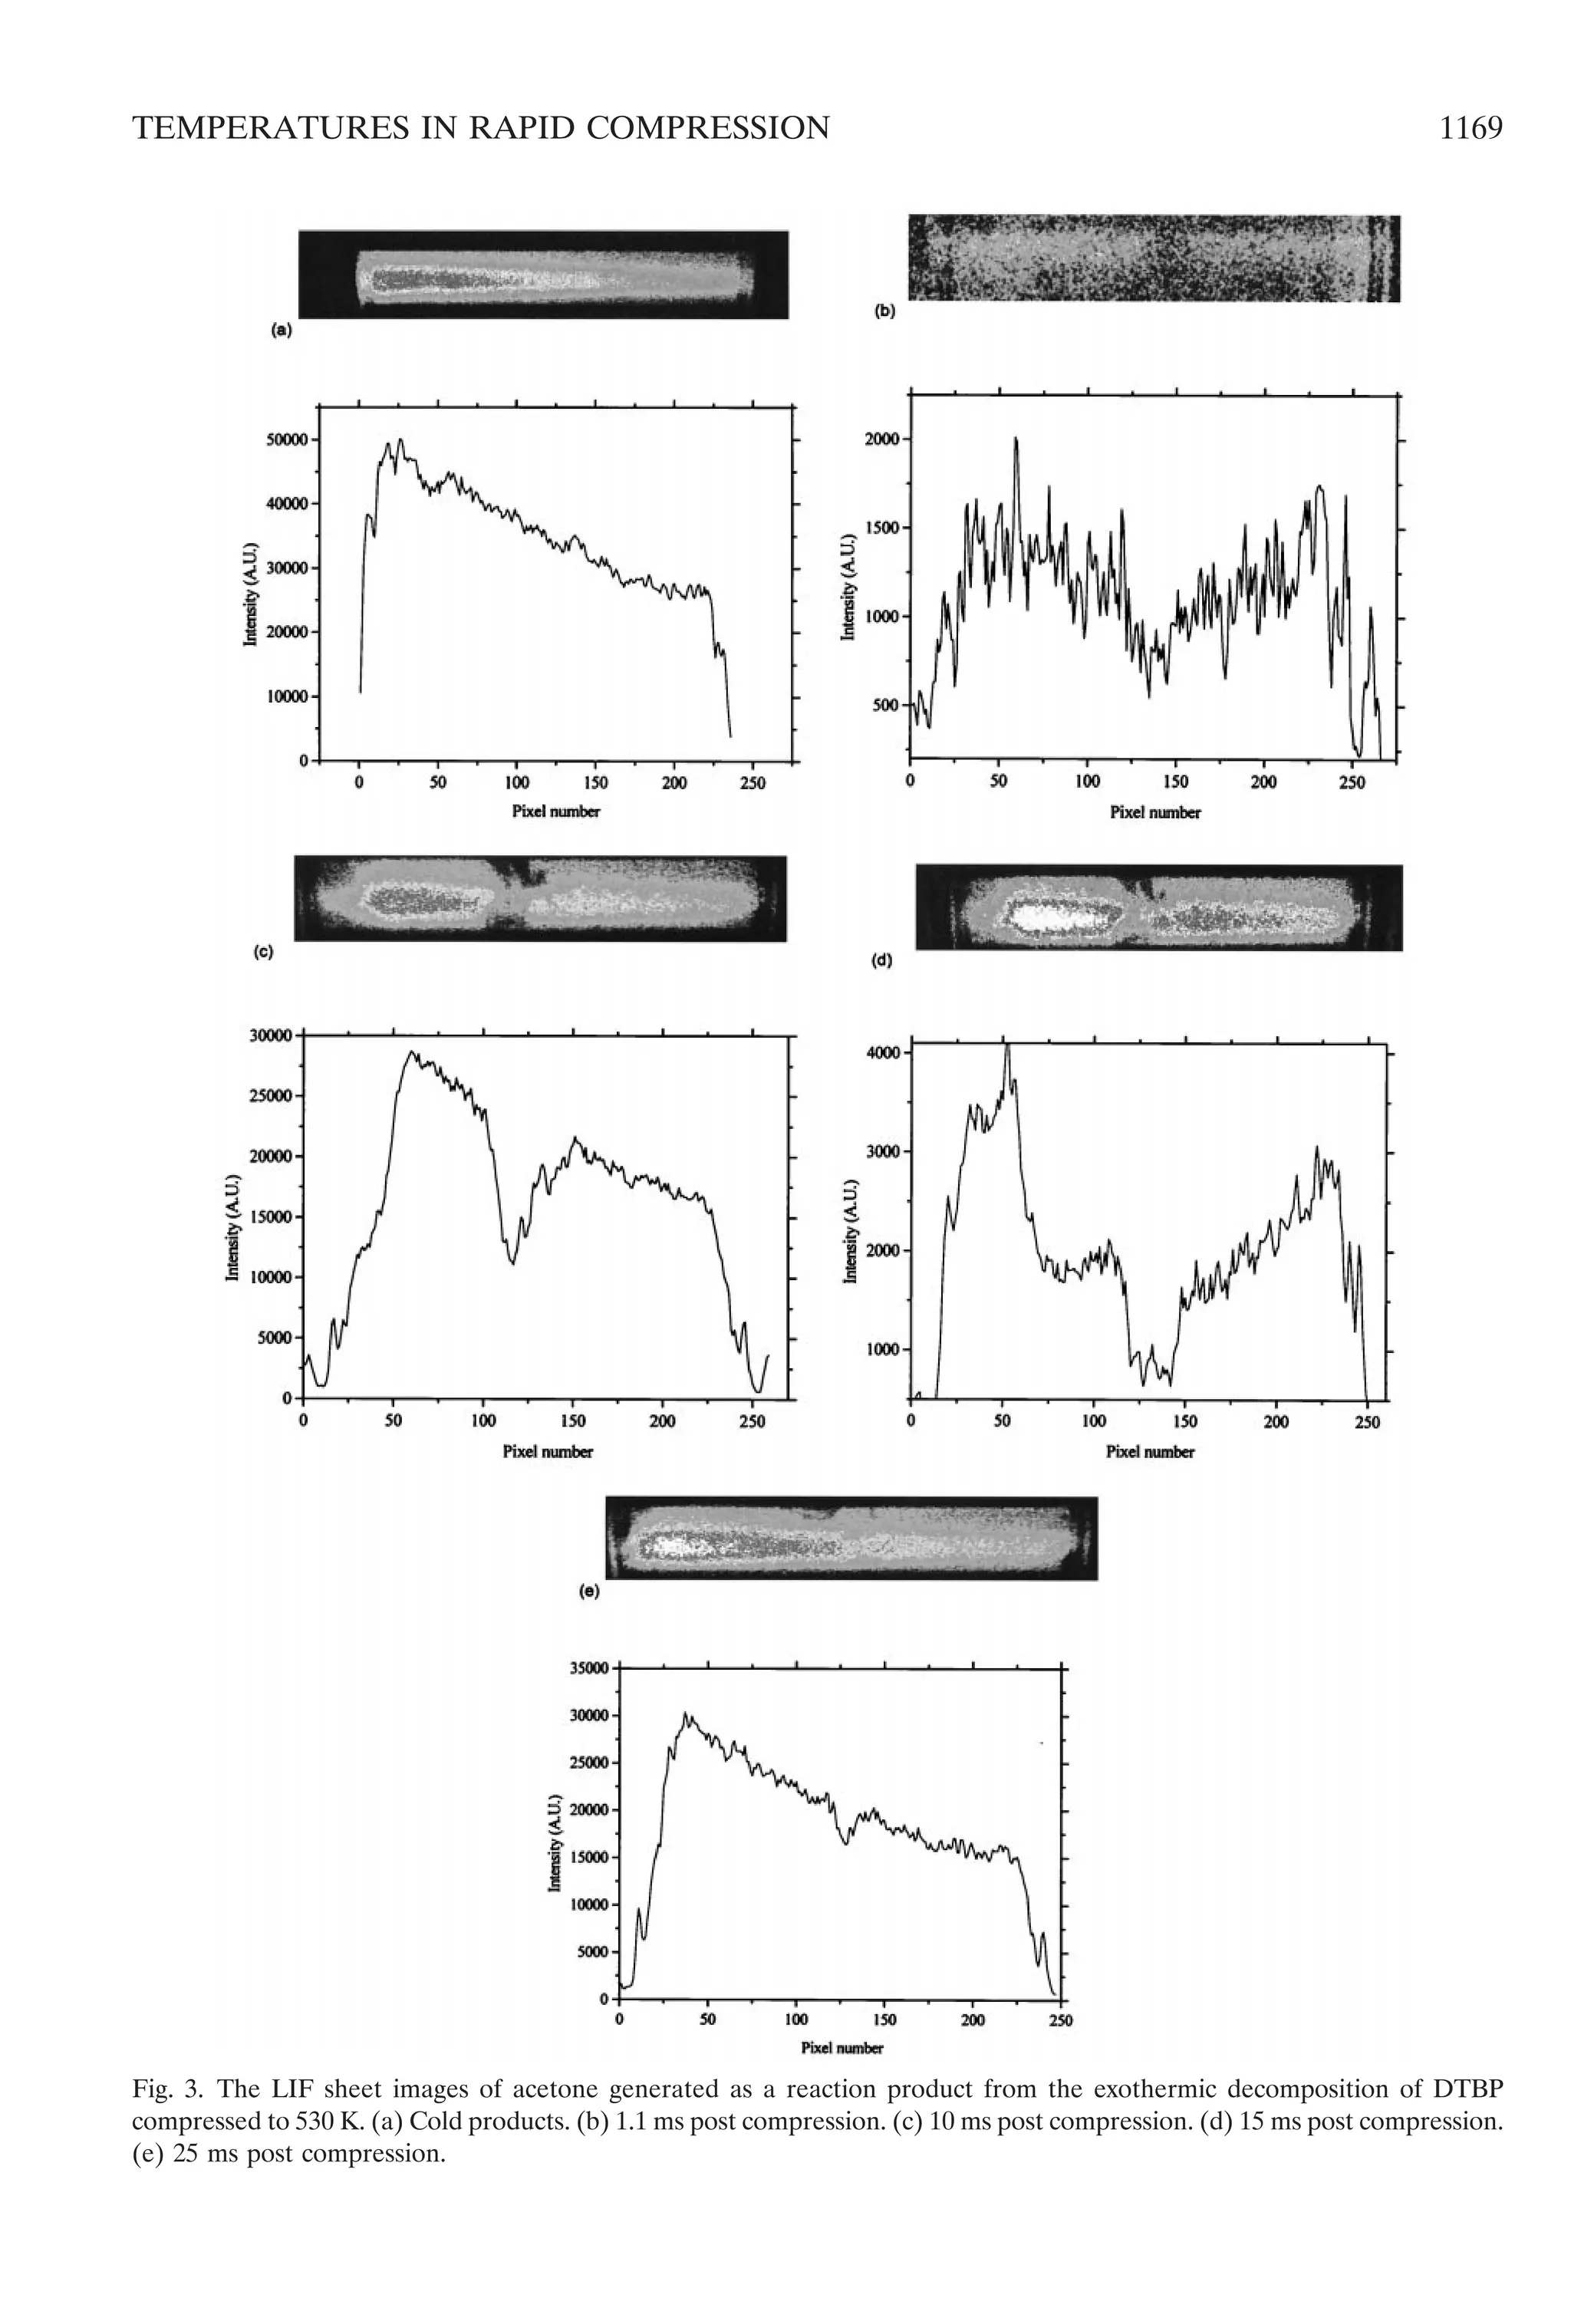
![signal, but there is still a marked inhomogeneity in
the acetone concentration close to the center of
the chamber. Even at 25 ms post-compression,
although somewhat diminished in volume, there is
still a cooler core relative to that of the reactants
and products in the surrounding region (Fig. 3e).
The acetone LIF signals during reaction at a
compressed gas temperature of 570 K are
shown in Fig. 4. It is likely that some reaction
has taken place even in the final stages of the
compression stroke because there is a very weak
LIF signal from acetone just before the end of
compression (Fig. 4a). However, there is no
indication that the cold core has penetrated to
the center plane of the chamber by that stage.
By 1.1 ms after the piston has stopped, the
chamber pressure is fully developed and the
reactants are at their highest average tempera-
ture (Fig. 1, line C). There is a substantial
fluorescence signal from the acetone produced
(although of lower photon count overall be-
cause of the high gas temperatures) and the
much weaker signal at the center confirms the
existence of the appreciably cooler core gas in
the central plane of the combustion chamber
(Fig. 4b). The photon count of the fluorescence
signal at the center integrated across the beam
width is approximately 40% of that in the region
either side of it. A slight increase in the image
intensity to the far left suggests that inhomoge-
neities following compression may be such that
the hottest gases reside quite close to the pe-
riphery of the chamber and that a gradient has
been created toward the cooler core region.
This would be commensurate with the forma-
tion of a roll-up vortex [23,24].
Rayleigh Scattering from a 1-D Line on the
Horizontal Radial Axis at the Central Plane
Rayleigh scattered signals from the horizontal
radial axis are shown in Fig. 5 both as the
primary image and the statistical count of pho-
tons on the central pixel line of the image,
scaled to the full range of photon counts (216
,
ϳ65k). The conditions are those for an inert gas
(N2) and also for the decomposition of DTBP at
530 and 570 K at 1.1 ms post-compression. The
edge of the piston crown and gap where the
p.t.f.e. seal fit can be seen clearly in Fig. 5a as a
thin, dark cylindrical section. There is some
scattered light detected beyond the chamber
itself and these reflections lead to spurious
signals just inside the circumference of the
chamber. Reflections are also visible at certain
locations inside the chamber owing to imperfec-
tions of the piston crown. Some artifacts also
appear as a result of imperfections of the iodine
filter cell. These could all be easily identified
and distinguished from the primary signal. A
limited amount of Mie scattering was also un-
avoidable. It was particularly difficult to obtain a
uniformly high quality of all images, the main
criteria being the cleanliness of optical align-
ment of the laser beam. Nevertheless, as shown
Fig. 4. The LIF sheet images of acetone generated as a
reaction product from the exothermic decomposition of
DTBP compressed to 570 K. (a) 0.5 ms before the end of
compression. (b) 1.1 ms post compression.
1170 CLARKSON ET AL.](https://image.slidesharecdn.com/temperaturefieldsduringthedevelopmentofcombustioninarapidcompressionmachine-150806102355-lva1-app6891/75/Temperature-fields-during-the-development-of-combustion-in-a-rapid-compression-machine-9-2048.jpg)
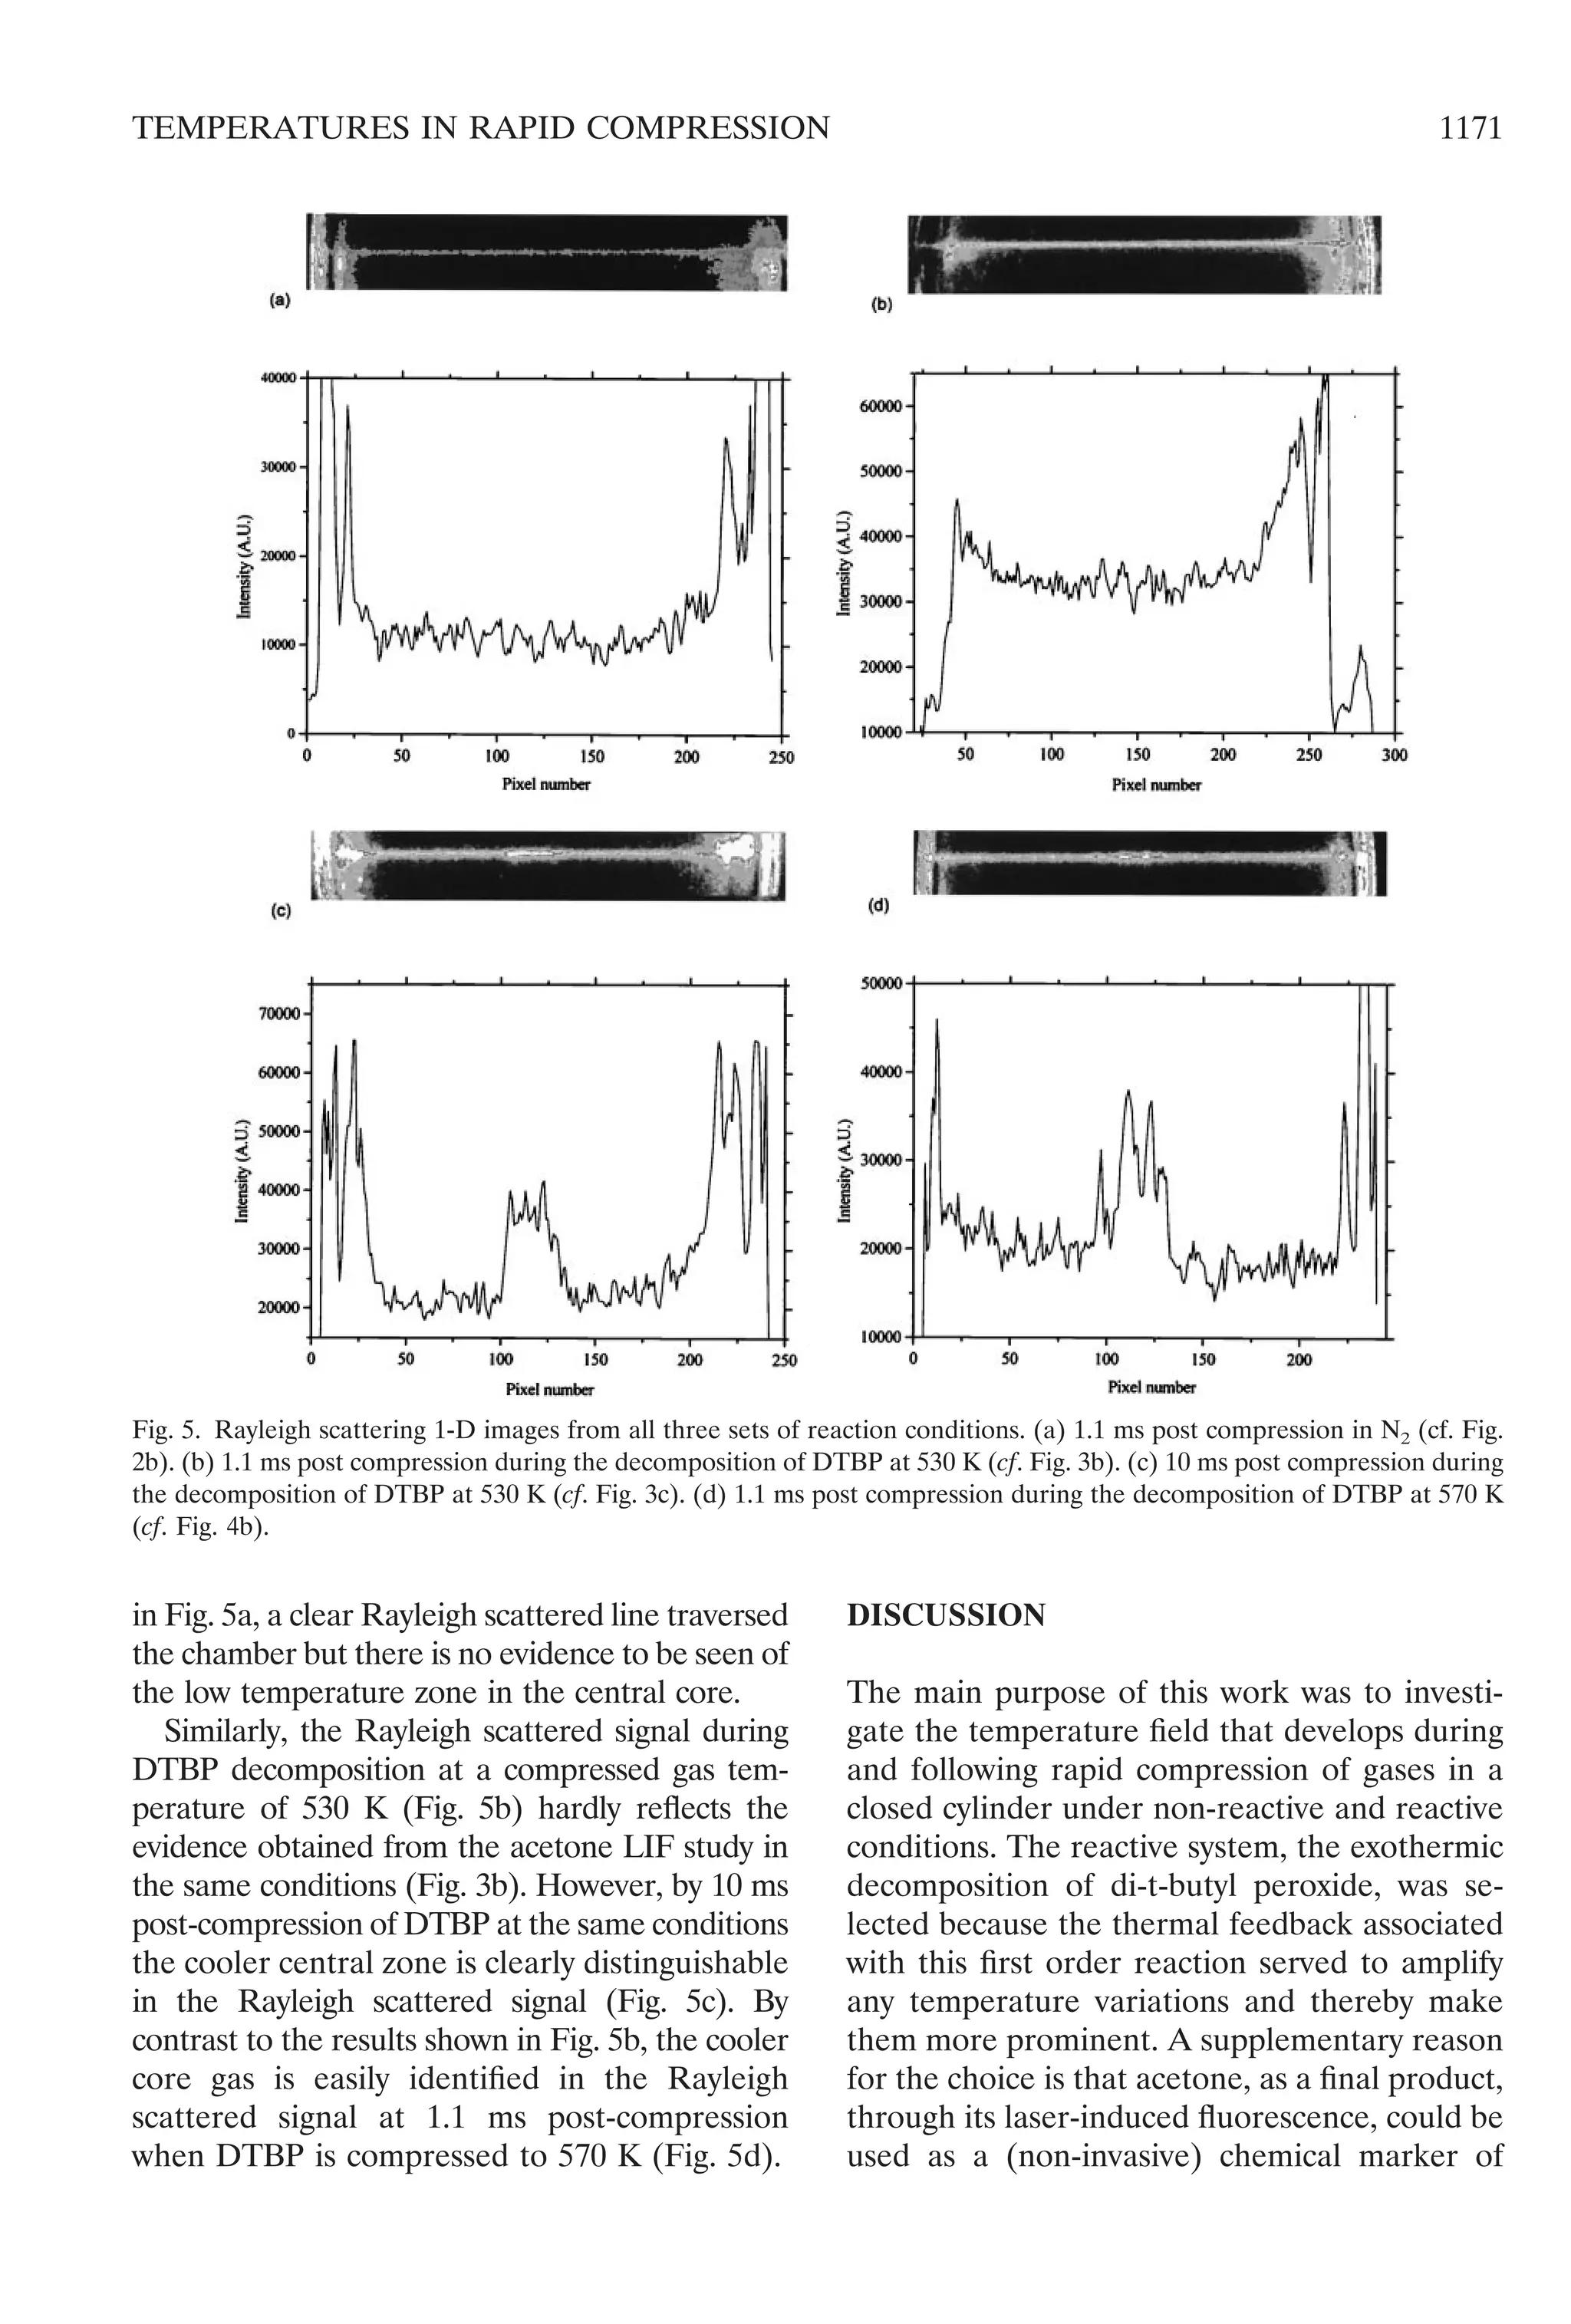
![spatial variations. The decomposition of DTBP
has some relevance also because it was the
subject of a computational fluid dynamic analy-
sis of reaction in the RCM, 7 years ago [14],
some aspects of which are discussed next.
In Fig. 6 we reproduce a simulation from a
KIVA II [24] calculation of the temperature
field in the Leeds RCM. This represents the
plan view of an axisymmetric section of the
chamber of the rapid compression machine
derived on a relatively coarse (20 ϫ 20) grid.
Results published elsewhere show the output
using a more refined mesh, but with very similar
qualitative features [14]. Although it is not
intended that the result in Fig. 6 is to be
interpreted in a quantitative way, it illustrates how
a cooler gas region may penetrate the core of the
reaction zone as a result of gas being swept from
the sidewall of the combustion chamber, with an
attendant roll-up vortex adjacent to the piston
crown and circumference of the chamber. This is
consistent with the pattern of development shown
by Tabaczinski et al. [23] and in more recent,
related work by Lee and Hochgreb [25].
Consequences of the “Cold Core” on
Exothermic Chemistry that Exhibits a Positive
Temperature Dependence
There is clear evidence in this study that at the
end of compression a cold plug of gas is swept
across the piston face and is able to penetrate
the center of the adiabatically heated core gas.
This creates a spatially non-uniform tempera-
ture field during a post-compression time inter-
val that is relevant to the development of spon-
taneous ignition of reactive mixtures. The
temperature difference between the center and
the surrounding toroid may exceed 50 K. As a
result of thermal feedback, an exothermic
chemical reaction that exhibits a positive tem-
perature dependence enhances the spatial vari-
ations in temperature, and the hottest points
become the sites at which ignition would natu-
rally develop. A full development of ignition
does not follow in the decomposition of DTBP
(as studied here) because it is not strongly
exothermic (⌬Uo
298 ϭ - 165 kJ molϪ1
). Never-
theless, the temperature reached in the hottest
zones approaches the adiabatic temperature
change when the reactants are compressed to a
sufficiently high temperature for a fast develop-
ment of reaction (see Fig. 1, curve C). These are
the first experimental results to show how the
non-uniform temperature field following rapid
compression may affect the chemical develop-
ment.
Consequences of the “Cold Core” on
Chemistry that Exhibits an Overall Negative
Temperature Dependence
As is well known, the combustion of many
organic compounds, and alkanes in particular,
exhibit a negative temperature dependence (or
negative temperature coefficient, ntc) of the
overall chemical reaction rate through temper-
atures over the approximate range 750 to 850 K
[6]. The underlying chemistry is reasonably well
established now in a quantitative way [26].
When thermal feedback occurs in non-isother-
mal conditions, reaction may develop to give
oscillatory cool flames and complex ignitions, as
in closed vessels and stirred flow reactors [27].
Single or two-stage ignitions occur in devices
such as rapid compression machines [1, 2, 4, 5].
The two-stage ignition development itself exem-
plifies the occurrence of the ntc, insofar that the
reaction accelerates through the initial stage but
then decelerates as the onset of the second
stage is approached. It is at this point that the
reactant temperature has, on average, ap-
proached about 850 K [4]. The thermokinetic
Fig. 6. The temperature field that was predicted to develop
by 5 ms post compression, simulated in a combustion
chamber corresponding to that of the Leeds RCM, using
KIVA 11. The range of temperatures is 500 K to 570 K, with
contour lines at 10 K intervals.
1172 CLARKSON ET AL.](https://image.slidesharecdn.com/temperaturefieldsduringthedevelopmentofcombustioninarapidcompressionmachine-150806102355-lva1-app6891/75/Temperature-fields-during-the-development-of-combustion-in-a-rapid-compression-machine-11-2048.jpg)
![interactions that cause the onset of the second
stage are discussed elsewhere [28–30].
The relevance of these features is that a
system that exhibits an ntc of rate in a certain
temperature range, is capable of responding to
an inhomogeneous temperature field in a dif-
ferent way from that seen in the present exper-
iments. That is, reaction may be more vigorous
in the colder gas, which thus serves to smooth
out temperature differences, and the system
moves to a more uniform temperature field in
the later stages as a consequence of the negative
feedback. However, if gas mixing is not very
significant on the timescale of evolution of
ignition, the composition field does not become
uniform because different extents of reaction
will have occurred at different spatial locations
during the course of this development. This has
implications for the way in which the second
stage of ignition then evolves because regions
may then exist that are chemically more active
than others. These effects are to be discussed in
a later paper.
A Critique of Experimental Methods for
Identifying Spatial Structure in Rapid
Compression Machines and their
Consequences
Acetone LIF serves well to identify spatial
variations in temperature in the RCM when it is
used as a marker in non-reactive gases up to
temperatures of about 900 K. Thereafter, its
own decomposition could become troublesome
on relatively short timescales. The system can be
calibrated because the temperature dependence
of the absorption cross-section is known [19,20].
Although we have not pursued our own calibra-
tion, the data provided by Thurber et al. [19, 20]
show that, by 1 ms post-compression, the tem-
perature difference between the cooler core gas
and the surrounding toroid, illustrated in Fig.
2b, might be as high as 50 K. This appears to be
supported in the calculations by Griffiths et al.
[14], as also exemplified in Fig. 6. The genera-
tion of a laser sheet is easy and, with greater
optical access than in the present chamber, an
extensive temperature field could be mapped.
In an active free radical environment an acetone
tracer not only presents a chemical perturbation
but also it is susceptible to reaction, so would
not be a viable route to studying the tempera-
ture field. In the case of DTBP decomposition,
the LIF of acetone can also been used to
identify the composition field represented by
the final product formation. However, unlike
the thermal calibration, there is no correspond-
ing, simple quantitative relationship for the
concentration vs. LIF intensity when acetone is
formed because it is being generated under
non-isothermal conditions. In both of these
applications there is a sufficiently strong (Beer–
Lambert) absorption of the excitation laser
beam for a correction for asymmetry of the LIF
signal to be required if quantitative analyses are
to be sought.
Our complementary study of Rayleigh scat-
tering on a one-dimensional line shows this
technique to be rather less sensitive for thermal
imaging than the acetone tracer LIF measure-
ments. This limitation of Rayleigh scattering, in
these typical combustion mixtures where nitro-
gen is present in high proportion, caused the
cooler core gas not to be identified in the
immediately post-compression interval. Thus
we would infer that any spatial variation in
temperature that is less than about 60 K is
unlikely to be distinguishable from background
noise in the Rayleigh scattered signal. Without
that awareness there is the risk of misinterpre-
tation of the qualitative structure, as is exempli-
fied when the results for the Rayleigh scattering
during the onset of DTBP decomposition fol-
lowing compression to 530 K (Fig. 5b) are
compared with the related LIF measurement
(Fig. 3b). However, a very clear, qualitative
distinction became evident when the tempera-
ture difference was amplified to approximately
200 K, as shown in Fig. 5c. This is an optimal
result because the temperature difference exists
at the center of the chamber. In most experi-
ments, the scatter of light close to the windows
in the chamber wall precludes an unambiguous
interpretation. Nevertheless, from the result
shown in Fig. 5c, it may be inferred that tem-
perature gradients at the edge of the chamber
are very steep.
Rayleigh scattering studies in the chamber of
a rapid compression machine, by Desgroux et al.
[7, 8], yielded single point temperature mea-
surements with a higher accuracy than assessed
from this 1-D line study, namely Ϯ 30 K.
1173TEMPERATURES IN RAPID COMPRESSION](https://image.slidesharecdn.com/temperaturefieldsduringthedevelopmentofcombustioninarapidcompressionmachine-150806102355-lva1-app6891/75/Temperature-fields-during-the-development-of-combustion-in-a-rapid-compression-machine-12-2048.jpg)
![Although they did not investigate spatial varia-
tions, even at this precision and given the scatter
that was reported for a series of measurements,
it is debatable whether or not they would have
been able to distinguish the development of a
“toroidal” temperature field of the kind seen in
the present work. In any event, the compression
was considerably slower in the apparatus that
was used by Desgroux et al., taking 60 ms for a
similar stroke, so somewhat different spatial
and temporal temperature evolution would be
expected in the post compression period. The
subtleties of the temperature history are cer-
tainly machine specific, and significant differ-
ences may be realized under different operating
conditions or in chambers of different design.
Lee and Hochgreb [25] have shown theoreti-
cally how attention to the design of the piston
crown and rings can suppress the formation of a
roll-up vortex and thereby reduce or eliminate
the effects that are reported in the present
paper.
Ignition delays measured in different appara-
tus cannot usefully be compared directly with-
out reference to the dependences on the indi-
vidual equipment. Foremost is the effect of heat
loss, but more subtle consequences of gas mo-
tion that induce spatial temperature variations,
as exposed here, may also be relevant. As has
been illustrated with respect to di-t-butyl perox-
ide decomposition [14], the existence of temper-
ature inhomogeneities also has considerable
bearing on the relationship between experimen-
tal measurements of ignition and numerical
simulations using detailed, zero-dimensional
thermokinetic models. However, there are mit-
igating circumstances with respect to the mod-
eling of alkane combustion, whereby kinetic
systems that exhibit a negative temperature
dependence of reaction rate are capable of
smoothing out the spatial variations that may
have been created in the combustion system, as
noted in the preceding subsection and in earlier
publications [8, 31, 32].
The authors are grateful to EPSRC for support
of this project under grant GR/K97189. The au-
thors wish to thank Drs M. Schreiber and J. Meyer
for permission to publish the results shown in Fig.
6, which were preliminary calculations for the
work described in [14].
REFERENCES
1. Cox, A., Griffiths, J. F., Mohamed, C., Curran, H. J.,
Pitz, W. J., and Westbrook, C. K., Proc Comb. Inst.
26:2685–2691 (1996).
2. Ribaucour, M., Minetti, R, and Sochet, L. R., Proc
Comb. Inst. 27:345–351 (1998).
3. Cowart, J. S., Keck, J. C., Heywood, J. B., Westbrook,
C. K., and Pitz, W. J., Proc. Comb. Inst. 23:1055–1062
(1990).
4. Griffiths, J. F., Halford–Maw, P., and Rose, D. J.,
Combust. Flame, 95:291–304 (1993).
5. Minetti, R., Ribaucour, M., Carlier, M., Fittschen, C,
and Sochet, L. R., Combust. Flame,96:201–211 (1994).
6. Griffiths, J. F., and Mohamed, C., Comprehensive
Chemical Kinetics, Vol. 35, (M. J. Pilling, Ed.) Elsevier,
Amsterdam, pp. 545–660 (1997).
7. Desgroux, P., Gasnot, L., and Sochet, L. R., Appl. Phys.
B61:69 (1995).
8. Desgroux, P., Minetti, R., and Sochet, L. R., Combust.
Sci. Tech. 113:93–203 (1996).
9. Zhao, F-Q., and Hiroyasu, H., Prog. Energy Combust.
Sci. 19:447–485 (1993).
10. Zhao, H., and Ladommatos, N., Prog. Energy Combust.
Sci. 24:297–336 (1998).
11. Kim, G. S., Hitchcock, L. M., Siegler, F., Rothe, E. W.,
Tung, C. C., and Reck, G. P., Appl. Phys, B56:139–145
(1993).
12. Espey, C., Dec, J. E., Litzinger, T. A., and Santavicca,
D. A., Combust. Flame109:65–86 (1997).
13. Koch, A., Voges, H., Andresen, P., Schluter, H., Wolff,
D., Hentschel, W., Oppermann, W., and Rothe, E.,
App. Phys. B56:188–184 (1993).
14. Griffiths, J. F., Jiao, Q., Kordylewski, W., Schreiber,
M., Meyer, J., and Knoche, K. F., Combust. Flame
93:309–321 (1993).
15. Beeley, P., Griffiths, J. F., and Gray, P., Combust.
Flame 39:255–268 (1980).
16. Miles, R., and Lempert, W., Appl. Phys. B51:1–7
(1990).
17. Orth, A., Sick, V., Wolfrum, J., Maly, R. R., and Zahn,
M., Proc. Comb. Inst. 25:143–150 (1994).
18. Golz, P., and Andresen, P., Appl. Opt. 35:6054–6061
(1996).
19. Thurber, M. C., Grisch, F., and Hanson, R. K., Opt.
Lett. 22:251–253 (1997).
20. Thurber, M. C., Grisch, F., Kirby, B. J., Votmeier, M.,
and Hanson, R. K., Appl. Opt. 37:4963–4978 (1998).
21. Franck, J., Griffiths, J. F., and Nimmo, W., Proc.
Comb. Inst. 21:447–454 (1986).
22. Griffiths, J. F., Jiao, Q., Schreiber, M., Meyer, J., and
Knoche K. F., Proc. Comb. Inst. 25:1809–1815 (1994).
23. Tabaczinski, R. J., Hoult, D. P., and Keck, J. C., J.
Fluid Mech. 42: 249–256 (1970).
24. Amsden, A. A., Ramshaw, J. D., O’Rourke, P. J., and
Kulowicsz., Los Alamos Lab. Report, LA-102450MS,
1985.
25. Lee, D., and Hochgreb, S., Combust. Flame 114:531–
545 (1998).
26. Pilling, M. J. (Ed), Comprehensive Chemical Kinetics,
Vol. 35, Elsevier, Amsterdam, 1997.
1174 CLARKSON ET AL.](https://image.slidesharecdn.com/temperaturefieldsduringthedevelopmentofcombustioninarapidcompressionmachine-150806102355-lva1-app6891/75/Temperature-fields-during-the-development-of-combustion-in-a-rapid-compression-machine-13-2048.jpg)


This document details experiments conducted on temperature and concentration fields during combustion in a rapid compression machine, utilizing Rayleigh scattering and laser-induced fluorescence techniques. The study explores how these fields develop during combustion processes, particularly focusing on the exothermic decomposition of di-t-butyl peroxide, highlighting the effects of temperature stratification on reaction rates. The findings support improved understanding and modeling of combustion dynamics applicable to rapid compression machines.