Download as PDF, PPTX
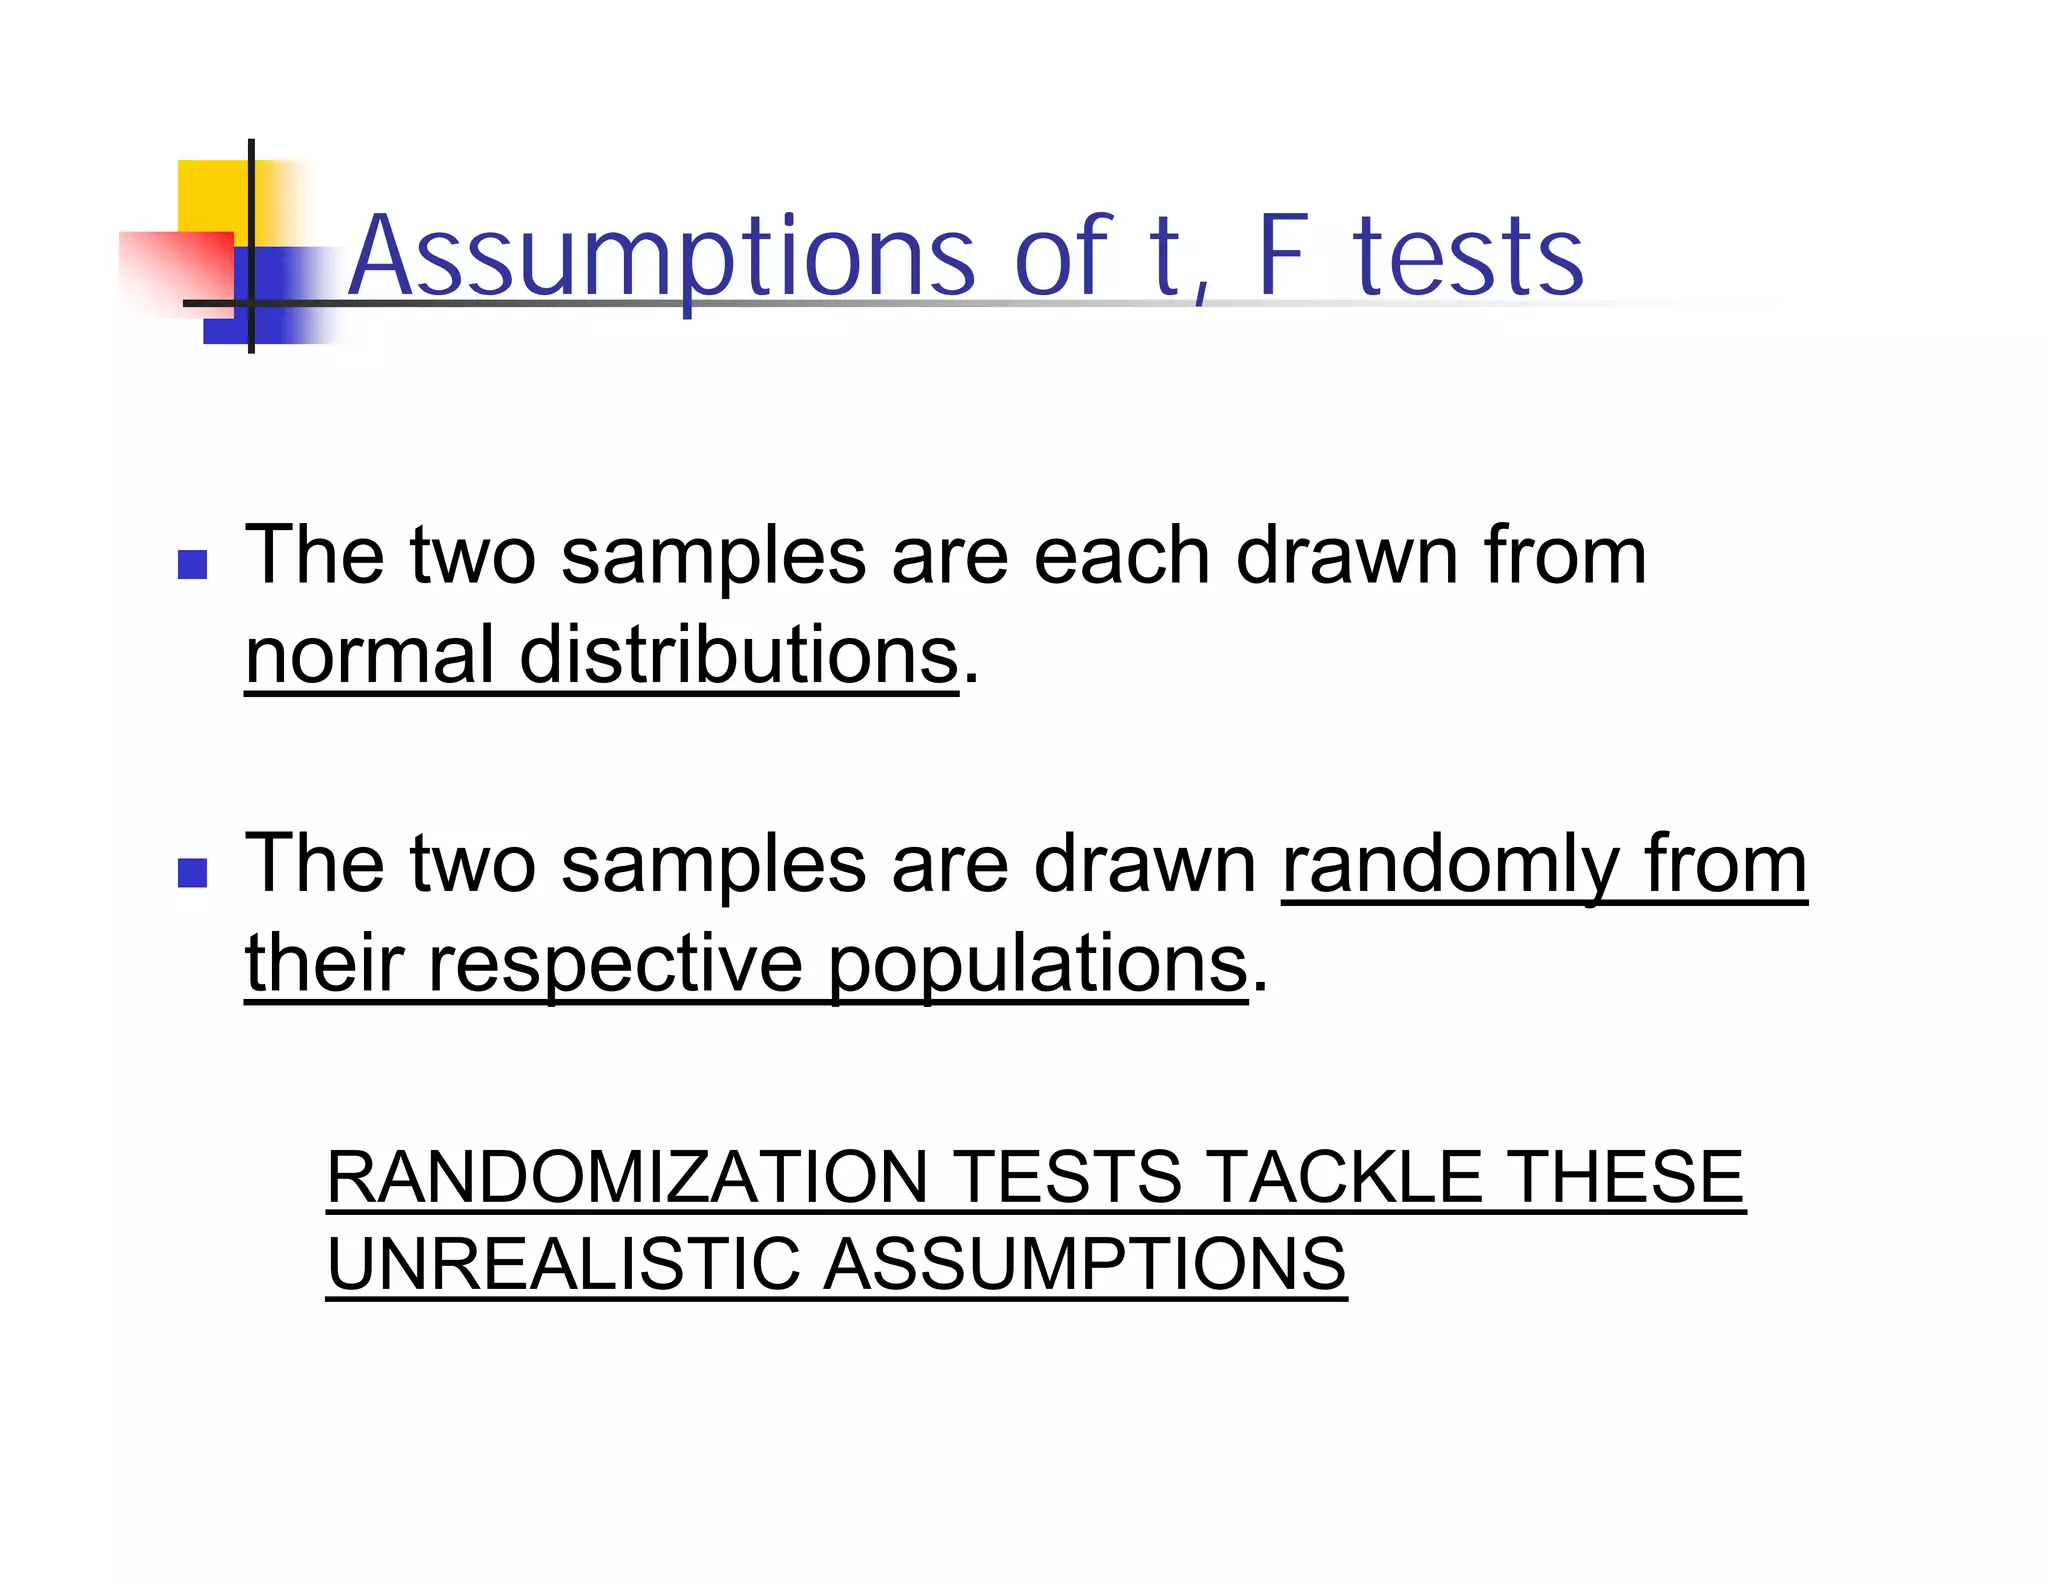
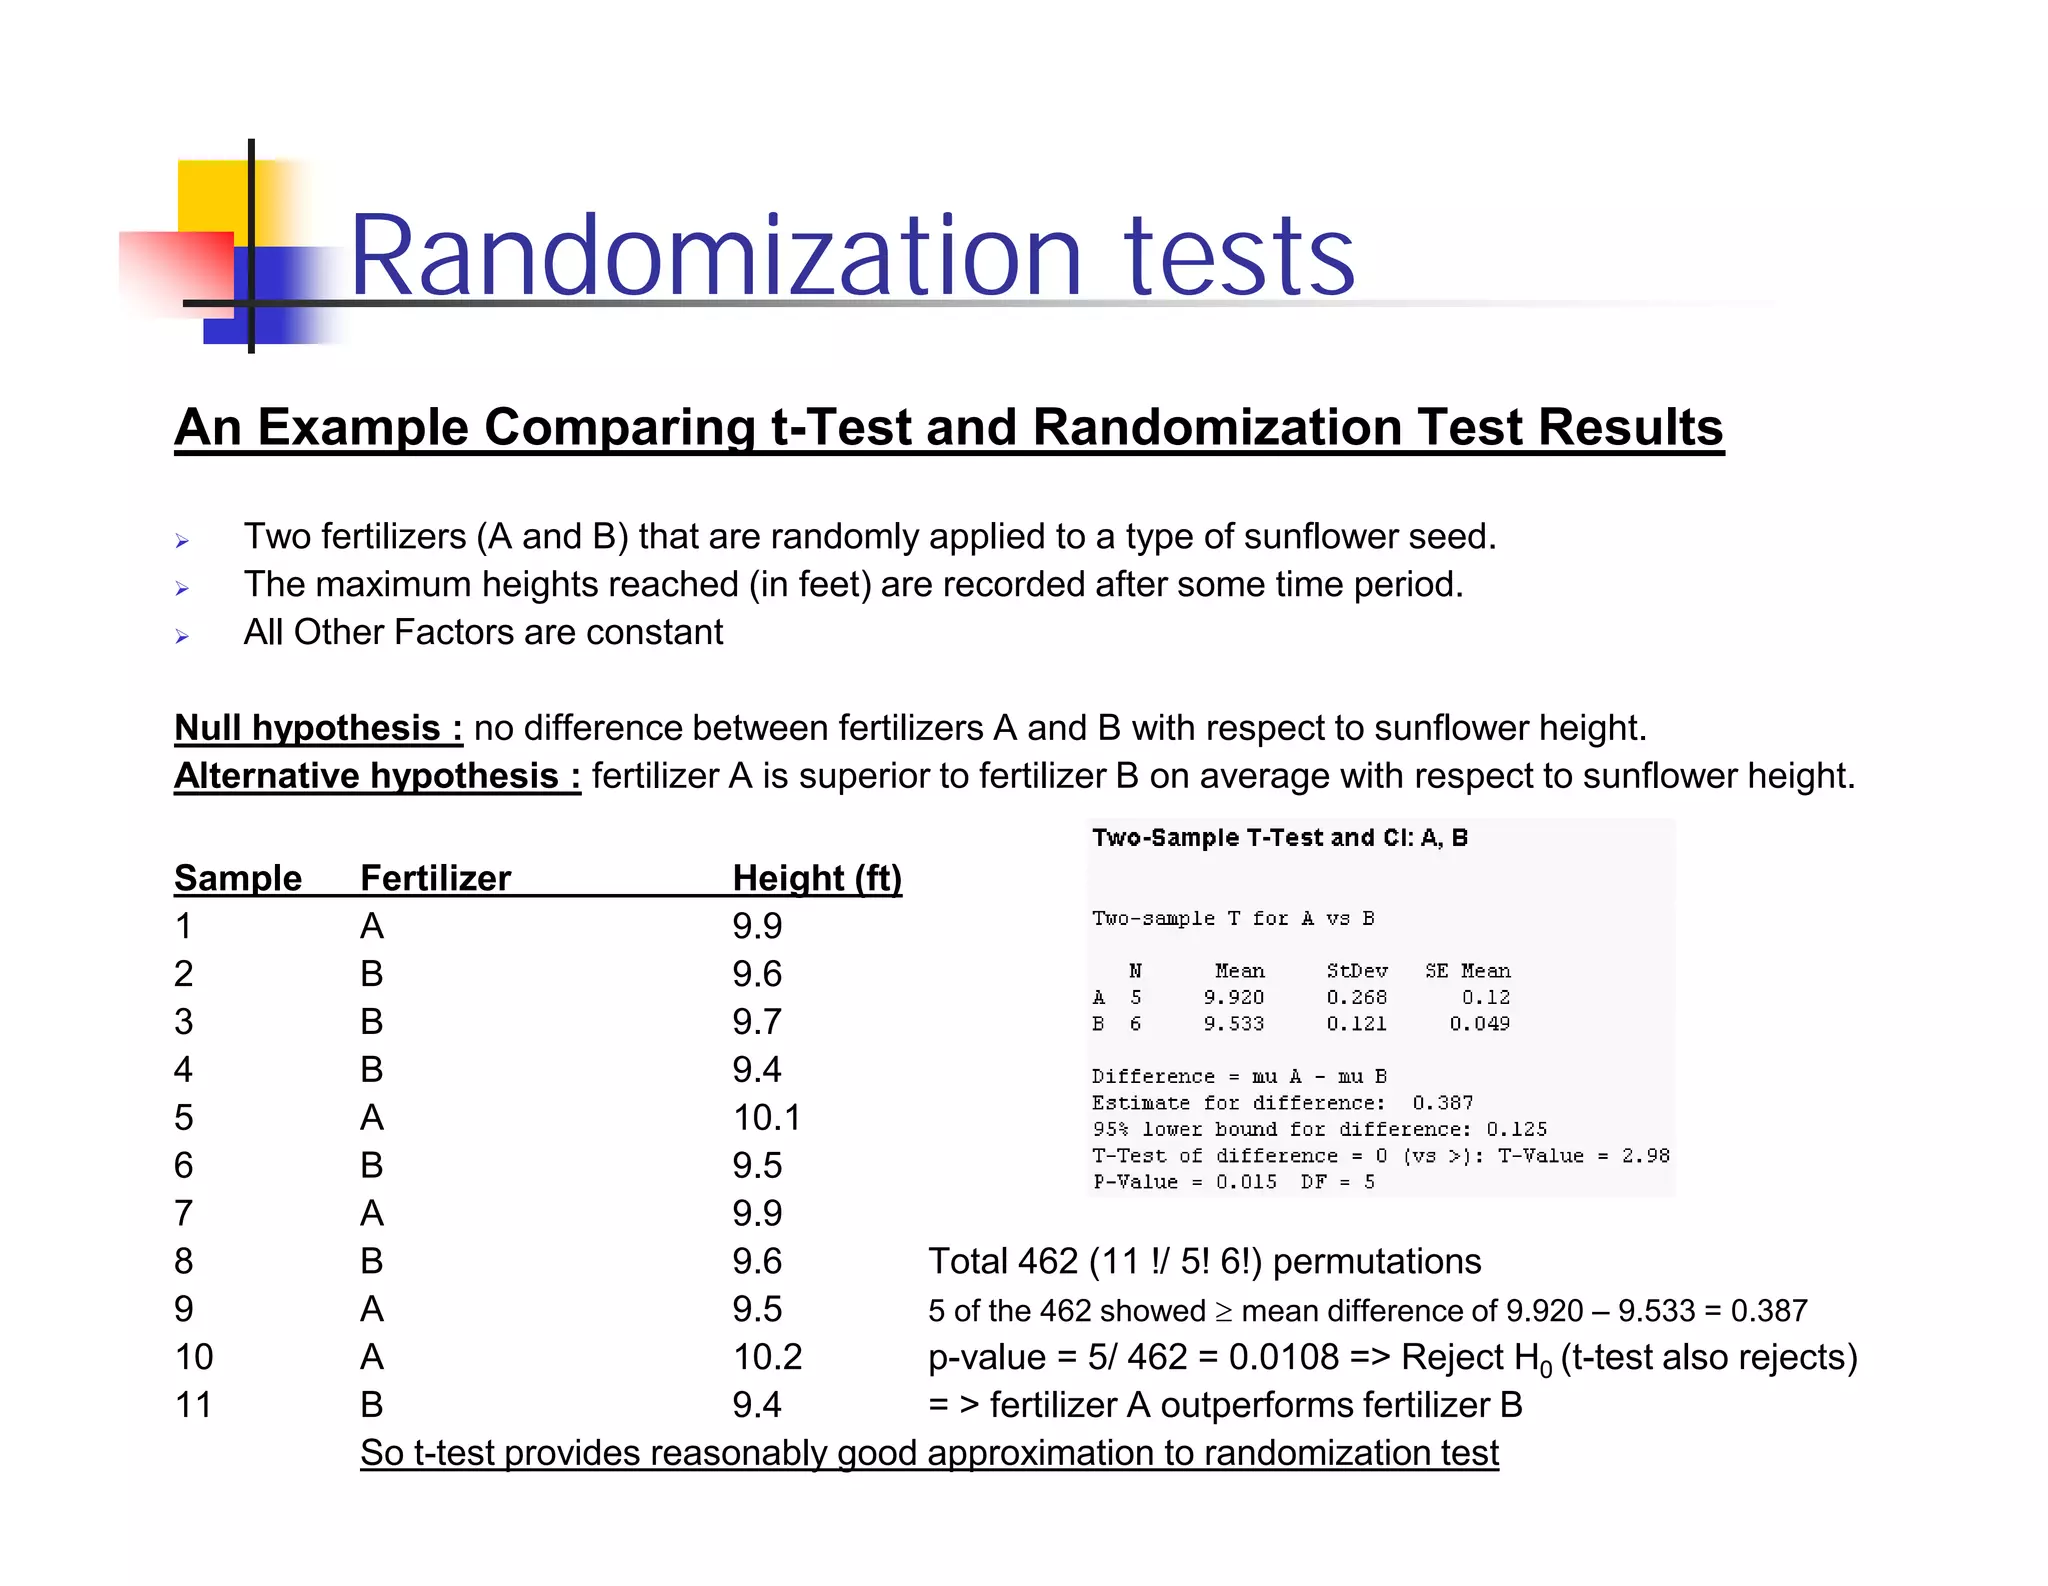
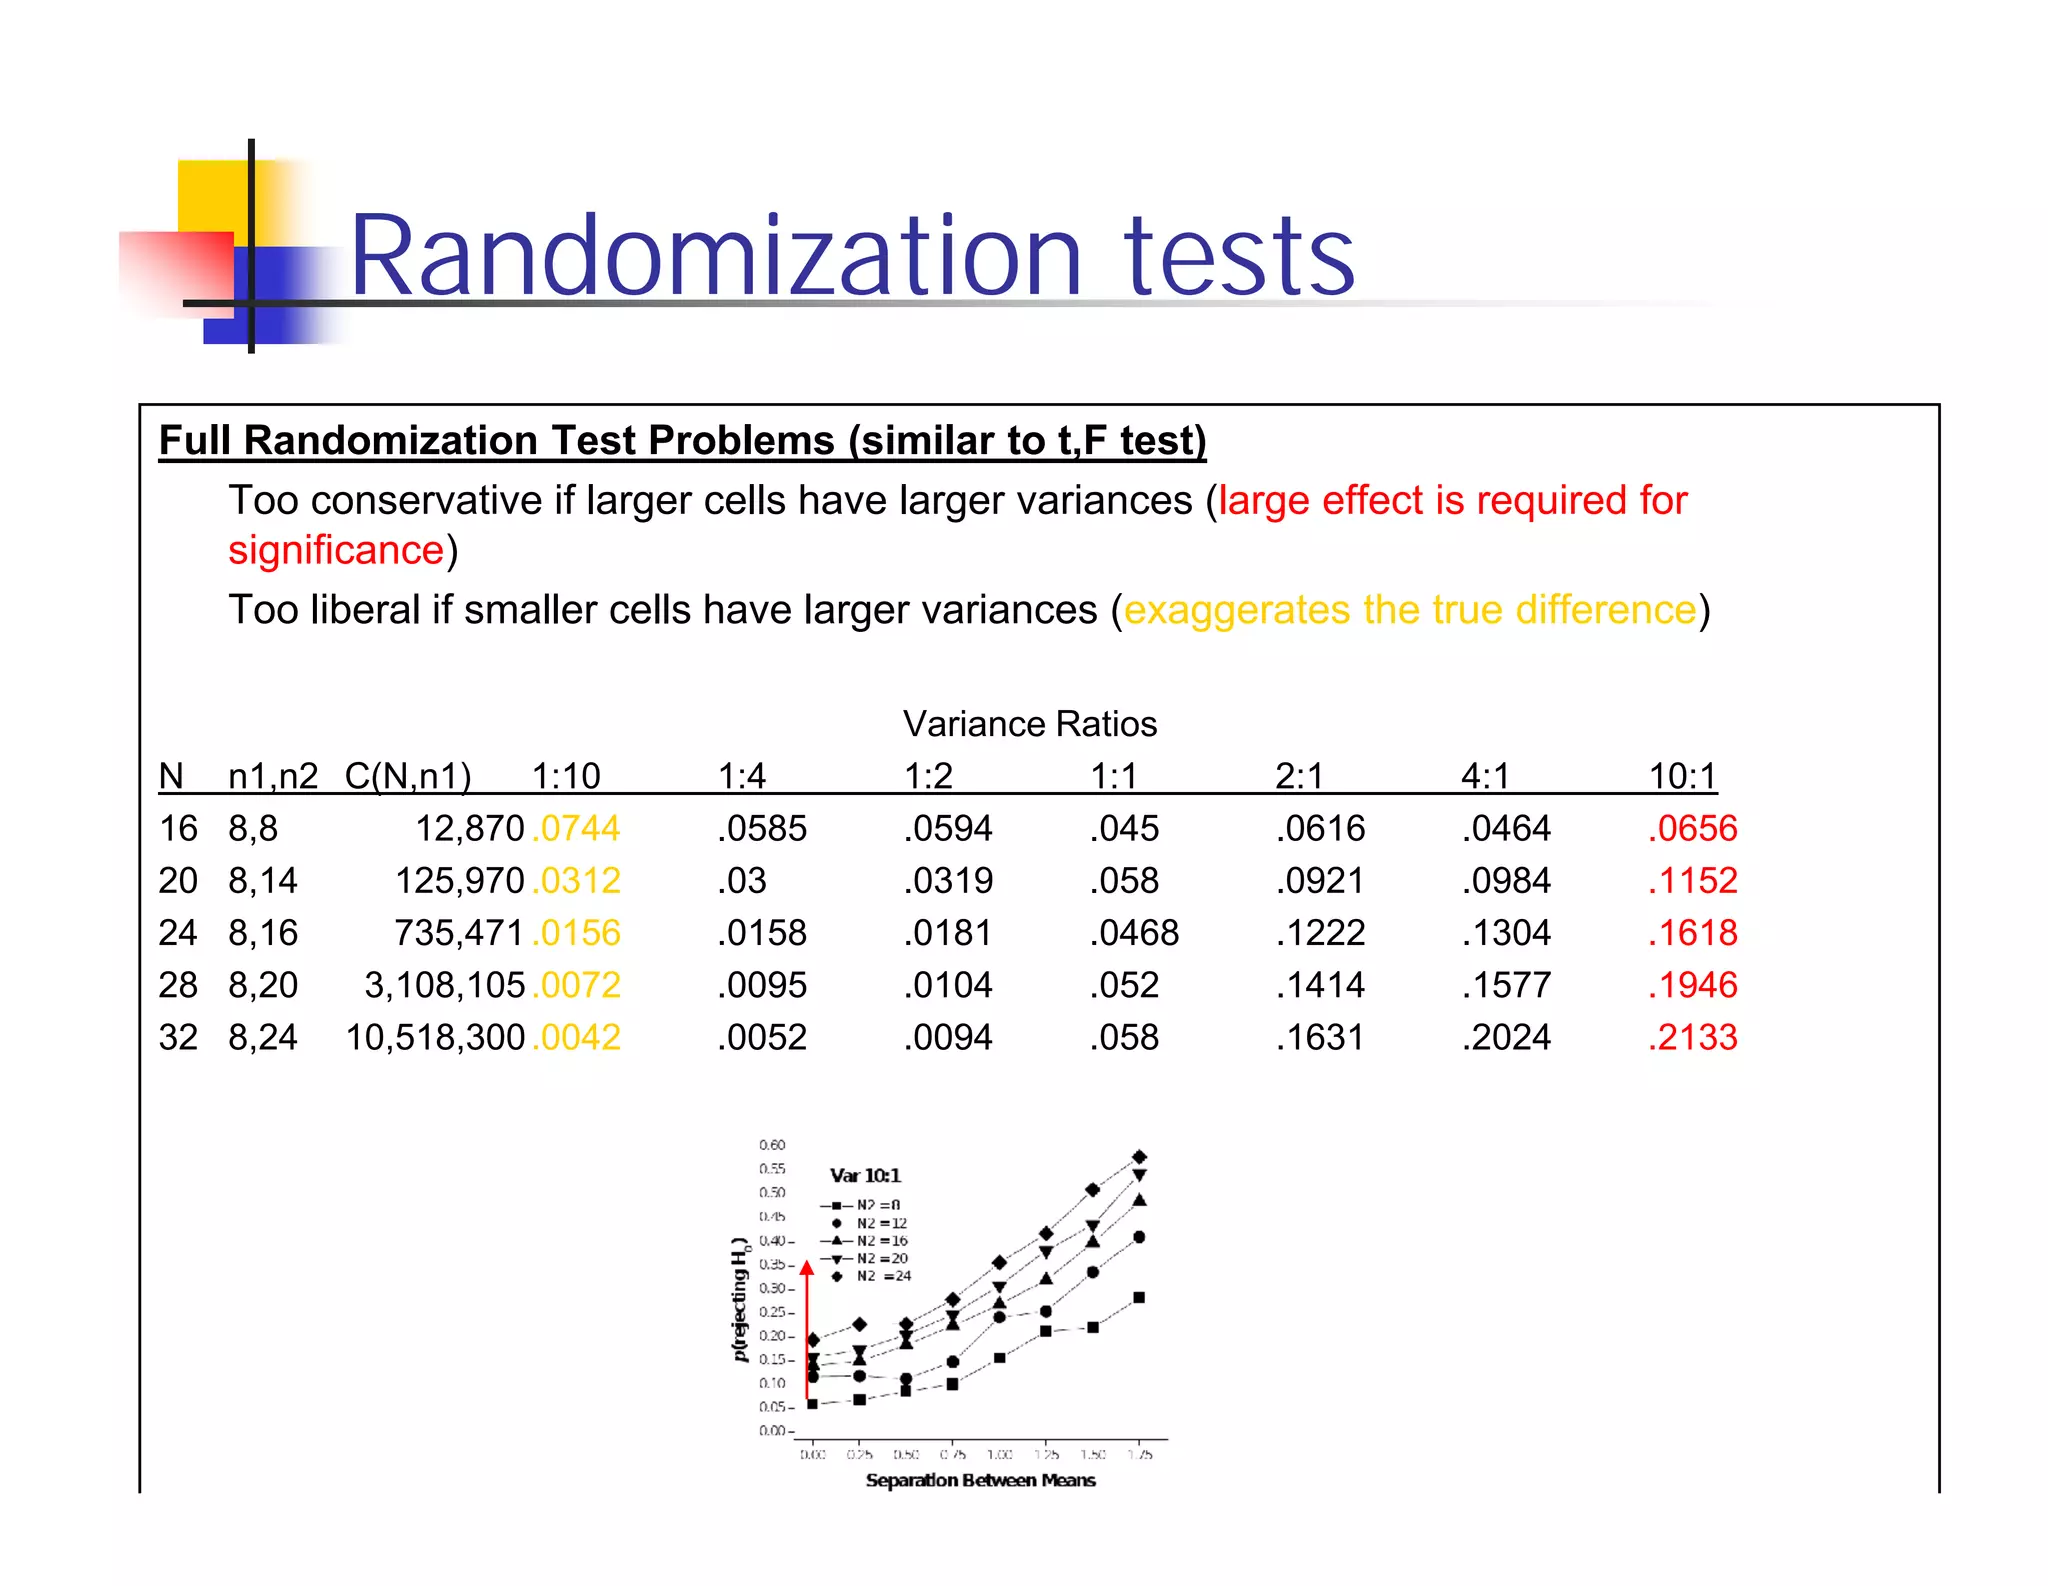
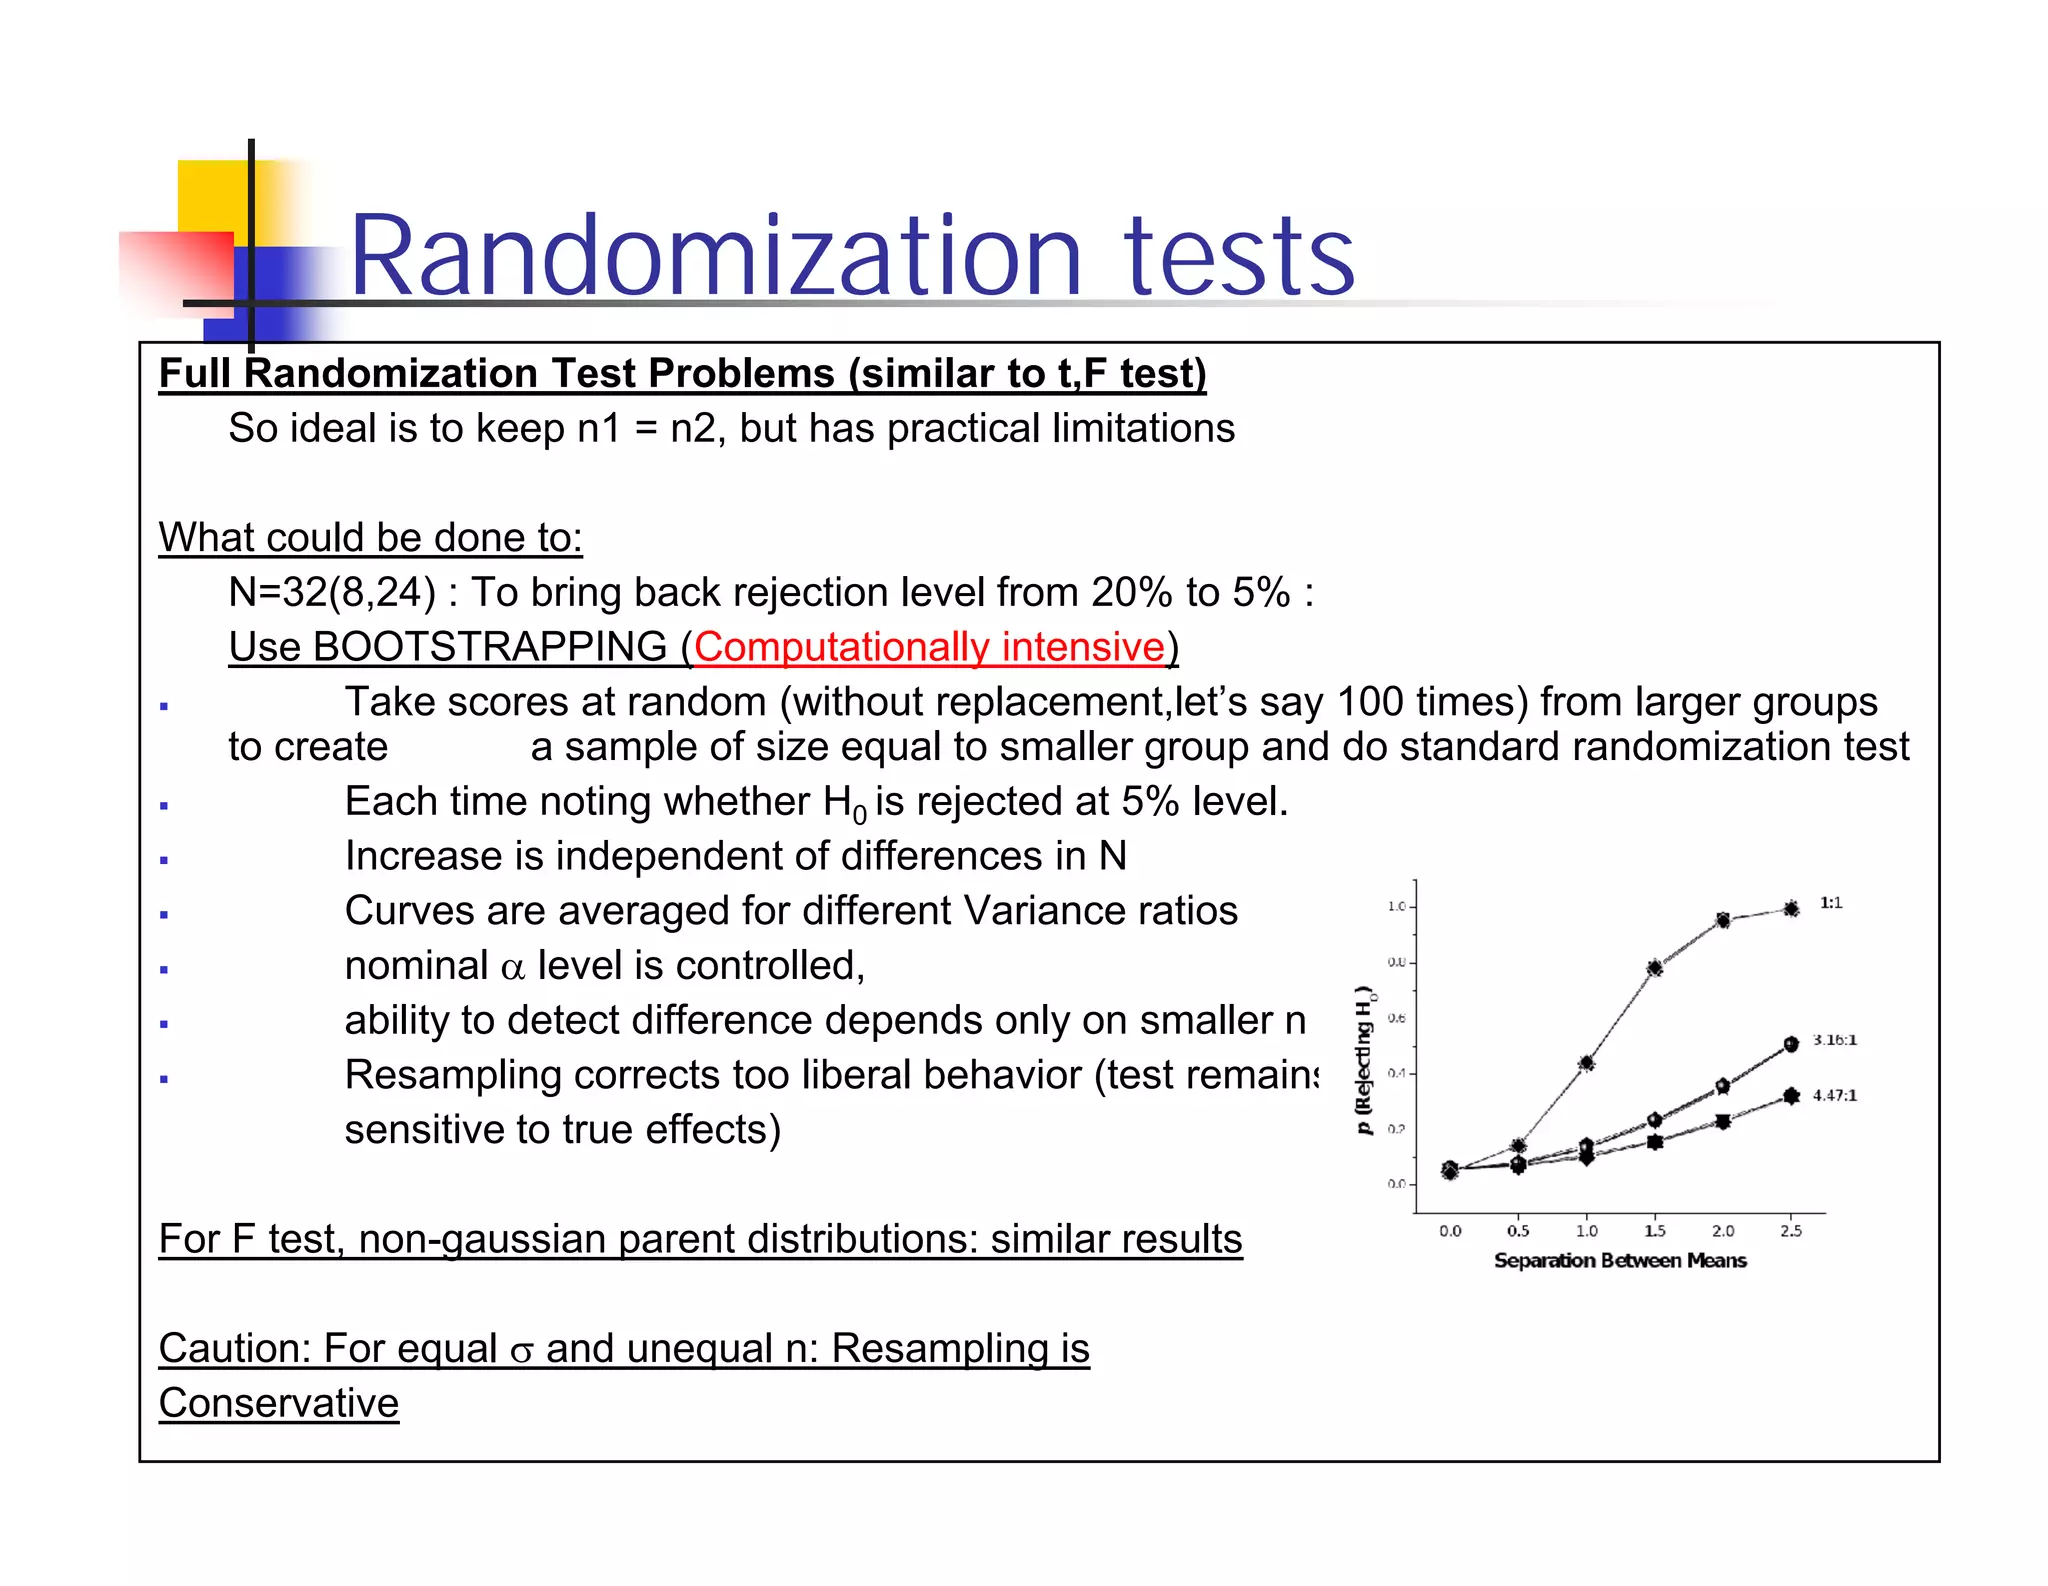
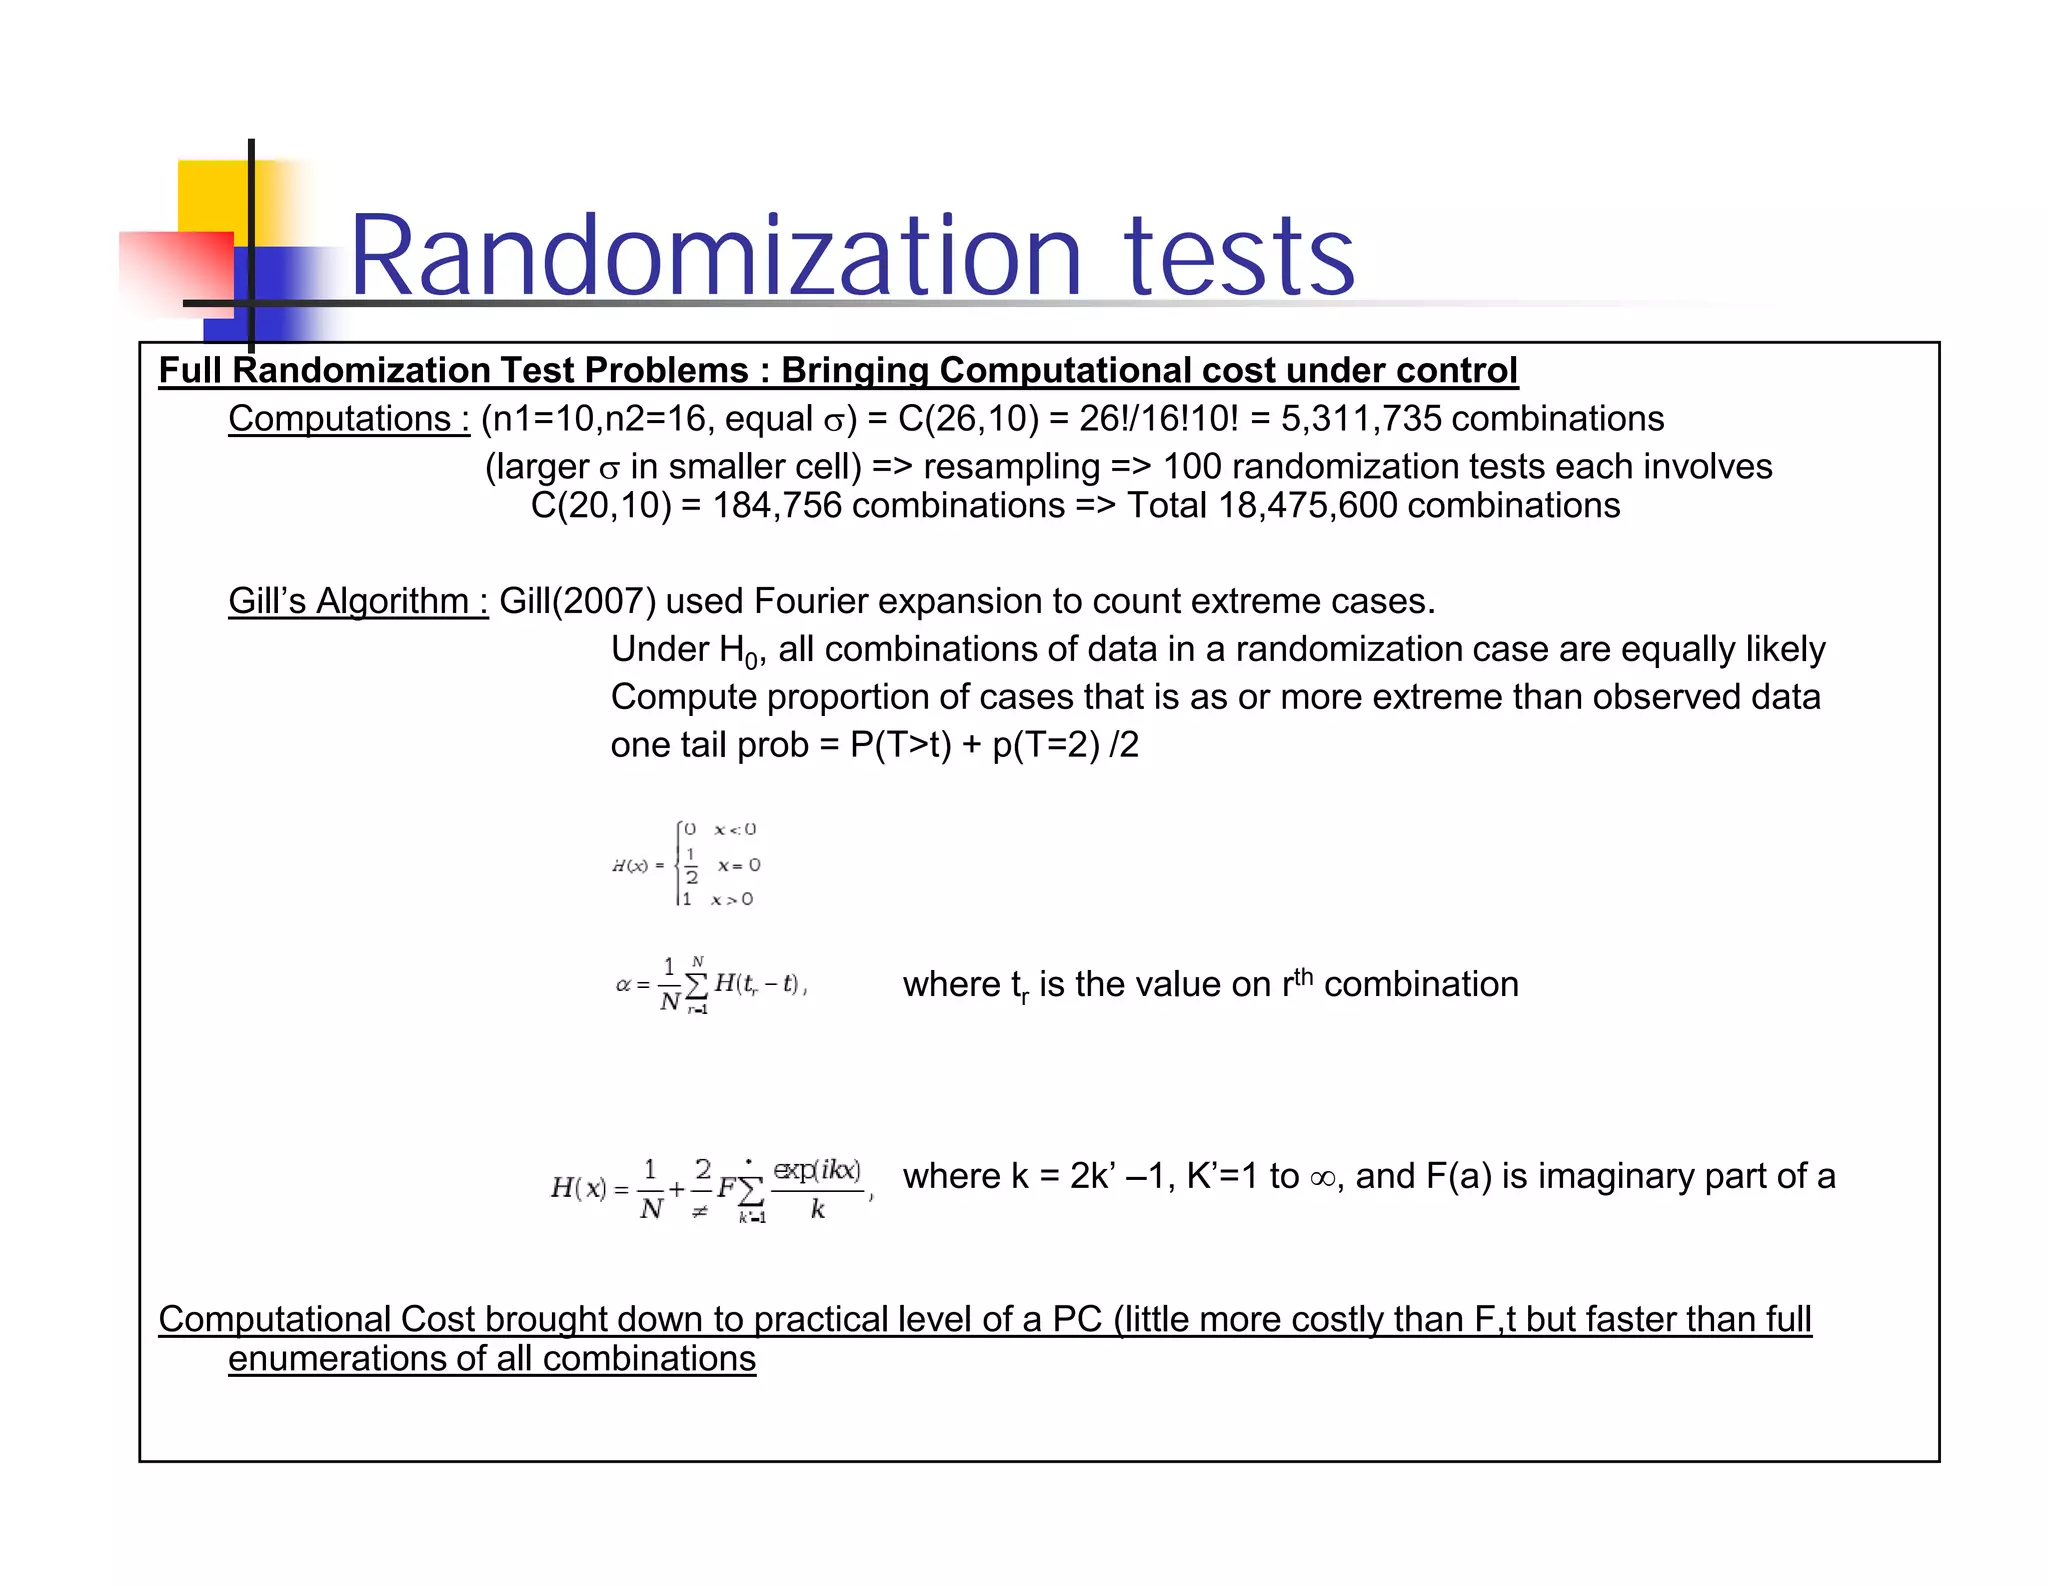
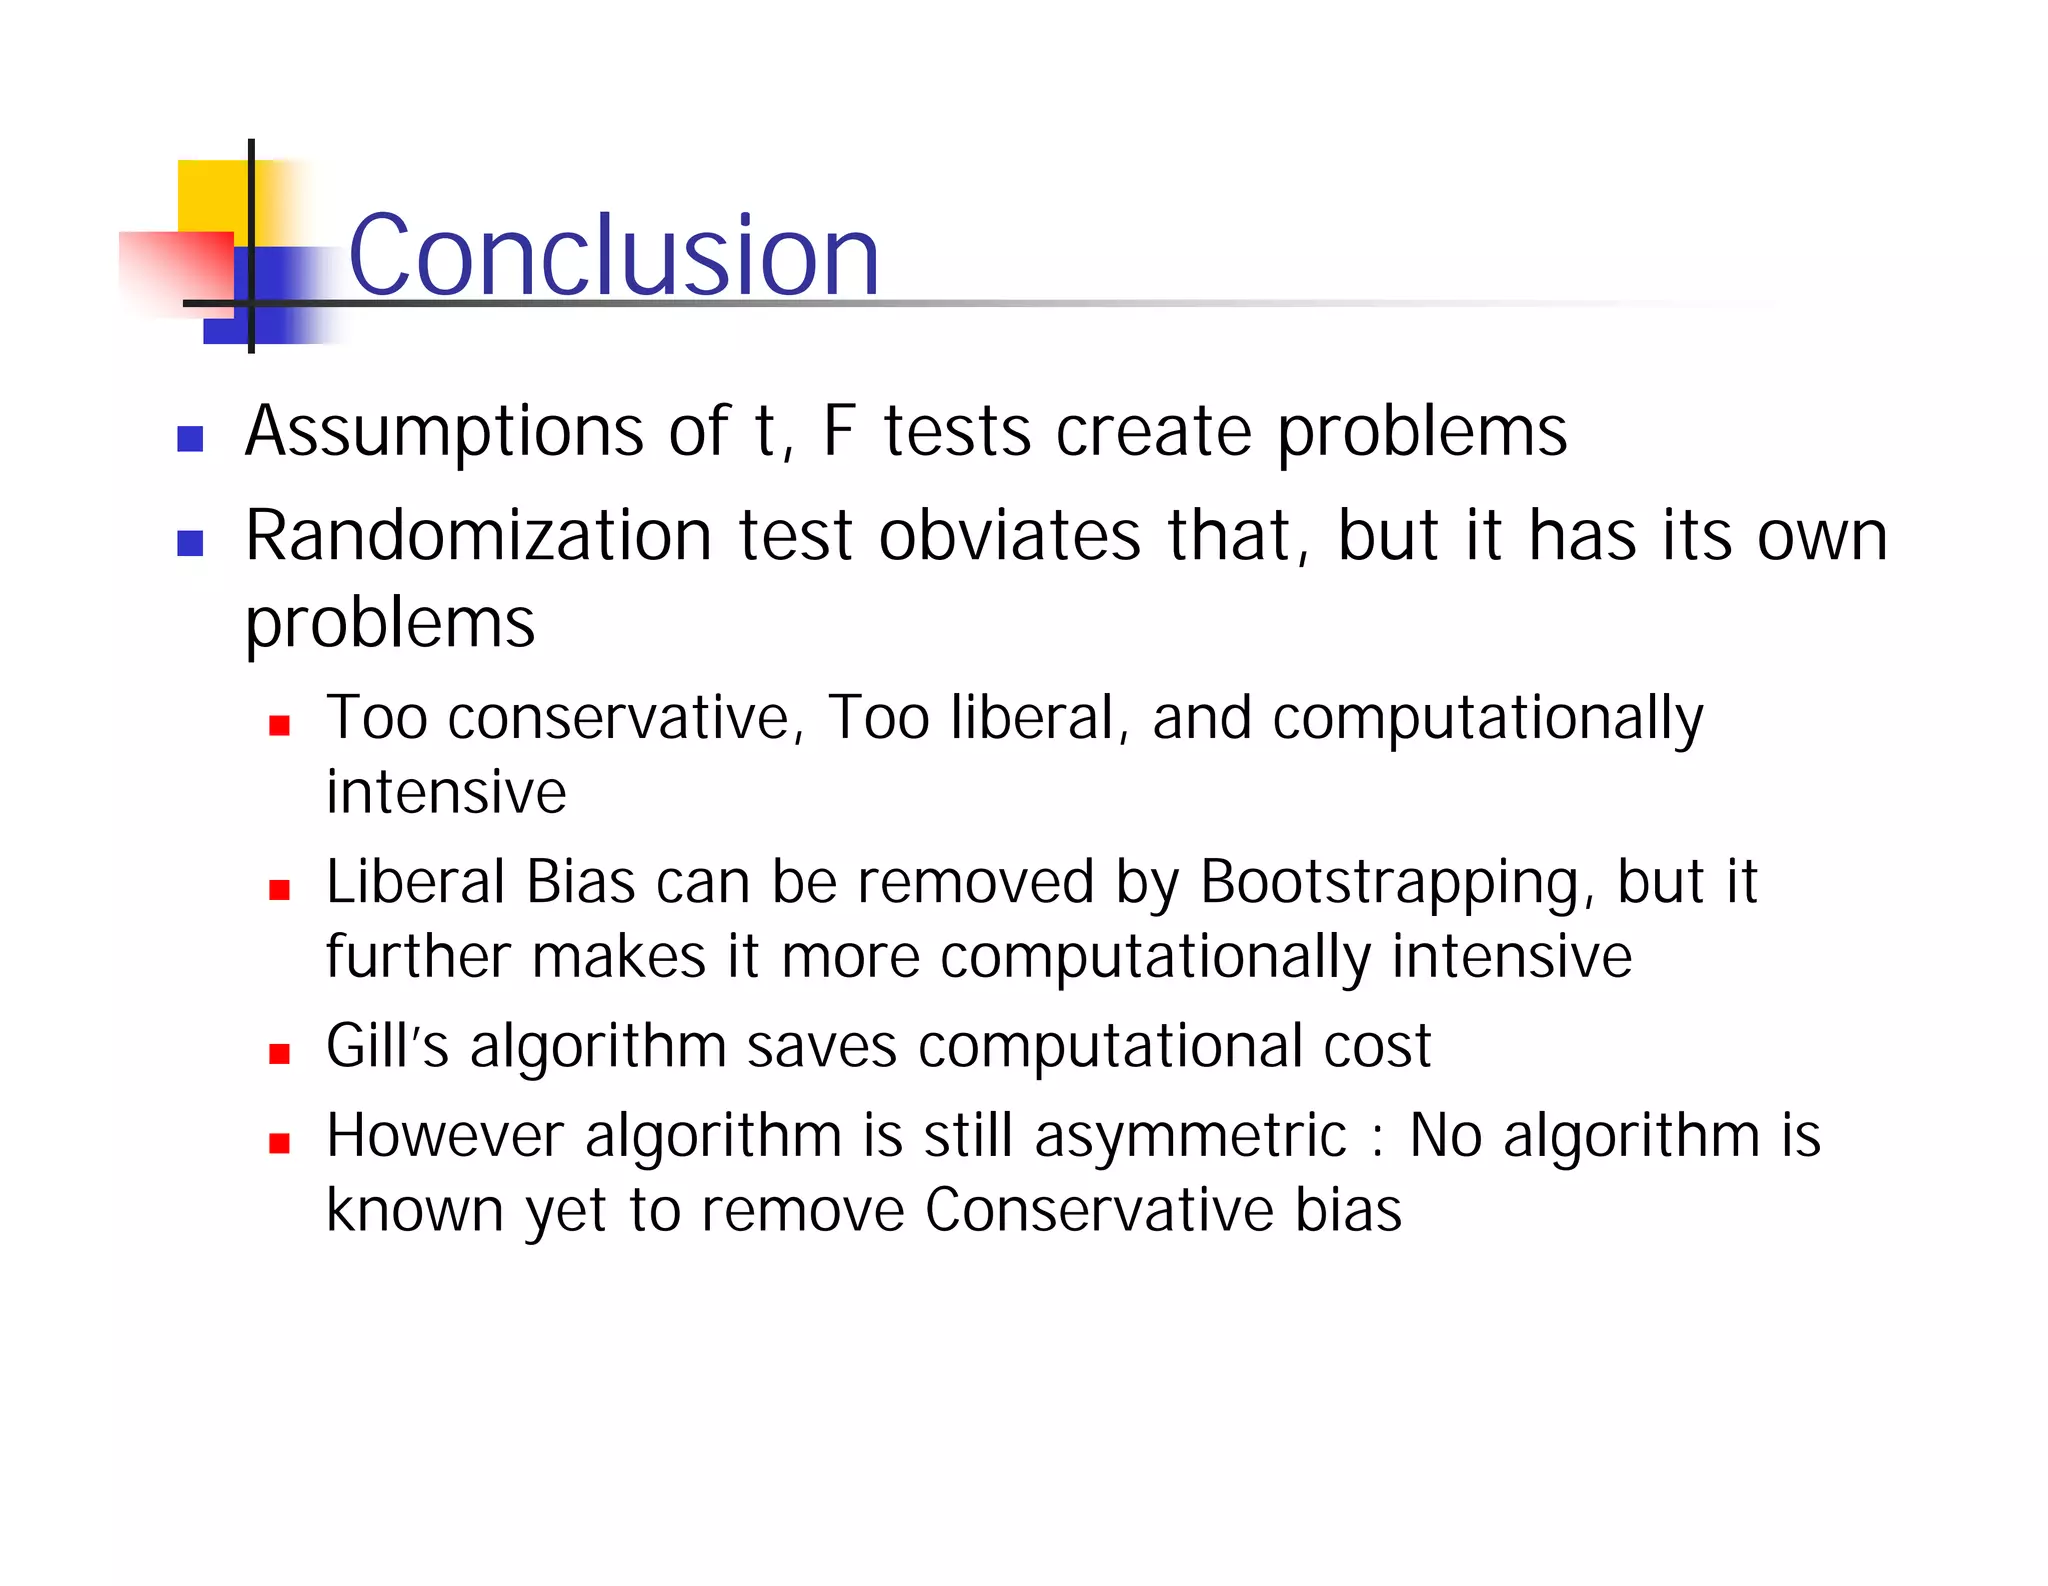

Randomization tests provide an alternative to t-tests and F-tests that does not rely on assumptions of normality or random sampling. However, randomization tests can be too liberal or conservative depending on differences in sample sizes. Bootstrapping and Gill's algorithm can help address these issues. Bootstrapping resamples the larger sample to match the size of the smaller sample, controlling for liberal bias. Gill's algorithm uses Fourier expansion to efficiently calculate p-values from all permutations, reducing computational cost compared to full enumeration. However, conservative bias remains a challenge without a known solution.