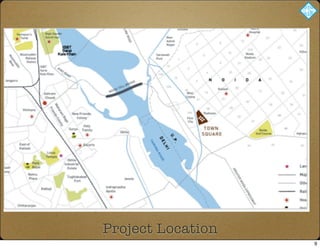
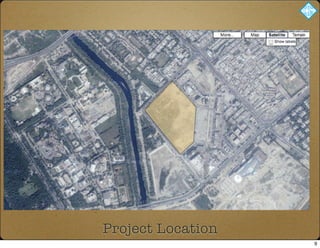
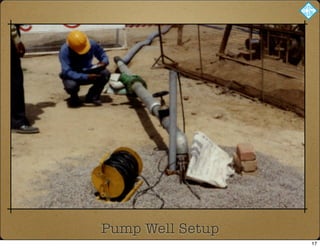
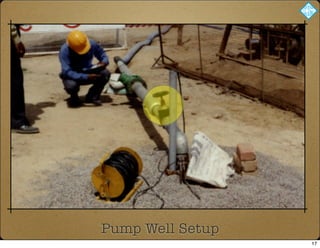
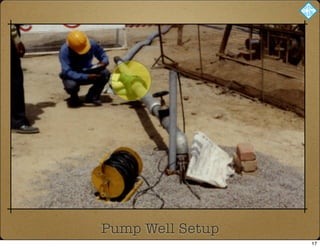
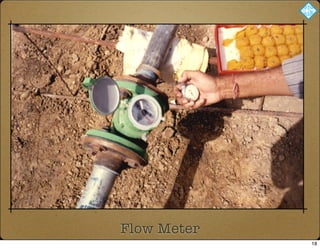
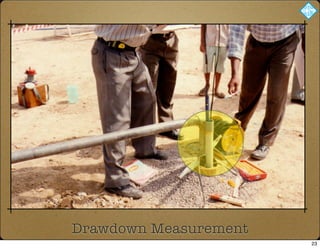
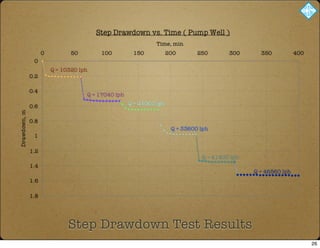
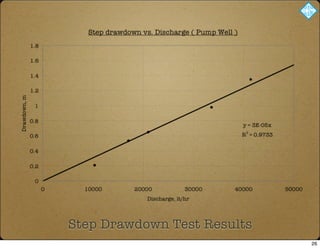
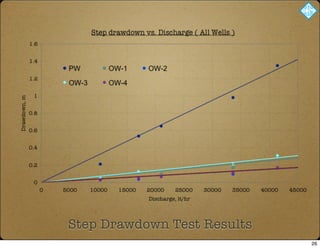
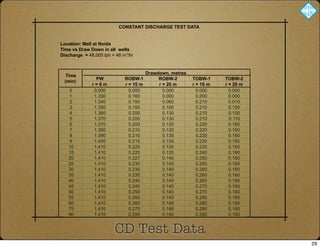
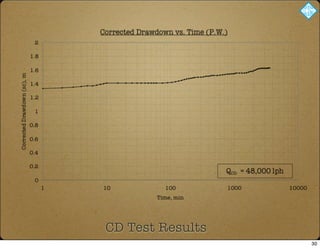
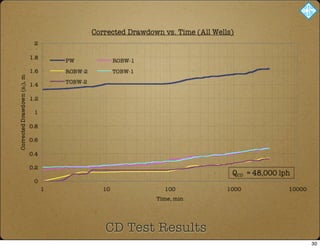
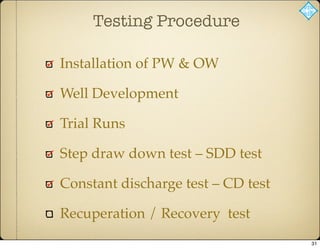
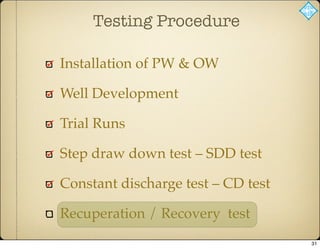
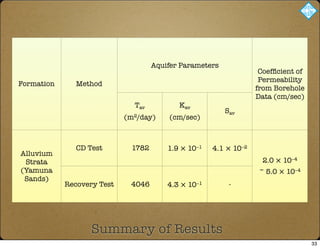
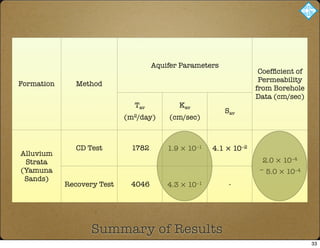
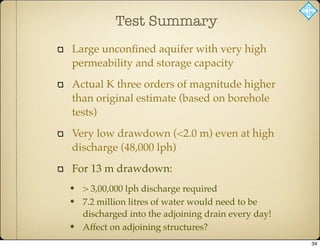
6. The Challenge
Effective Design of Dewatering Systems for
construction sites requires precise estimates of
hydrogeological parameters of the aquifer,
such as hydraulic conductivity / permeability,
etc.
4
7. The Challenge
Effective Design of Dewatering Systems for
construction sites requires precise estimates of
hydrogeological parameters of the aquifer,
such as hydraulic conductivity / permeability,
etc.
..particularly on sites where alluvial sands are
encountered
4
8. Definitions
1. Hydraulic Conductivity (K), m/sec
Volume of water (m3) through unit section of soil (m2) in unit
time (s) under unit hydraulic gradient.
2. Transmissivity (T), m2/day (Productivity of an aquifer)
Water capacity which flows per unit length through an
aquifer under hydraulic gradient
3. Storage coefficient (%)
Volume of water it takes / releases per unit surface area of
aquifer under unit change of head.
4. Specific capacity
Discharge for unit time for unit draw down
c = Q / s
5
9. Laboratory Permeability Tests (Falling Head,
Constant Head)
Tracer Tests
Borehole Tests
Falling Head in Soils
Packer Tests in Rock
Full Scale Pump Out / Aquifer Tests
Geotechnical Investigations
6
10. Laboratory Permeability Tests (Falling Head,
Constant Head)
Tracer Tests
Borehole Tests
Falling Head in Soils
Packer Tests in Rock
Full Scale Pump Out / Aquifer Tests
Geotechnical Investigations
6
11. Pump Out / Aquifer Test
Advantages
Determine hydraulic parameters on global scale
Results directly used for design of dewatering
systems
Design the test as per site/project requirements
7
15. Project Overview
Located in a densely populated area
As per Initial Planning:
G+5, 3 basements
Foundation Level = 18 m below OGL
10
16. Site Conditions
Site Stratigraphy:
✓ Medium dense sand (SP) to
35~40 m depth
✓ Static GWT at 8 m
Purpose:
✓ Lower the GW level to 21 m
depth below OGL?? (i.e. 13 m
drawdown!)
✓ Test performed from excavated
level (~7 m below OGL)
11
20. Pump Well Setup
6.0m
3.0m
15.0m
BLANK CASING
200mm DIA
BLANK CASING
200mm DIA
SLOTTED CASING
200 mm DIA
BOTTOM CAP
25.0m
PUMP WELL DIA 300 mm
GRAVEL 250 mm
13
21. Pump Well Setup
6.0m
3.0m
15.0m
BLANK CASING
200mm DIA
BLANK CASING
200mm DIA
SLOTTED CASING
200 mm DIA
BOTTOM CAP
Pea Gravels
25.0m
PUMP WELL DIA 300 mm
GRAVEL 250 mm
13
22. Pump Well Setup
6.0m
3.0m
15.0m
BLANK CASING
200mm DIA
BLANK CASING
200mm DIA
SLOTTED CASING
200 mm DIA
BOTTOM CAP
Pea Gravels
PUMP
25.0m
PUMP WELL DIA 300 mm
GRAVEL 250 mm
13
23. LVL (-7.0 m)
3..0m
PRESENT EXCAVATION
WORKING, LVL
OBSERVATION WELL DIA 150 mm
GRAVEL 250 mm
SLOTTED CASING
100 mm DIA
BLANK CASING
100mm DIA
18.0m
LVL (-25.0 m)
15.0m
OW2
BOTTOM CAP
3..0m
LVL (-7.0 m)
GRAVEL 250 mm
LVL (-31.0 m)
OW1
OBSERVATION WELL DIA 150 mm
21.0m
24.0m
Pea Gravels
Observation Well Setup
14
31. Testing Procedure
Installation of PW & OW
Well Development
Trial Runs
Step drawdown test – SDD test
Constant discharge test – CD test
Recuperation / Recovery test
19
32. Testing Procedure
Installation of PW & OW
Well Development
Trial Runs
Step drawdown test – SDD test
Constant discharge test – CD test
Recuperation / Recovery test
19
33. Testing Procedure
Installation of PW & OW
Well Development
Trial Runs
Step drawdown test – SDD test
Constant discharge test – CD test
Recuperation / Recovery test
20
34. Testing Procedure
Installation of PW & OW
Well Development
Trial Runs
Step drawdown test – SDD test
Constant discharge test – CD test
Recuperation / Recovery test
20
35. Step Drawdown Test
Purpose
To estimate...
Short-term yield-drawdown relationship
Estimate ‘Q’ for CD test
Determine Well Efficiency, etc.
21
36. Step Drawdown Test
Overview
Steps estimated on maximum yield of the well
based upon trial runs
Discharge is increased in 4~6 steps of 60~100 min
each
Discharge controlled by Control Valve
Average discharge and drawdown recorded with
time for each step
22
44. Testing Procedure
Installation of PW & OW
Well Development
Trial Runs
Step drawdown test – SDD test
Constant discharge test – CD test
Recuperation / Recovery test
27
45. Testing Procedure
Installation of PW & OW
Well Development
Trial Runs
Step drawdown test – SDD test
Constant discharge test – CD test
Recuperation / Recovery test
27
46. Constant Discharge Test
Overview
To determine hydraulic characteristics of the
aquifer within the radius of influence of PW
PW continuously pumped to ensure desired
drawdown at steady state.
Water level readings are recorded in PW and
OW’s at regular intervals.
Test continues till steady state / equilibrium
28
50. Testing Procedure
Installation of PW & OW
Well Development
Trial Runs
Step draw down test – SDD test
Constant discharge test – CD test
Recuperation / Recovery test
31
51. Testing Procedure
Installation of PW & OW
Well Development
Trial Runs
Step draw down test – SDD test
Constant discharge test – CD test
Recuperation / Recovery test
31
52. Recuperation / Recovery Test
After CD test is complete, Pump is stopped
Take water level readings in same sequence
as for CD
Test continues till water level rises up to
static level
Provides independent check of CD Results
32
53. Formation Method
Aquifer Parameters
Coefficient of
Permeability
from Borehole
Data (cm/sec)
Tav
(m2/day)
Kav
(cm/sec)
Sav
Alluvium
Strata
(Yamuna
Sands)
CD Test 1782 1.9 × 10⁻¹ 4.1 × 10⁻²
2.0 × 10⁻⁴
~ 5.0 × 10⁻⁴
Recovery Test 4046 4.3 × 10⁻¹ -
Summary of Results
33
54. Formation Method
Aquifer Parameters
Coefficient of
Permeability
from Borehole
Data (cm/sec)
Tav
(m2/day)
Kav
(cm/sec)
Sav
Alluvium
Strata
(Yamuna
Sands)
CD Test 1782 1.9 × 10⁻¹ 4.1 × 10⁻²
2.0 × 10⁻⁴
~ 5.0 × 10⁻⁴
Recovery Test 4046 4.3 × 10⁻¹ -
Summary of Results
33
55. Test Summary
Large unconfined aquifer with very high
permeability and storage capacity
Actual K three orders of magnitude higher
than original estimate (based on borehole
tests)
Very low drawdown (<2.0 m) even at high
discharge (48,000 lph)
For 13 m drawdown:
• > 3,00,000 lph discharge required
• 7.2 million litres of water would need to be
discharged into the adjoining drain every day!
• Affect on adjoining structures?
34
56. Test Consequences
Design altered - raised final excavation level
Deep diaphragm wall constructed, which acts as
cut-off-barrier to GW flow, restricts the aquifer
extent, and protects nearby structures from
subsistence due to migration of fines etc.
Installed dewatering wells spaced at 25~30 m
35